The financial markets, often characterized by their intricate dance between macro forces and technical precision, have presented a particularly compelling narrative around silver this past week. As the dust settles on Friday's close, XAGUSD finds itself hovering precariously around the $67.98 mark. This level is not just a number; it represents a critical battleground where the forces of inflation hedging, industrial demand, and broader risk sentiment collide. With a significant weekly decline of 7.26%, the precious metal is at a crossroads, demanding a closer look at the confluence of factors that will dictate its next move. This analysis delves into the week's key developments, the technical underpinnings, and the overarching market context to chart a course through the current volatility.
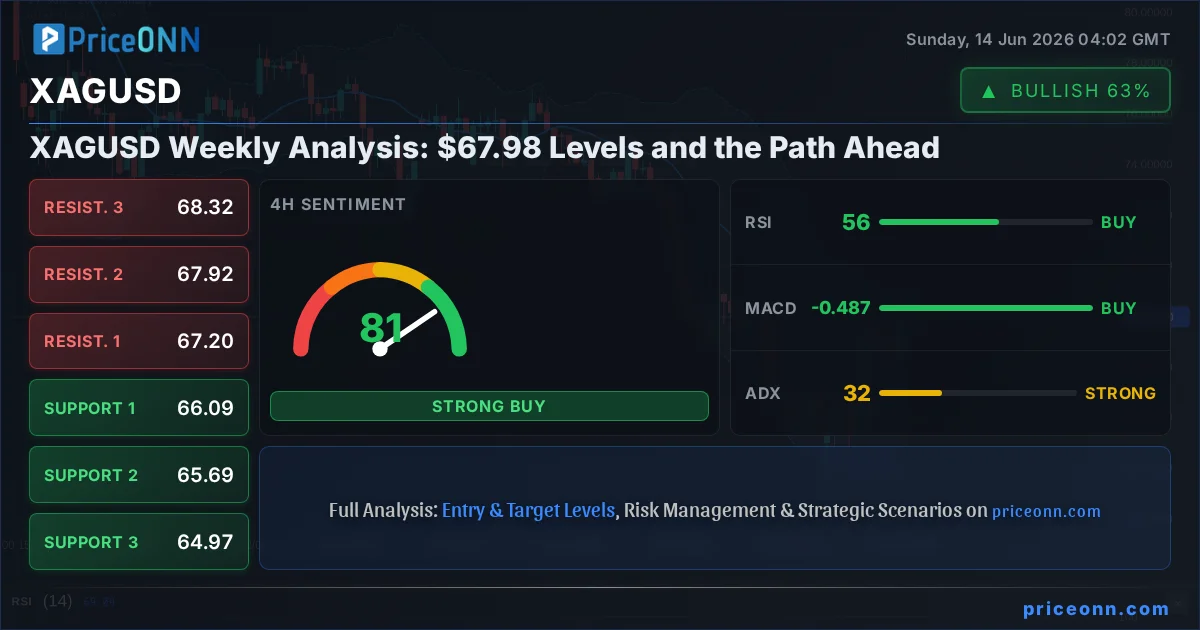
- XAGUSD closed the week at $67.98, down 7.26% after a volatile trading period.
- Key support is holding around $61.70, while resistance looms near $67.41.
- The ADX at 32.46 on the 4H timeframe signals a strong trend, yet conflicting signals from RSI and MACD require careful navigation.
- Geopolitical optimism in the Middle East and a potential pause in central bank tightening could influence safe-haven demand for silver.
The past week was a turbulent one for the precious metals complex, with silver, or XAGUSD, experiencing a sharp 7.26% decline to close at $67.98. This downturn occurred against a backdrop of shifting macroeconomic narratives and evolving geopolitical landscapes. Early in the week, optimism surrounding de-escalation in the Middle East, particularly concerning potential breakthroughs in US-Iran relations, sent shockwaves through commodity markets. Oil prices, a key inflation indicator, saw a significant tumble as fears of supply disruptions eased. This reduction in inflation expectations naturally puts downward pressure on traditional inflation hedges like gold and silver. The narrative shifted from immediate inflation concerns to a more nuanced discussion about central bank policy paths, with markets beginning to price in potential pauses or even shifts in monetary tightening cycles later in the year. This global sentiment shift, moving from 'risk-off' towards a more cautious 'risk-on' or at least 'less risk-off' environment, directly impacts the demand for safe-haven assets.
The correlation between silver and the broader economic sentiment cannot be overstated. As the US Dollar Index (DXY) experienced fluctuations, it added another layer of complexity. While the DXY showed signs of weakness earlier in the week, potentially supporting commodities, subsequent market movements indicated a more complex interplay. The strength or weakness of the dollar often dictates the attractiveness of dollar-denominated assets like silver for international investors. A weaker dollar generally makes silver cheaper for holders of other currencies, potentially increasing demand, and vice-versa. This week, the DXY itself navigated choppy waters, influenced by the same geopolitical and monetary policy shifts affecting silver, creating a feedback loop that traders closely monitored. The interplay between inflation expectations, central bank rhetoric, and geopolitical stability forms the bedrock upon which commodity prices, including silver, are built. Understanding these macro drivers is paramount to interpreting the technical signals that follow.
Navigating the Technical Landscape: A Divergent Picture
On the technical front, XAGUSD presents a complex and somewhat divergent picture across different timeframes, underscoring the current market's indecision. The 1-hour chart shows a neutral trend with moderate strength (50%), indicating short-term chop rather than a committed direction. Here, key support levels are identified at $67.72 and $67.56, while immediate resistance stands at $68.18. The RSI(14) at 63.95 resides in neutral territory but leans towards an upward bias, suggesting some lingering buying interest in the intraday timeframe. However, the MACD paints a less optimistic short-term picture, showing negative momentum with the MACD line below its signal line. The Bollinger Bands are trading above the middle band, hinting at upward pressure, and Stochastic indicators are flashing a bullish signal (%K > %D) in the upper range. Yet, the ADX at a mere 18.85 signifies a weak trend, confirming the lack of strong directional conviction on the hourly chart. The overall signal for the 1H timeframe leans towards 'BUY' (7 buys, 1 sell, 0 neutral), but the underlying weakness in momentum and trend strength warrants caution.
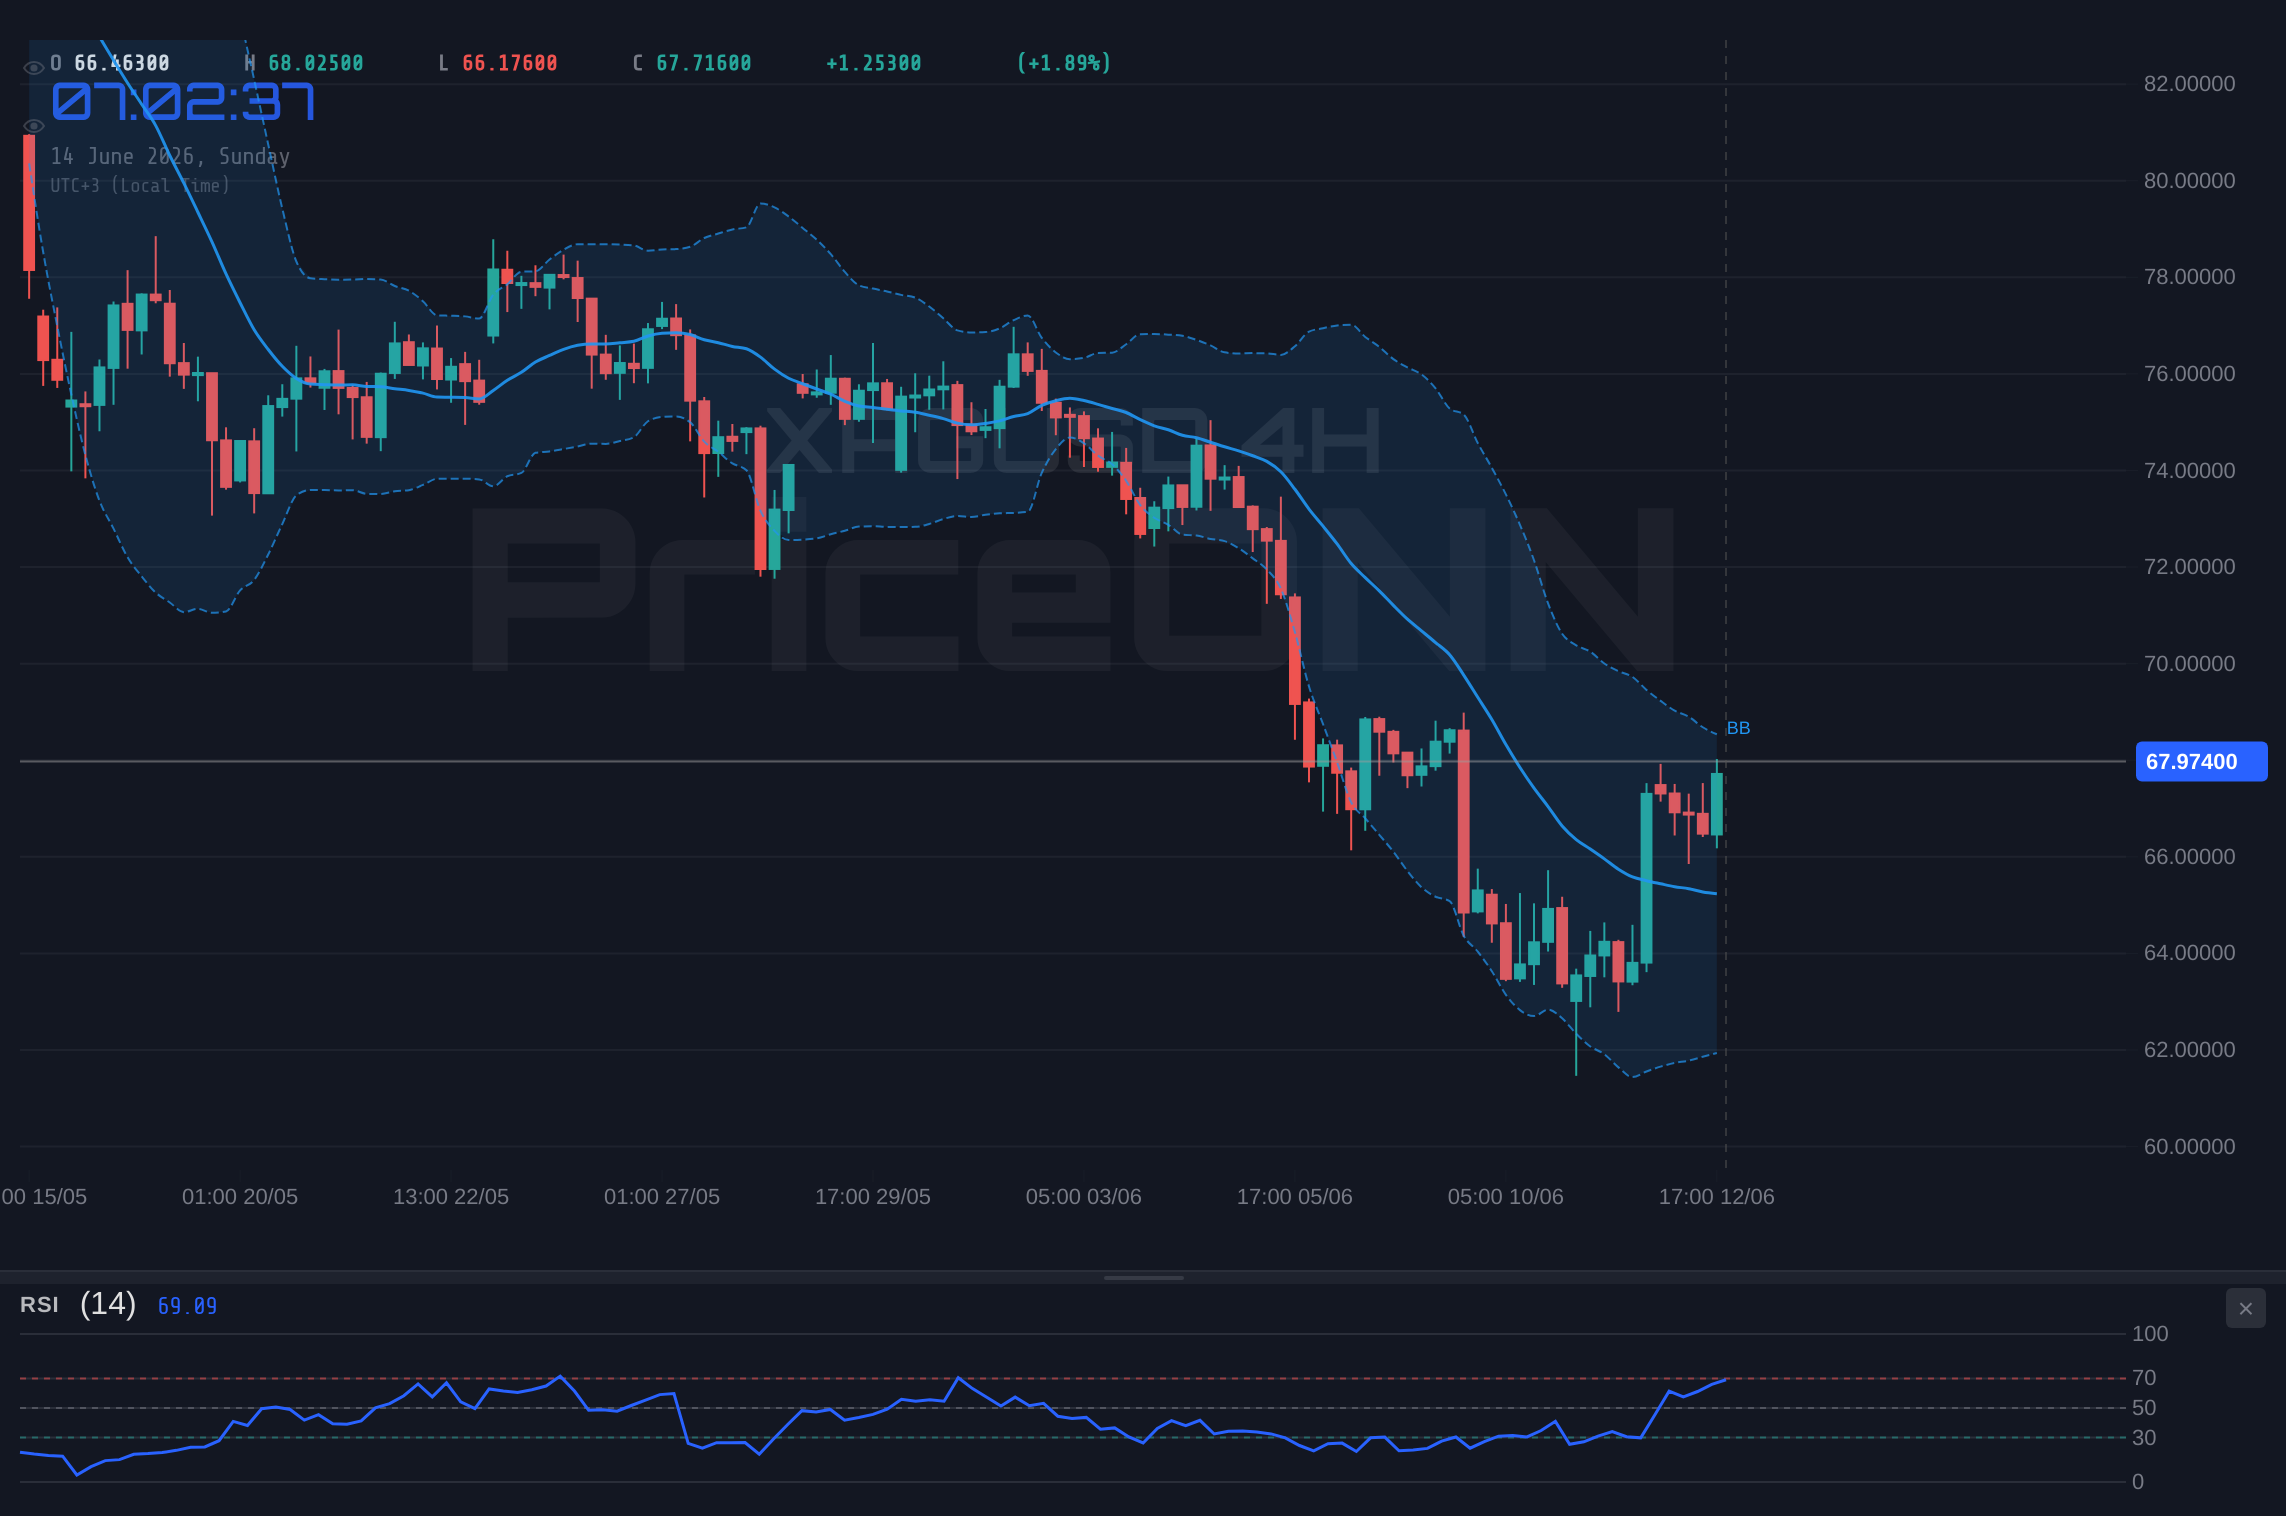
Stepping back to the 4-hour chart reveals a more pronounced trend, albeit still within a neutral overall framework (50% strength). Here, the support structure is more robust, with key levels at $66.09, $65.69, and $64.97. Resistance is noted at $67.20 and $67.92. The RSI(14) at 56.07 continues to suggest upward momentum, and the MACD is firmly in positive territory, with the MACD line above its signal line, indicating stronger bullish momentum than observed on the hourly chart. Bollinger Bands are also above the middle band, reinforcing the upward bias. Stochastic indicators are particularly noteworthy here, showing K=85.66 and D=71.22, firmly in overbought territory and signaling a potential for a pullback or consolidation. The ADX at 32.46 suggests a strong trend, which, when paired with the overbought Stochastic, presents a dichotomy: the trend is strong, but the current momentum might be overextended. The 4H chart's general signal is 'BUY' (5 buys, 3 sells, 0 neutral), but the overbought conditions are a significant caveat.
The daily timeframe paints a starkly different, predominantly bearish picture, which is crucial for understanding the longer-term context. The trend is clearly defined as 'Downtrend' with 100% strength. Support levels are significantly lower, with the first major floor at $62.54, followed by $61.70 and $60.10. Resistance is encountered at $64.97, $66.57, and $67.41. The RSI(14) at 40.73 is in neutral territory but shows a downward eğilim, indicating that sellers still have the upper hand. MACD is also in negative territory, with the MACD line below its signal line, confirming bearish momentum on the daily scale. The price is trading below the middle Bollinger Band, aligning with the downtrend. Stochastic indicators are deeply oversold, with K=16.75 and D=16.2, suggesting that while the price has fallen sharply, a bounce is technically plausible, but it doesn't negate the prevailing bearish trend. The ADX at 24.55 indicates a moderately strong downtrend. The overall signal for the daily timeframe is a strong 'SELL' (0 buys, 8 sells, 0 neutral), highlighting that despite any intraday or medium-term bounces, the dominant trend remains downward.
This multi-timeframe analysis reveals a market in flux. Shorter timeframes (1H and 4H) show signs of potential recovery or consolidation, with bullish signals from RSI and Stochastic, particularly on the 4H where the ADX confirms a strong trend. However, these are counteracted by negative MACD momentum on the 1H and the deeply overbought Stochastic on the 4H, suggesting that any upward moves might be met with profit-taking. The daily chart, however, presents an unyielding bearish trend. This divergence is typical of markets consolidating after a significant move or awaiting clearer fundamental catalysts. For traders, this means a cautious approach is warranted. Betting on a strong bullish reversal requires overcoming the daily downtrend structure and significant resistance levels, while shorting at current levels carries the risk of catching a falling knife, given the oversold conditions on longer daily Stochastic readings. The $67.98 closing price sits uncomfortably between the immediate 4H resistance and the broader daily trend, making it a pivotal point for sentiment.
Intermarket Dynamics: Gold, DXY, and the Inflation Narrative
The price action in silver cannot be viewed in isolation. Its relationship with gold (XAUUSD) is historically strong, and this past week was no exception, although with nuances. Gold itself experienced a significant upswing, closing the week at $4216.64, a remarkable 3.57% increase. This divergence in weekly performance, with gold surging and silver declining, is unusual and warrants attention. Typically, gold's strength would lift silver, but the data shows silver underperforming significantly. This could be attributed to specific market dynamics within the silver market, such as large speculative positions being unwound, or perhaps silver's dual role as both a precious metal and an industrial commodity. The industrial demand component for silver might be more sensitive to global growth concerns or specific supply chain issues that are currently weighing on its price, even as gold benefits from its safe-haven appeal amid broader market uncertainty and inflation hedging.
The US Dollar Index (DXY) also played a critical role. After showing weakness earlier in the week, influenced by geopolitical de-escalation hopes and potential shifts in central bank policy, the DXY found some footing. For XAGUSD, a rising DXY typically spells trouble, as it increases the cost of dollar-denominated silver for buyers using other currencies. Conversely, a falling DXY can provide a tailwind. This week, the DXY's daily trend remains strongly bullish, with its price at 99.78, hovering near key resistance. The 4H chart shows a bullish trend with ADX at 16.02, indicating a developing trend. The 1D chart confirms this bullish inclination with an ADX of 25.61, signalling a strong upward trend, and RSI at 64.37, indicating upward momentum. Despite some intraday dips, the dollar's underlying strength suggests it could continue to act as a headwind for silver, especially if geopolitical tensions fully dissipate and focus shifts back to interest rate differentials and economic growth prospects favouring the US.
Furthermore, the energy complex, particularly Brent crude oil, provided context for inflation expectations. Brent crude saw a dramatic fall this week, closing around $88.54, down 8.63%. This sharp decline was largely attributed to optimism surrounding the Strait of Hormuz and potential US-Iran diplomatic progress, easing fears of major supply disruptions. Lower oil prices generally translate to lower inflation expectations, which can reduce the appeal of commodities as an inflation hedge. This directly impacts silver, which often moves in tandem with oil when inflation is a primary market driver. The significant drop in oil prices this week likely contributed to the selling pressure on silver, as the narrative shifted away from imminent inflationary spikes towards potentially more stable energy markets. This interplay between geopolitical events, energy prices, and inflation expectations creates a complex environment for silver investors to navigate.
Geopolitical Ripples and Their Impact on Silver
The geopolitical landscape has been a dominant theme driving market sentiment, and its influence on silver has been palpable. The easing of tensions in the Middle East, particularly the perceived progress in US-Iran relations, was a major catalyst for price movements across various asset classes. The reduction in geopolitical risk premium typically benefits riskier assets and can lead to a decrease in demand for safe-haven assets like gold and, to some extent, silver. This narrative played out significantly this week, contributing to the sharp decline in oil prices and, consequently, impacting inflation expectations. As fears of a major supply shock in the energy markets receded, the urgency for holding inflation hedges diminished, putting pressure on silver.
The implications of these geopolitical shifts extend to central bank policy. With inflation fears potentially subsiding due to lower energy prices and a less fraught geopolitical environment, markets are recalibrating their expectations for future monetary policy. Discussions around potential pauses or even rate cuts by major central banks, such as the Federal Reserve and the European Central Bank (ECB), gained traction. While the ECB did hike rates as expected, the market’s focus is shifting towards future actions. This potential shift in monetary policy - moving away from aggressive tightening - can have mixed effects. On one hand, it might signal a more stable economic outlook, potentially boosting industrial demand for silver. On the other hand, if the pause is driven by concerns over economic slowdown, it could dampen industrial demand. The market's reaction to these policy signals will be crucial for silver's trajectory. The current data shows a general trend towards potentially less hawkish stances, which could offer some support to commodities if economic growth fears are allayed.
Looking at specific news from the past 48 hours, we see these themes playing out. Reports indicated that oil prices extended their sharp decline due to optimism surrounding Hormuz, with some analysts suggesting EUR/CAD might be poised for a rally – a classic 'risk-on' indicator. The US Dollar Index (DXY) saw bulls fleeing as de-escalation rumours circulated, although the dollar later found some footing. News about India potentially missing its budget deficit target due to the oil shock highlights the interconnectedness of energy prices and fiscal health. These developments underscore the sensitivity of commodity markets, including silver, to geopolitical events and their subsequent impact on inflation and economic growth expectations. The market is clearly digesting a complex mix of signals, making clear directional bets challenging without further confirmation.
Weekly Review and Forward-Looking Perspective
Reflecting on the past week, silver's journey was one of significant volatility, culminating in a 7.26% weekly drop to close at $67.98. This price action occurred against a backdrop of falling oil prices, easing geopolitical tensions in the Middle East, and shifting central bank policy expectations. The initial optimism around de-escalation led to a broad-based decline in commodities as inflation hedges, putting considerable pressure on XAGUSD. While gold managed to rally, silver underperformed, suggesting specific market dynamics or a greater sensitivity to industrial demand outlooks. The DXY's movements added another layer of complexity, with its underlying bullish trend potentially capping any significant upside for silver.
Technically, the picture remains mixed. Shorter timeframes show signs of consolidation and potential bounces, supported by RSI and Stochastic signals, but are hampered by negative MACD momentum and weak overall trend strength (ADX). The daily timeframe, however, firmly remains in a downtrend, with key support levels significantly below the current price. The oversold conditions on the daily Stochastic offer a glimmer of hope for a potential short-term bounce, but the dominant bearish trend structure remains the primary concern. For traders, this environment calls for extreme caution. The $67.98 level is a critical pivot; breaking decisively below it would confirm the bearish daily trend and open the door to lower levels, while holding and bouncing from here would require overcoming significant daily resistance and a shift in the broader macro narrative.
Looking ahead to the next week, several factors will be key. The economic calendar is relatively light, dominated by central bank decisions, which will be closely watched for any clues about future monetary policy. Any further signs of inflation easing or economic slowdown could reinforce the narrative of central bank pauses, potentially offering some support to risk assets and commodities. However, the lingering strength of the DXY and the clear daily downtrend in XAGUSD suggest that any rallies might be met with selling pressure. Key levels to watch will be the immediate resistance around $67.41 and $68.18 on the upside, and the critical support at $61.70 on the downside. A close below $61.70 would signal a continuation of the bearish trend, while a sustained move above $67.41, particularly on increased volume and positive macro news, could signal a potential shift.
Bearish Scenario: Trend Continuation
65% ProbabilityNeutral Scenario: Consolidation and Choppy Action
25% ProbabilityBullish Scenario: Reversal Attempt
10% ProbabilityFrequently Asked Questions: XAGUSD Analysis
What happens if XAGUSD breaks below the $61.70 support level?
A decisive break below $61.70 would invalidate the neutral scenario and confirm the bearish daily trend, potentially targeting $60.10 and then $58.00 as sellers regain control.
Should traders consider buying XAGUSD at current levels of $67.98 given the oversold Stochastic on the daily chart?
While daily Stochastic is oversold, the dominant daily downtrend and resistance at $67.41 suggest caution. A buy signal would require confirmation above $67.41 with strong volume, targeting $69.38.
Is the RSI at 40.73 a sell signal for XAGUSD on the daily timeframe?
An RSI of 40.73 indicates bearish momentum but is not yet in oversold territory. Combined with negative MACD and price below the daily middle Bollinger Band, it supports the prevailing downtrend.
How might the easing geopolitical tensions in the Middle East affect XAGUSD this week?
Reduced geopolitical risk typically dampens safe-haven demand for silver. This, coupled with lower oil prices, suggests potential headwinds for XAGUSD unless new catalysts emerge to shift market sentiment.
Track markets in real-time
AI-powered analysis, technical indicators and real-time price data.
Join Our Telegram Channel
Breaking market news, AI analysis and trading signals instantly.
Join Channel