Nasdaq100 today analysis shows a powerful surge, pushing the index to $30,484.70. This rally, fueled by a surprising U.S.-Iran interim agreement, has injected significant risk-on appetite into the markets. Investors are now closely watching if this upward momentum can break through crucial resistance levels, or if the gains will falter. Having tracked Nasdaq100 through periods of intense volatility, this current setup presents a compelling narrative of shifting market sentiment and the critical junctures that define major trend changes.
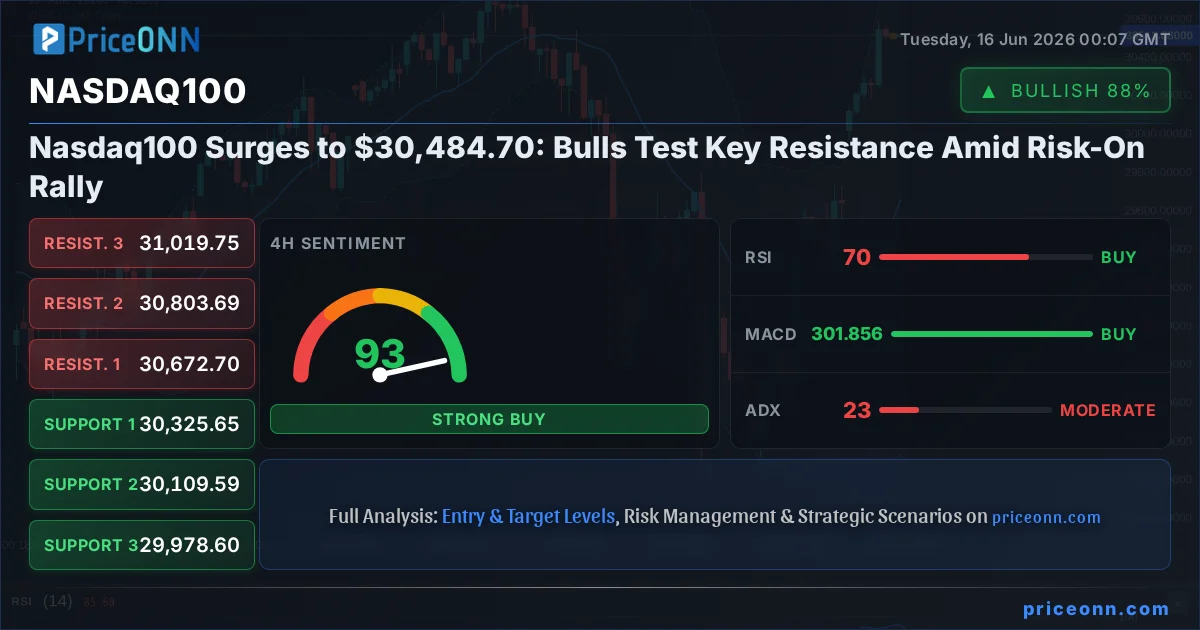
- Nasdaq100 is trading at $30,484.70, up 2.84% on the day, driven by a risk-on sentiment.
- The 1H RSI is at 71.02, indicating overbought conditions that could lead to short-term selling pressure.
- Key resistance is identified at $30,541.61, with a break above this level potentially targeting $30,597.85.
- The U.S.-Iran interim agreement announced on June 15th is a significant geopolitical catalyst, boosting risk appetite.
The market's reaction to the U.S.-Iran interim agreement, as reported by various sources including Forex news, has been swift and decisive. This development has seemingly eased geopolitical tensions in a key region, directly translating into a palpable 'risk-on' sentiment across global financial markets. The Nasdaq100, a bellwether for tech-heavy growth stocks and a sensitive barometer of investor confidence, has been a primary beneficiary. Its sharp ascent to $30,484.70 is not merely a technical move but a reflection of a broader shift in how investors are pricing risk. This narrative is crucial for understanding the underlying drivers beyond simple chart patterns, emphasizing how geopolitical catalysts can override conventional technical signals, at least in the short term. The impact of such news can be profound, often leading to rapid liquidity shifts and momentum acceleration.
On the 1-hour chart, the Nasdaq100's upward trajectory is undeniable, with the index showing a strong bullish trend and a general signal to BUY, according to our data. The current price of $30,484.70 is pushing towards the immediate resistance at $30,541.61. However, the RSI(14) reading of 71.02 signals that the market is entering overbought territory. This doesn't necessarily mean an immediate reversal, but it does suggest that the pace of the rally might be unsustainable without consolidation or a pullback. The MACD, while showing negative momentum on this timeframe, has the price above the middle Bollinger band, indicating upward pressure. The Stochastic oscillator, with K at 68.95 and D at 83.15, is showing a bearish signal as K dips below D, further hinting at potential exhaustion. The ADX at 45.04, however, confirms a strong upward trend is in play, suggesting that any pullbacks might be short-lived. This confluence of indicators paints a picture of a strong uptrend facing potential short-term headwinds.
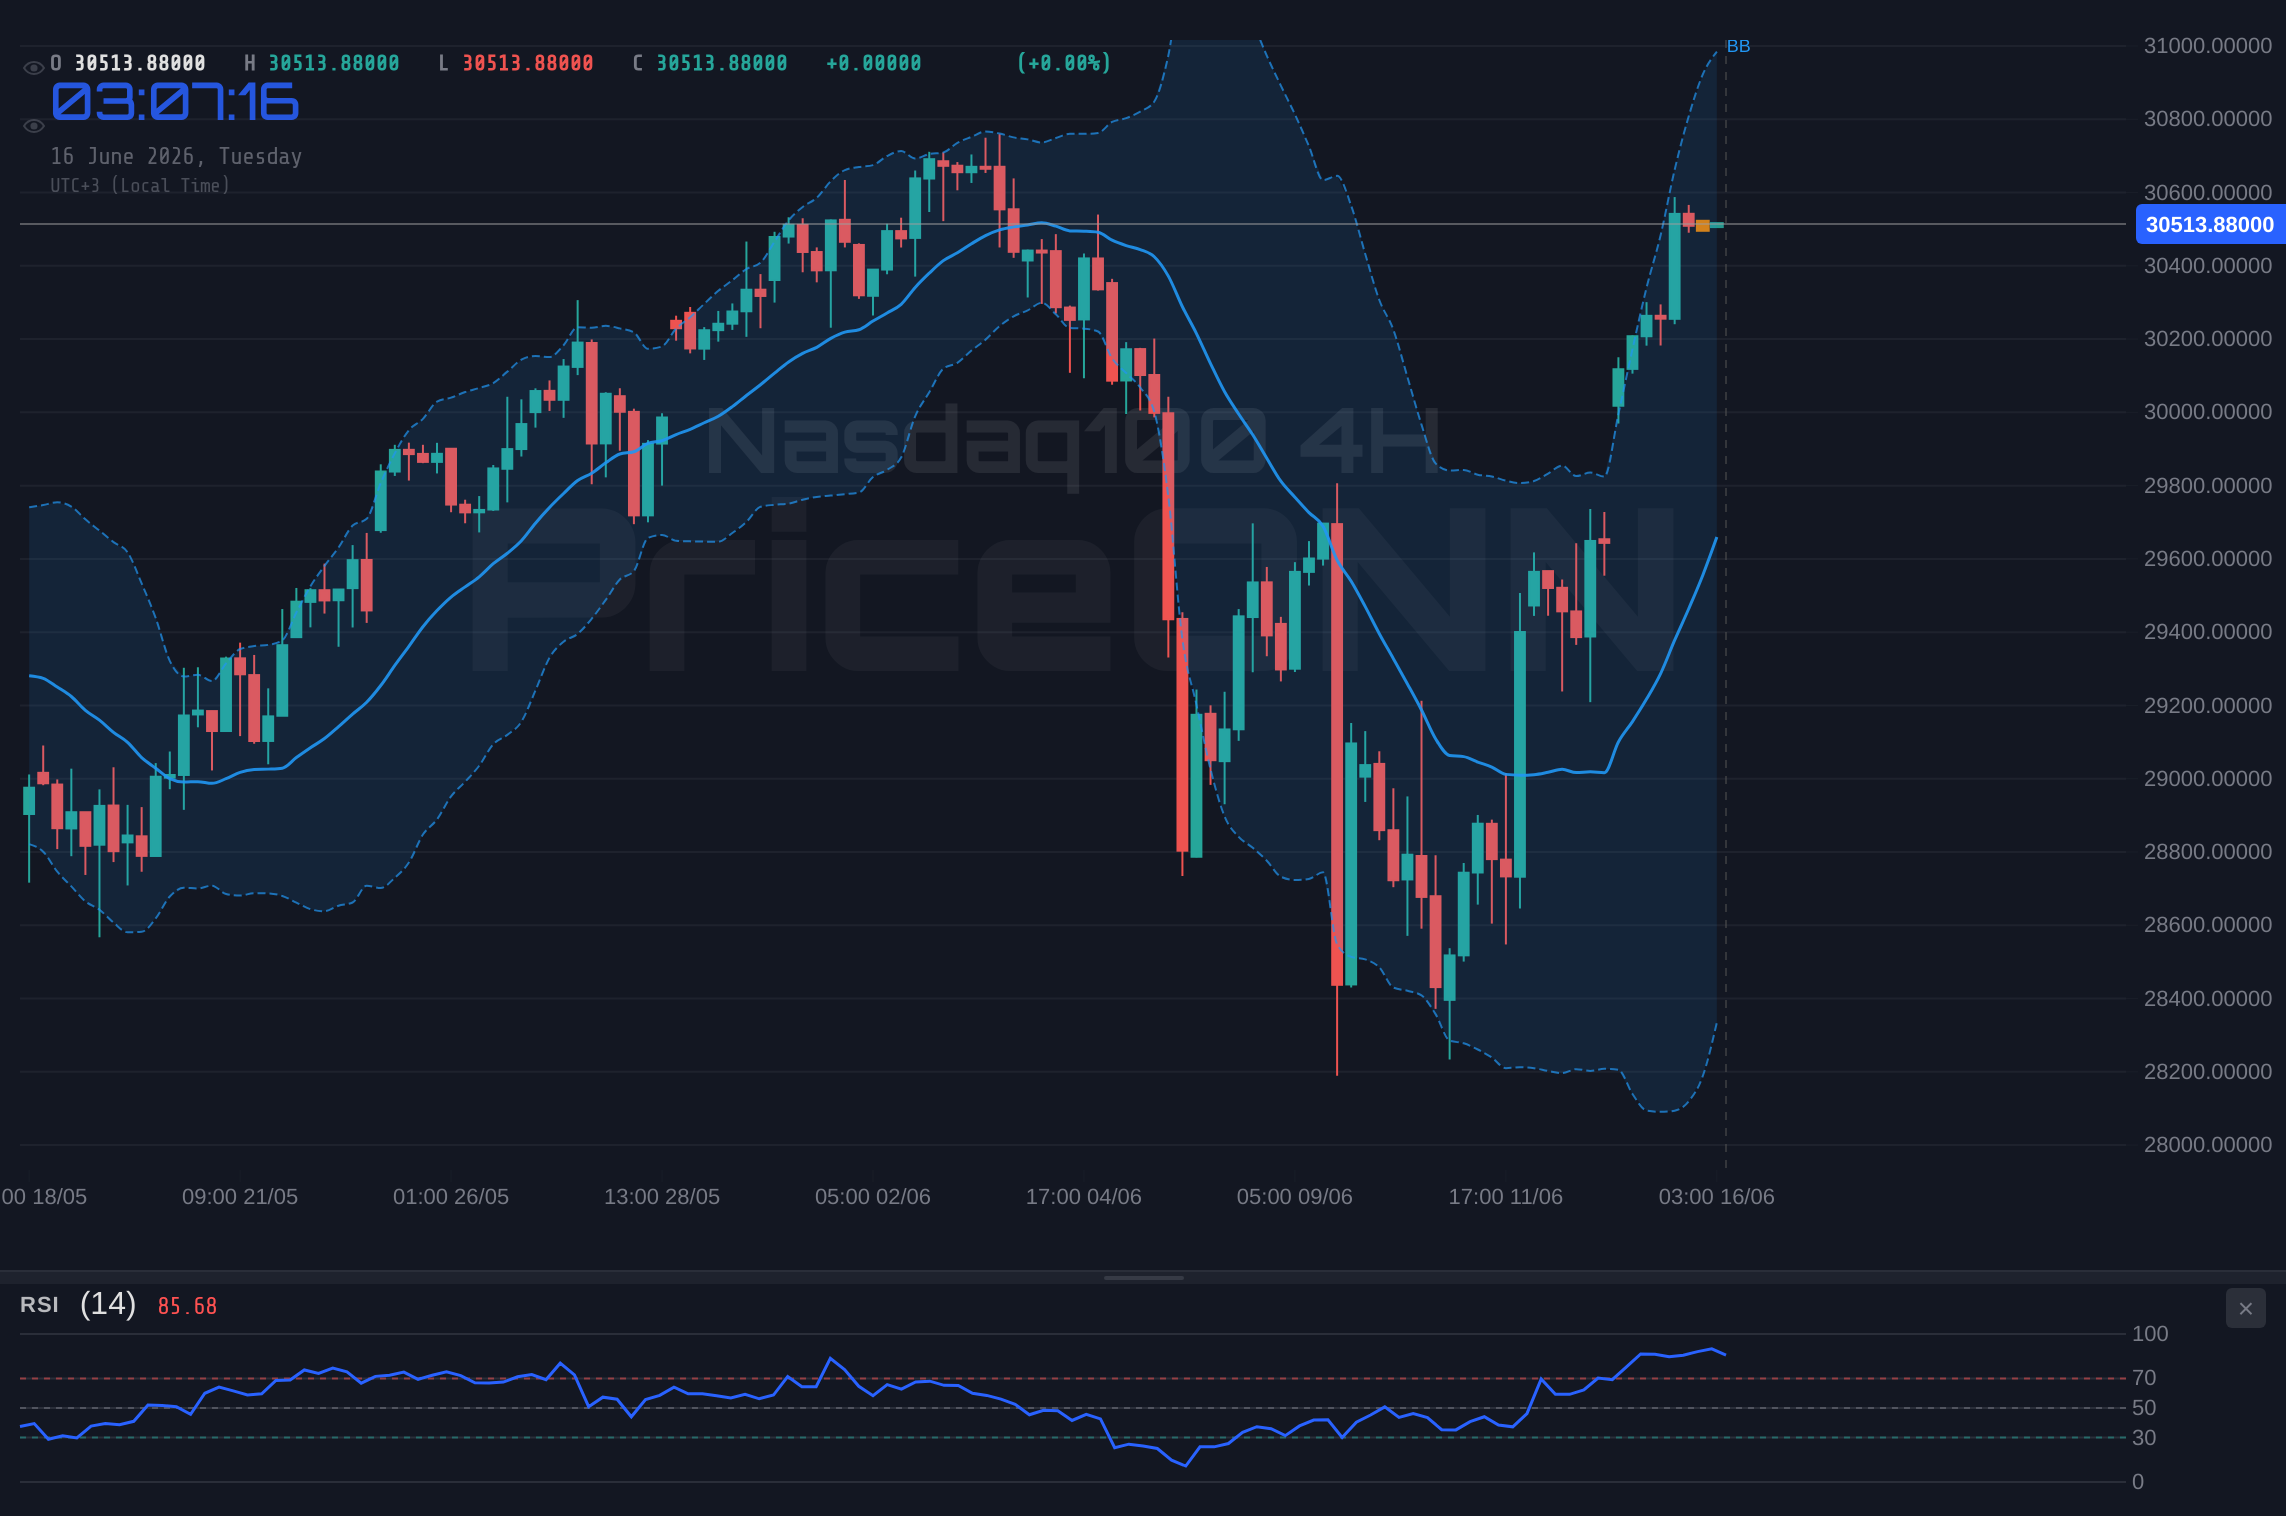
Shifting to the 4-hour timeframe, the picture for the Nasdaq100 becomes even more bullish, though signs of overheating are present. The overall trend is classified as neutral with 50% strength, but the general signal is a strong BUY. The current price of $30,484.70 is well above the middle Bollinger band, reinforcing the bullish inclination. The RSI at 68.69 remains in overbought territory, but this has been a common feature during strong uptrends. The Stochastic K line at 95.02 and D line at 96.32 are screaming 'overbought,' indicating a potential for a sharp correction if momentum falters. Despite these warnings, the MACD is firmly positive, crossing above its signal line, and the ADX at 24.23 still points to a moderately strong trend. This timeframe suggests that while caution is warranted due to extreme overbought readings on the Stochastic, the underlying trend still favors buyers, especially if the geopolitical catalyst continues to drive risk appetite.
The daily chart presents a more complex and perhaps concerning outlook for the Nasdaq100. While the 1-hour and 4-hour charts exhibit strong bullish momentum, the daily trend is categorized as 'Yükseliş' (Uplifting) but with a 'Düşüş' (Downfall) power classification of 100% according to the data. This seems contradictory but indicates that the longer-term trend might be bearish, despite recent price action. The general signal for the daily timeframe is SAT (SELL). The RSI at 45.35 is in neutral territory, leaning towards caution, and showing a downward eğilim. The MACD is negative and below its signal line, a bearish indicator. Bollinger bands show the price below the middle band, suggesting a bearish lean. However, the Stochastic shows a bullish signal with K (42.97) above D (29.88). The ADX at 47.51 confirms a strong downtrend. This divergence between the short-term bullish surge and the longer-term bearish technicals is where the real tension lies. It suggests that the current rally might be a significant bear market rally or a temporary reprieve before a more substantial decline.
The interplay between the U.S. Dollar Index (DXY) and major indices like the Nasdaq100 is a critical factor to consider. Currently, the DXY is trading at 99.69, showing a slight daily decline but with a neutral trend and a strong bullish signal on the 1D timeframe. Historically, a strengthening DXY tends to put pressure on risk assets like the Nasdaq100, as it makes dollar-denominated assets more expensive for foreign investors and can signal tighter global liquidity. However, the recent risk-on sentiment, fueled by the U.S.-Iran deal announcement, seems to be temporarily decoupling these assets. While the DXY's 4H chart shows negative momentum, its 1D chart is bullish. This suggests that the dollar might find renewed strength, potentially capping the Nasdaq100's upside if the geopolitical reprieve proves short-lived or if other macro factors, like upcoming central bank policy, come into focus. The correlation analysis here is key: a rising dollar often acts as a headwind for equities, but market sentiment can override this relationship.
Looking at other major indices provides further context. The S&P 500 is also experiencing a strong upward move, trading at 6572.87, up 0.74%. Its 1H chart shows a strong bullish trend, but the RSI at 70.95 is in overbought territory, similar to the Nasdaq100. The daily chart, however, shows a bearish trend with a SELL signal, suggesting that the broader equity market might also be heading for a correction despite the intraday strength. The Dow Jones Industrial Average (DJIA) is at 51669.5, also showing a significant daily gain. Its technical indicators present a mixed picture, with a neutral trend but a strong BUY signal on the daily chart. This general strength across U.S. equities indicates a broad risk-on sentiment, but the conflicting signals across different timeframes and indices highlight the precariousness of the current rally. The Nasdaq100's tech-heavy nature makes it particularly sensitive to interest rate expectations and broader economic growth narratives.
The energy markets, particularly Brent crude oil trading at $84.54 and WTI at $81.58, are also reflecting the geopolitical shifts. Both benchmarks have seen sharp declines today, with Brent down 4.51% and WTI down 3.75%. This drop is directly linked to the U.S.-Iran deal announcement, which is expected to ease supply concerns and potentially lead to increased oil production or transit through the Strait of Hormuz. The fact that an LNG tanker has already cleared Hormuz further validates this sentiment. Lower oil prices can have a dual effect: they can reduce inflationary pressures, potentially easing the need for aggressive central bank tightening, which is generally good for growth stocks like those in the Nasdaq100. However, a sharp drop in oil prices can also signal slowing global demand, which would be a negative for the broader economy and could eventually weigh on equity markets. The current interpretation leans towards reduced inflation concerns, which could be a net positive for tech stocks.
The European economic front adds another layer to the global picture. The Eurozone recorded a deficit of EUR 1.0 billion in goods trade in April, a notable deterioration from previous periods. This weak trade balance, coupled with the anticipation of the Bank of Japan's policy meeting on June 16th, adds a layer of complexity. While the Nasdaq100's immediate drivers are geopolitical and U.S.-centric, global economic health and central bank actions are never far from traders' minds. A potential shift in BoJ policy, or continued weakness in European economic data, could influence global risk sentiment and, by extension, the Nasdaq100. The EUR/USD pair, currently trading around 1.15919, shows a bearish trend on the daily chart despite short-term fluctuations, reflecting underlying weakness in the Eurozone economy. This contrast between U.S. market optimism and European economic headwinds underscores the divergence in global economic performance.
The narrative for the Nasdaq100 heading into the new week is one of cautious optimism, heavily influenced by the geopolitical détente. The immediate push to $30,484.70 is strong, but the conflicting signals across different timeframes, particularly the overbought RSI on shorter timeframes and the bearish daily indicators, suggest that the rally might face headwinds. The key question is whether the 'risk-on' sentiment can sustain itself in the face of potential profit-taking and longer-term technical weaknesses. The $30,541.61 resistance level is the immediate hurdle. A decisive break above this, supported by strong volume and continued positive news flow, could see the index target $30,597.85 and beyond. Conversely, failure to break this level, coupled with a rise in the DXY or negative economic surprises, could lead to a retracement, testing the support levels around $30,432.28 and $30,379.19.
The Bull's Roadmap: Chasing Higher Ground
For the bulls to maintain control and extend this impressive rally, several conditions must be met. The immediate trigger is a decisive close above the 1-hour resistance at $30,541.61. This would signal a continuation of the current momentum and could encourage further buying. If this level is breached convincingly, the next target would be the 4-hour resistance at $30,597.85. Sustaining the price above this level would be crucial, potentially opening the path towards the next significant resistance at $30,650.94 on the 1-hour chart, and even challenging the 4-hour resistance of $30,803.69 in the medium term. The underlying thesis here is that the geopolitical easing continues to dominate market sentiment, overshadowing short-term overbought conditions and longer-term technical warnings. This scenario thrives on sustained positive news flow and a continued decrease in global risk aversion, potentially leading to a broader market uplift that pulls the Nasdaq100 higher.
The invalidation for this bullish scenario would be a close back below the 1-hour support at $30,432.28. A break below this level would suggest that the upward momentum has stalled and that profit-taking is beginning to dominate. If this support fails, the next critical level to watch would be $30,379.19 on the 1-hour chart. A sustained move below $30,322.95 would significantly weaken the bullish case and could signal a deeper correction, aligning with the bearish signals seen on the daily chart. The probability of this bullish scenario playing out in the short term (intraday to this week) is estimated at around 55%, given the strength of the current catalyst and the momentum observed on the 1- and 4-hour charts, despite the daily bearish divergence.
Where Bears Take Control: The Profit-Taking Pivot
The bearish scenario hinges on the Nasdaq100's inability to overcome immediate resistance and the resurgence of longer-term technical weaknesses. The primary trigger for this scenario would be a failure to break above the 1-hour resistance at $30,541.61, followed by a decisive break below the 1-hour support at $30,432.28. This would signal that the buying pressure has dissipated and that sellers are stepping in, likely due to profit-taking after the sharp rally or renewed concerns about overvaluation and potential economic slowdowns. If $30,432.28 gives way, the next target would be the 1-hour support at $30,379.19, and subsequently the $30,322.95 level. A break below $30,322.95 would confirm a short-term reversal and could accelerate the decline towards the 4-hour support levels, potentially revisiting the $30,109.59 mark.
The invalidation for this bearish scenario would be a strong daily close above the 1-hour resistance at $30,541.61, confirming the bulls' ability to push through the immediate hurdle. If the price continues to hold above $30,597.85, the bearish thesis loses significant credibility. The probability of this bearish scenario unfolding in the short to medium term (this week) is estimated at 35%. This probability is elevated due to the conflicting daily technicals, the overbought conditions on shorter timeframes, and the historical tendency for markets to experience pullbacks after sharp, sentiment-driven rallies. The sustainability of the geopolitical catalyst and the broader macroeconomic backdrop will be crucial in determining the likelihood of this scenario.
The Waiting Game: Consolidation Amid Uncertainty
A neutral scenario, where the Nasdaq100 trades within a defined range, is also plausible, especially if conflicting signals prevent a clear directional move. This scenario would likely play out if the geopolitical catalyst provides only a temporary boost, and longer-term concerns about inflation, interest rates, and economic growth begin to reassert themselves. The trigger for this scenario would be the index failing to decisively break above $30,541.61 resistance while also holding above the $30,432.28 support. Price action would likely become choppy, characterized by lower trading volumes and indecision as traders await clearer direction from upcoming economic data or central bank commentary.
The range for this consolidation could be loosely defined between the 1-hour support at $30,379.19 and the 1-hour resistance at $30,541.61. Within this range, the market might chop sideways, testing the boundaries without committing to a sustained move. Invalidation for this neutral scenario would occur if either the upper resistance or lower support levels are decisively broken. If the price breaks above $30,597.85, the bullish scenario gains traction. If it falls below $30,322.95, the bearish scenario becomes more likely. The probability of this neutral, range-bound scenario playing out in the short term is estimated at 10%. This is lower because the current market environment, driven by a significant geopolitical event, tends to favor directional moves rather than prolonged consolidation.
The most likely scenario, in my assessment, is a continuation of the bullish trend in the very short term, followed by a potential pullback or consolidation as the market digests the geopolitical news and awaits further economic data. The strength of the initial rally and the positive sentiment suggest that sellers might struggle to immediately reverse the trend. However, the overbought indicators on shorter timeframes and the bearish divergence on the daily chart cannot be ignored. Therefore, while the immediate path of least resistance appears to be upwards, the probability of a correction or a period of consolidation in the coming days is significant. The key will be how the market reacts to the $30,541.61 resistance level and whether any follow-through buying materializes.
The current technical picture for the Nasdaq100 presents a classic battle between short-term bullish momentum and longer-term bearish divergences. The surge to $30,484.70, driven by geopolitical relief, has created a powerful upward force. However, the RSI at 71.02 (1H) and 68.69 (4H) suggests the rally is stretched, while the daily chart's bearish signals (RSI 45.35, negative MACD, strong ADX 47.51) indicate underlying weakness. The critical resistance at $30,541.61 will be the immediate focus. A break above this level could extend the rally, but failure to do so, coupled with a close below $30,432.28, would likely trigger a significant pullback. The market is at a pivotal point where short-term euphoria clashes with long-term technical realities.
What I'm Watching This Week
This week, the focus will be on several key triggers that could determine the Nasdaq100's next move. Firstly, the ability of the index to hold above the immediate 1-hour support at $30,432.28 will be critical. A failure here could signal the end of the current leg up. Secondly, the price action around the $30,541.61 resistance level is paramount. A decisive breakout above this level, confirmed by strong volume, would validate the bullish scenario. Conversely, rejection at this level, followed by a move lower, would strengthen the bearish case. Thirdly, traders will be closely monitoring any shifts in macroeconomic sentiment, particularly regarding inflation expectations and central bank policy. While the current geopolitical news is positive, any resurgence of inflation fears or hawkish commentary from central banks could quickly dampen the risk-on appetite and pressure growth stocks.
The technical summary paints a picture of conflicting signals, typical of a market at a crossroads. The short-term charts show bullish momentum, but the longer-term daily outlook suggests caution. The ADX readings are particularly noteworthy, indicating strong trends on multiple timeframes, but the directionality is conflicting between the daily (bearish) and shorter-term (bullish) charts. This suggests that while a trend is present, its sustainability and direction are currently in flux.
| Indicator | Value | Signal | Interpretation |
|---|---|---|---|
| RSI (14) | 71.02 | Overbought | Short-term overbought, potential for pullback. |
| MACD Histogram | -353.44 | Negative Momentum | Selling pressure indicated on 1H chart. |
| Stochastic (%K, %D) | 68.95, 83.15 | Bearish Crossover | Bearish signal as K dips below D on 1H. |
| ADX | 45.04 | Strong Trend | Confirms a strong trend, but direction conflicts across timeframes. |
| Bollinger Bands | Middle Band | Watch | Price is above the middle band on 1H, indicating upward pressure. |
Bearish Scenario: Profit-Taking Pivot
35% ProbabilityBullish Scenario: Chasing Higher Ground
55% ProbabilityNeutral Scenario: Waiting Game
10% ProbabilityFrequently Asked Questions: Nasdaq100 Analysis
What happens if Nasdaq100 breaks above the $30,541.61 resistance level?
A decisive break above $30,541.61, confirmed by strong volume, would validate the bullish scenario. This could trigger further buying pressure, targeting $30,597.85 and potentially $30,650.94 in the short term.
Should I buy Nasdaq100 at current levels of $30,484.70 given the RSI at 71.02?
Buying at current levels carries risk due to the overbought RSI (71.02) on the 1-hour chart. A more prudent approach might be to wait for a pullback to support around $30,432.28 or confirmation of a breakout above $30,541.61. Risk management is key.
Is the RSI at 71.02 a sell signal for Nasdaq100 right now?
An RSI of 71.02 on the 1-hour chart indicates overbought conditions, suggesting potential for a short-term pullback or consolidation. It's not an outright sell signal on its own but warrants caution and potentially waiting for confirmation of a bearish reversal or a deeper correction.
How will the U.S.-Iran interim agreement affect Nasdaq100 this week?
The agreement has boosted risk appetite, driving the Nasdaq100's surge to $30,484.70. This positive sentiment could continue, supporting further gains, but its sustainability depends on follow-through developments and any resurgence of inflation or rate hike concerns.
Track markets in real-time
AI-powered analysis, technical indicators and real-time price data.
Join Our Telegram Channel
Breaking market news, AI analysis and trading signals instantly.
Join Channel