

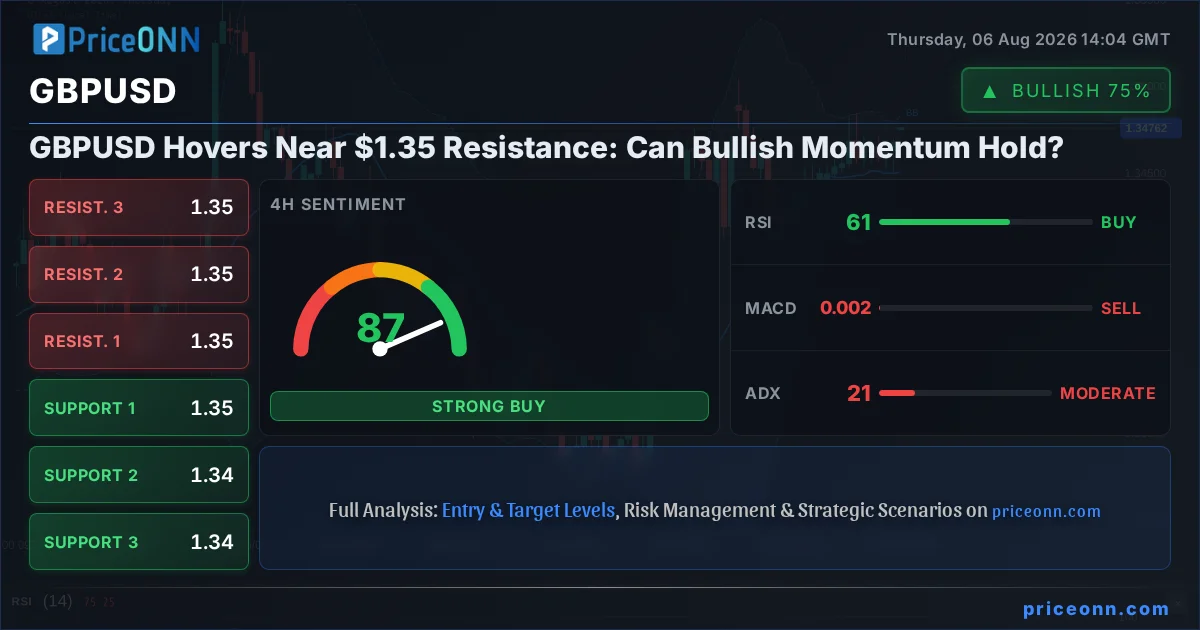
GBPUSD Trades Near $1.35 Resistance: Can Bullish Momentum Hold?
The GBPUSD pair is currently navigating a critical juncture, hovering near the significant resistance level of $1.35. This price point has become a focal area for traders and analysts alike, representing a potential inflection point for the pair's next major move. With the pair showing resilience and maintaining a bullish undertone in several timeframes, the question on everyone's mind is whether the upward momentum can overcome this formidable barrier, or if the bears are poised to reassert control. Understanding the interplay of technical indicators, broader market sentiment, and potential fundamental catalysts is crucial for deciphering the immediate future of GBPUSD.
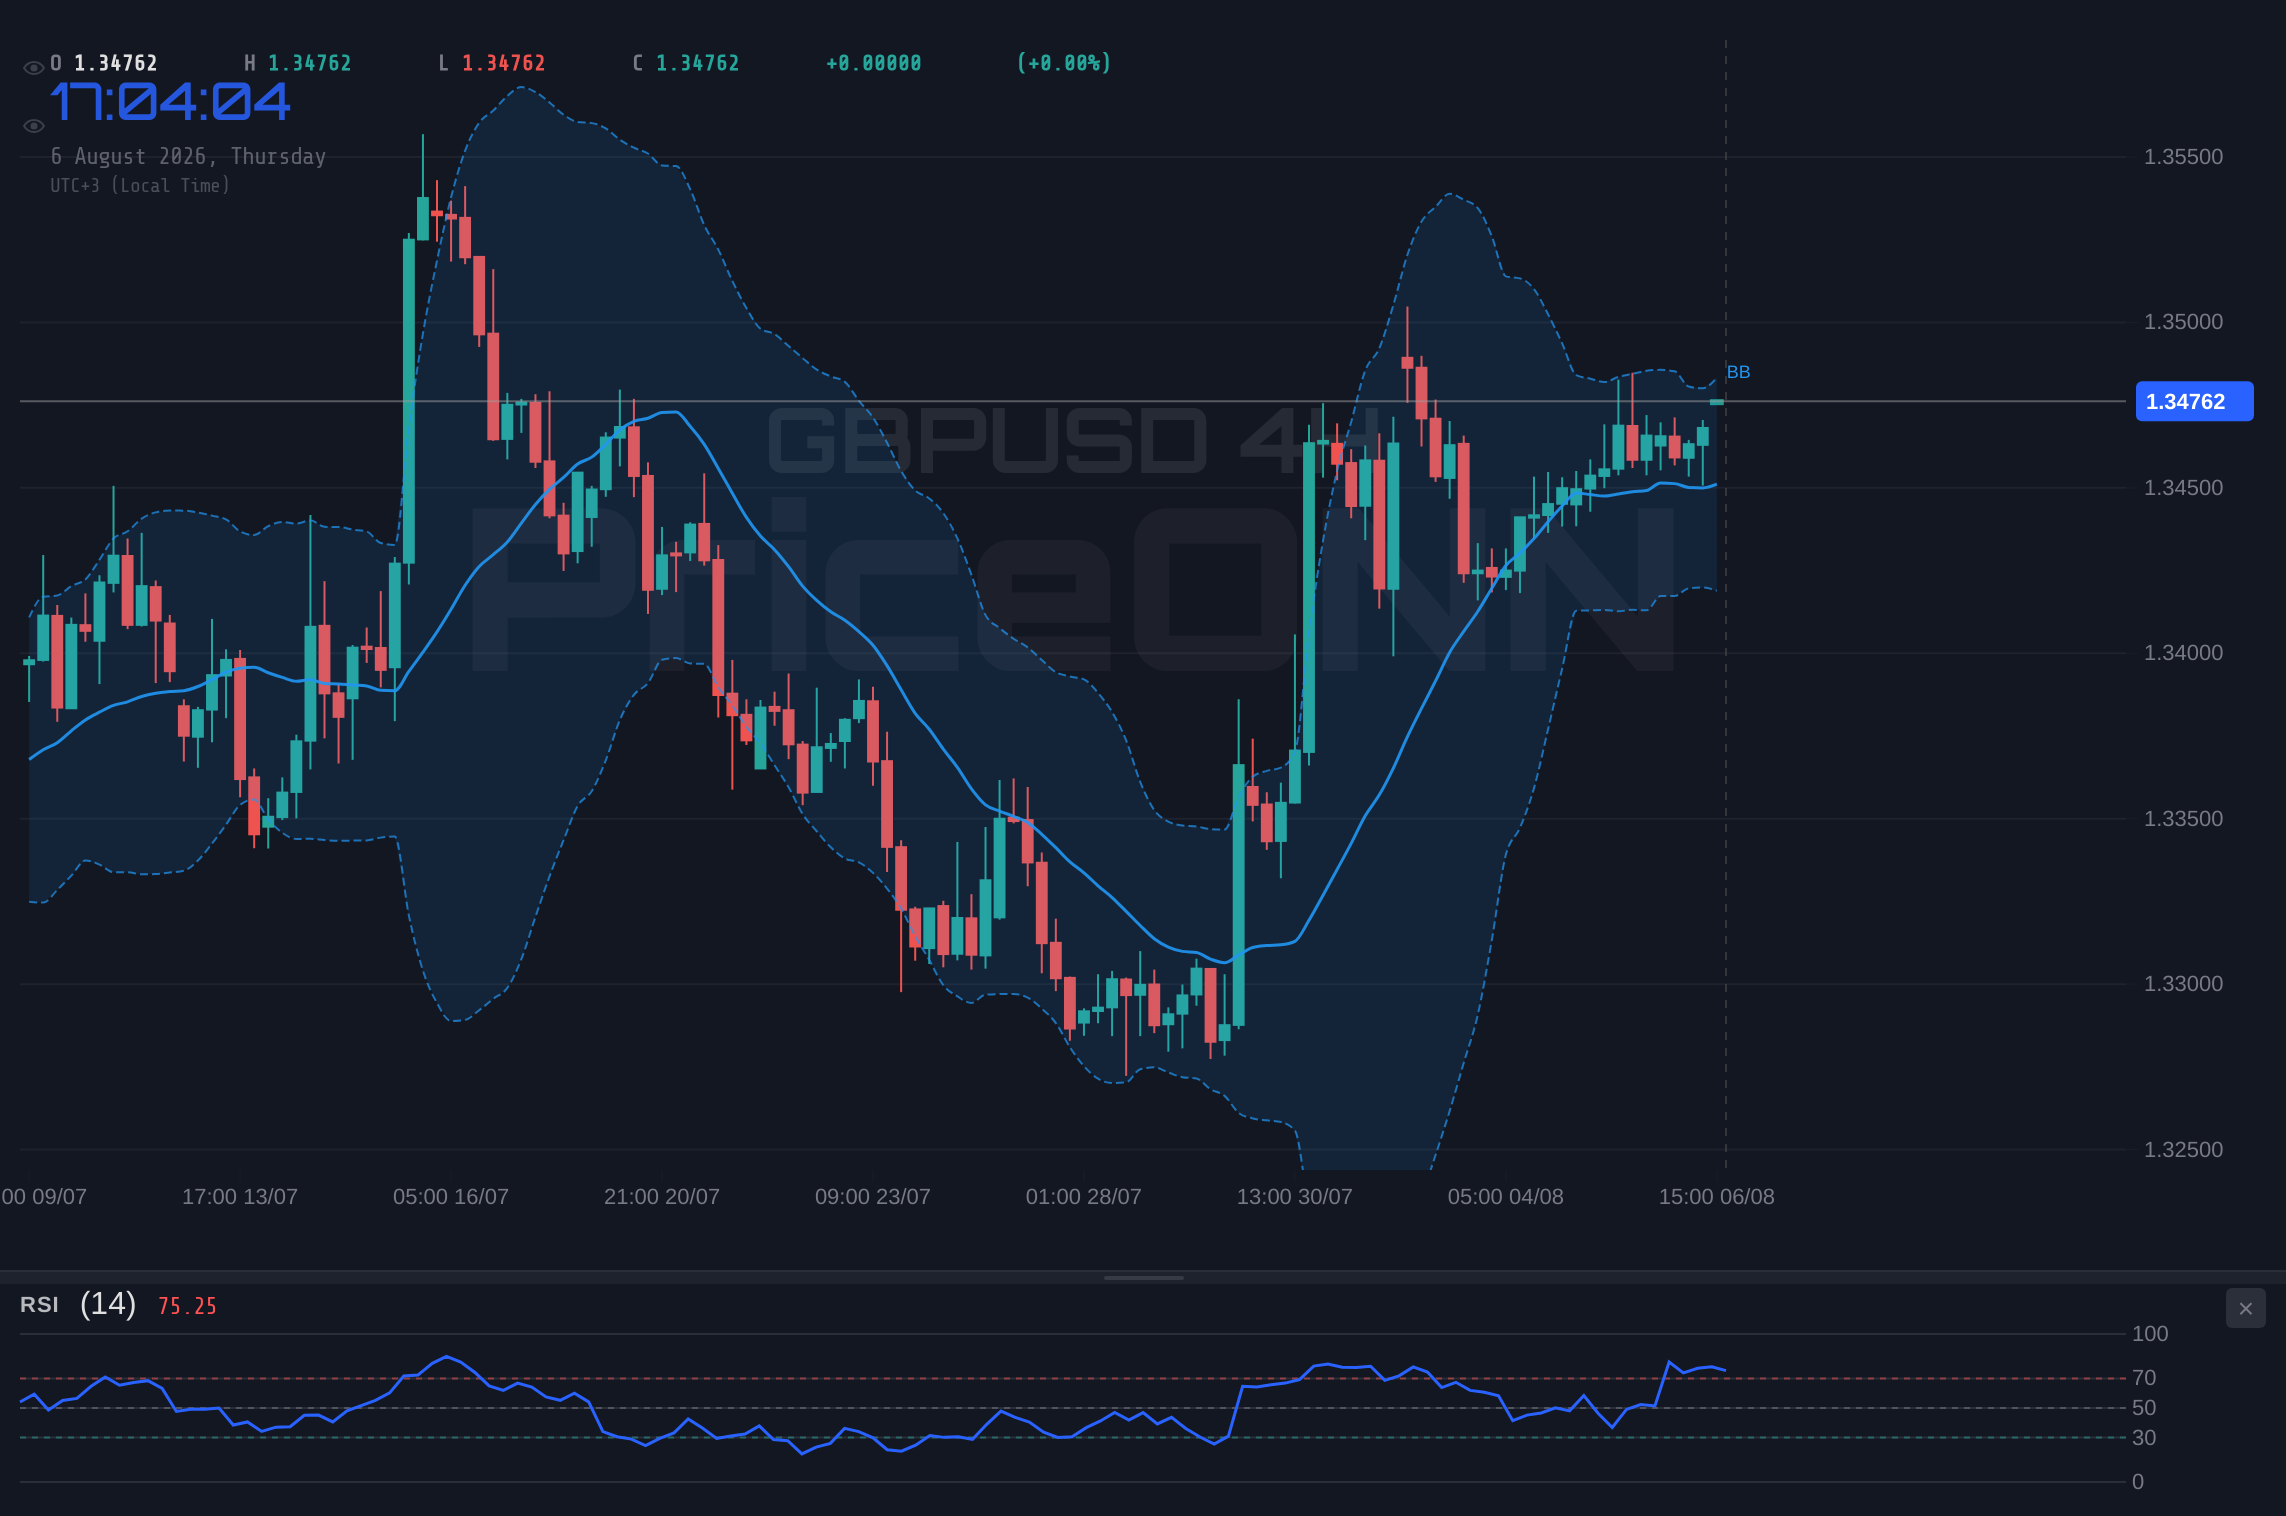
- The RSI at 61.14 on the 4H chart indicates neutral to bullish pressure, but nearing overbought territory on daily charts at 58.3.
- Critical resistance is observed around $1.34876, a level that needs a decisive break for sustained upside.
- The ADX at 20.82 suggests a moderate trend, implying that while a trend exists, it might lack the conviction for a strong breakout without further confirmation.
- The correlation with DXY, currently at 99.77 and showing a mixed 1H signal but a bearish daily trend, adds complexity to the GBPUSD outlook.
The narrative surrounding GBPUSD is complex, shaped by a confluence of factors ranging from central bank policy expectations to broader risk sentiment. On the technical front, the 1-hour chart shows a bullish trend with a Power of 60.86%, an RSI of 61.07, and a Stochastic indicator showing a bullish crossover (K=93.77, D=56.85). This suggests that intraday traders are leaning towards the upside. However, the 4-hour chart paints a slightly more cautious picture, with a bullish trend (Power 90%) but Stochastic indicating a potential pullback (K=52.88, D=60.05). The daily chart reinforces the bullish sentiment with a trend power of 89% and a generally supportive technical setup, yet the RSI at 58.3 suggests room for further ascent before hitting overbought conditions.
This divergence across timeframes highlights the delicate balance in play. While the immediate intraday action favors buyers, the slightly weaker signals on the higher timeframes, coupled with the proximity to resistance, warrant a measured approach. The ADX, a measure of trend strength, sits at 20.82 on the 4H chart, indicating a moderately trending market. This isn't a runaway trend, suggesting that significant price moves might require a catalyst or a clear break of key levels. The fact that the Stochastic indicator is showing a bearish crossover on the 4H chart, despite the overall bullish trend, is a crucial detail. This often precedes a period of consolidation or a minor pullback before the main trend can resume, if it does.
The Bull's Roadmap: Breaking Through $1.35
For the bulls to maintain control and push GBPUSD higher, a decisive move above the immediate resistance is paramount. The key level to watch is the daily resistance at $1.34876. A sustained break and hold above this mark would be the first significant hurdle cleared. Following this, the next target would be the R2 resistance level at $1.35094. If buyers can push through this psychological barrier, the path could open towards the R3 resistance at $1.3534. Such a move would likely be supported by strong volume and positive shifts in short-term technical indicators, potentially seeing the RSI move into overbought territory above 70 and the MACD showing stronger positive momentum.
The broader market context will be crucial for this bullish scenario. A weakening US Dollar Index (DXY), currently showing mixed signals across timeframes but a bearish daily trend, would certainly lend support to GBPUSD. If the DXY falls below its 99.73 support on the 1H chart and continues its descent towards the 99.56 level on the daily, it would alleviate pressure on the pair. Furthermore, a positive risk sentiment, perhaps indicated by a rise in the S&P 500 (currently at 6572.87, showing mixed signals on 1H but a strong daily downtrend) or a stabilization in the Nasdaq (at 29408.5, with mixed signals across timeframes), would further bolster demand for riskier currencies like the British Pound. The key here is confluence: a break of resistance, supported by dollar weakness and a positive risk-on environment, would significantly increase the probability of an upside move.
From a technical perspective, confirmation would come from the shorter-term indicators aligning with the bullish move. The 1-hour Stochastic, currently showing a bullish crossover (K=93.77, D=56.85), would need to sustain its upward trajectory without immediately entering extreme overbought territory. The RSI, currently at 61.07 on the 1H chart, would ideally move higher but remain below the 70-75 zone to avoid signaling an immediate overbought condition that could precede a sharp reversal. On the 4-hour chart, the Stochastic needs to move out of its bearish crossover and align with the overall bullish trend. A sustained close above $1.34876 on the daily chart, coupled with a daily RSI moving towards 60-65 and MACD maintaining positive momentum, would solidify the bullish case for a move towards $1.35094 and potentially higher.
Where Bears Take Control: Testing the Supports
Conversely, if GBPUSD fails to overcome the $1.34876 resistance, the downside risk increases significantly. The immediate support level to watch is $1.34624 on the 1-hour chart, followed by $1.34568. A decisive break below these levels, particularly on increased volume, would signal a shift in momentum. The primary support to monitor closely on the daily chart is $1.34412. A breach of this level would invalidate the near-term bullish outlook and could trigger a cascade of selling, potentially targeting the S2 support at $1.34166 and even the S3 support at $1.33948. This bearish scenario would likely be accompanied by a strengthening US Dollar, with the DXY moving decisively higher, perhaps breaking above its 99.81 resistance level.
The technical indicators would also start flashing red in this bearish scenario. The 4-hour Stochastic, currently in a bearish crossover, would likely continue its descent, reinforcing downside pressure. The RSI, which is currently at 58.3 on the daily chart, would need to fall below 50, indicating a shift towards bearish sentiment. A negative MACD crossover on the higher timeframes, where the MACD line falls below its signal line, would be a strong confirmation of bearish momentum. Furthermore, a weakening trend strength indicated by a falling ADX below 20 would suggest that the market is losing conviction in its direction, but a sharp drop in price could also be preceded by a brief period of consolidation before the breakdown.
Geopolitical events or unexpected economic data releases could also fuel a bearish turn. For instance, any dovish signals from the Bank of England, or surprisingly weak UK economic data, could quickly turn sentiment against the Pound. In contrast, hawkish commentary from the Federal Reserve or strong US economic data, such as an unexpected surge in US employment figures or inflation, could bolster the dollar and drag GBPUSD lower. The recent news regarding the potential closure of the Strait of Hormuz and its impact on energy prices could also contribute to a risk-off environment, further benefiting the dollar as a safe-haven asset and potentially pressuring GBPUSD, especially if it leads to broader market instability.
The Waiting Game: Caught in the $1.35 Range
It's also entirely possible that GBPUSD could enter a period of consolidation, trading within a defined range as market participants await clearer direction. This scenario often occurs when conflicting signals emerge, or when major economic events are on the horizon, leading to a 'wait-and-see' approach. In such a case, the pair might oscillate between the immediate support at $1.34412 and resistance around $1.34876. The ADX reading of 20.82 on the 4-hour chart, indicating a moderate trend, could be interpreted as a sign that the market is not yet committed to a strong directional move, making a range-bound scenario plausible.
During a consolidation phase, technical indicators often provide mixed signals. The RSI might hover around the 50-60 level, showing indecision, while Stochastic crossovers could occur frequently without leading to significant price movements. Volume might also dry up, indicating a lack of strong conviction from market participants. This period of 'choppiness' can be frustrating for traders looking for clear trends, but it also presents opportunities for range traders who can profit from the fluctuations within the established boundaries. The key for this scenario is the lack of a decisive catalyst to push price beyond the immediate support and resistance levels.
The Bank of England's stance on inflation and interest rates, alongside upcoming US employment data, will be critical in determining whether a breakout or a consolidation phase prevails. If both central banks maintain their current policy paths and economic data remains largely in line with expectations, a period of range-bound trading is more likely. However, any significant deviation from expected data, or unexpected hawkish or dovish commentary from either central bank, could shatter this equilibrium and force a directional move. For now, the $1.35 mark remains a significant psychological and technical barrier that requires substantial impetus to overcome or defend.
The Most Likely Scenario and Key Triggers to Watch
Considering the current technical picture and the prevailing market sentiment, a **bullish scenario with a strong emphasis on consolidation before a potential breakout** appears to be the most probable outcome in the short term. The daily trend strength of 89% for GBPUSD is a significant factor, suggesting underlying buying interest. However, the mixed signals across different timeframes, particularly the Stochastic bearish crossover on the 4H chart and the RSI nearing neutral-to-overbought on the daily, indicate that immediate upside might be capped. The ADX at 20.82 reinforces this, suggesting that the trend, while present, lacks the explosive power for an immediate, sustained breakout without further confirmation. Therefore, a period of consolidation between $1.34412 and $1.34876 is a strong possibility, with a potential for a breakout towards $1.35094 if key triggers are met.
The probability estimate leans towards a **60% chance of consolidation with a bullish bias, 30% chance of a bearish breakdown, and 10% chance of a strong bullish breakout in the immediate short term (next 24-48 hours).** This outlook hinges on several key triggers that traders should be watching closely:
1. Daily Close Above $1.34876: This is the most immediate bullish confirmation needed. A solid daily close above this resistance level would signal intent to move higher and could open the door for a test of $1.35094.
2. DXY Breakdown Below 99.73: A sustained move lower in the Dollar Index, particularly breaking its 1-hour support at 99.73, would remove a significant headwind for GBPUSD and could accelerate any bullish move.
3. UK Economic Data Releases: Any upcoming UK data, particularly inflation or employment figures, that come in significantly above expectations could provide the necessary fundamental boost for a bullish breakout. Conversely, weak data could trigger the bearish scenario.
4. US Employment Data Impact: The upcoming ADP employment report and subsequent Non-Farm Payrolls data will be crucial. If these figures are weaker than expected, it could put pressure on the Fed to signal a less hawkish stance, weakening the dollar and supporting GBPUSD. If they are strong, the dollar could strengthen, leading to a bearish scenario for GBPUSD.
The market is at an interesting crossroads for GBPUSD. While the overall trend on higher timeframes remains supportive, the immediate resistance at $1.35 and the mixed signals across indicators suggest caution. Patience will be key, waiting for a clear signal or catalyst to emerge before committing to a strong directional trade. Managing risk remains paramount, especially given the current moderate trend strength and the potential for volatility around key economic events.
Bearish Scenario: The $1.34412 Line in the Sand
30% ProbabilityBullish Scenario: Breaking the $1.35 Barrier
10% ProbabilityNeutral Scenario: Consolidation Around $1.35
60% Probability| Indicator | Value | Signal | Interpretation |
|---|---|---|---|
| RSI (14) | 58.3 | Neutral | Nearing overbought on daily, but still room to run. |
| MACD Histogram | +0.000X | Bullish | Positive momentum, but needs to strengthen for breakout. |
| Stochastic | K:82.44, D:74.98 | Bullish Crossover | Bullish signal on daily, but 4H shows potential pullback. |
| ADX | 20.82 | Moderate Trend | Trend strength is present but not overwhelming; breakout needs confirmation. |
| Bollinger | Mid Band | Above Mid Band | Price above middle band suggests bullish bias on higher timeframes. |
Frequently Asked Questions: GBPUSD Analysis
What happens if GBPUSD breaks above the $1.34876 resistance level?
A sustained daily close above $1.34876 would signal strong bullish momentum, potentially triggering further buying interest. This could lead to a retest of the $1.35094 resistance, with a successful break targeting $1.3534.
Is the current RSI at 58.3 a concern for GBPUSD traders?
An RSI of 58.3 is in the neutral zone, indicating room for upside potential without immediate overbought pressure on the daily chart. However, traders should monitor its ascent towards 70, as this could signal an overheated market requiring caution.
How is the DXY's movement at 99.77 impacting GBPUSD?
The DXY is showing mixed signals on shorter timeframes but a bearish trend on the daily. A continued decline in the DXY below 99.73 would likely provide a tailwind for GBPUSD, alleviating pressure and supporting potential upside moves.
What economic events should traders watch for GBPUSD this week?
Key events include upcoming UK economic data releases (inflation, employment) and US employment figures like the ADP report and NFP. Stronger-than-expected UK data could boost GBPUSD, while weaker US data might weaken the dollar, both potentially supporting an upward move.
Track markets in real-time
AI-powered analysis, technical indicators and real-time price data.
Join Our Telegram Channel
Breaking market news, AI analysis and trading signals instantly.
Join Channel