

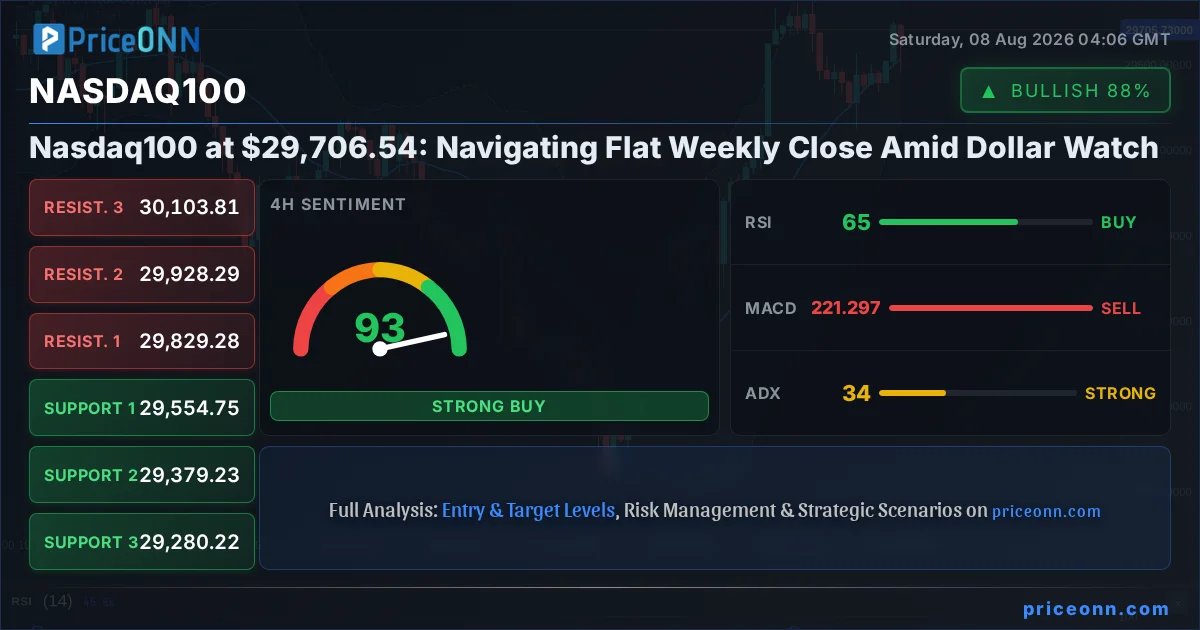
The Nasdaq 100 index concluded the past trading week with a flat close, hovering around the critical $29,706.54 mark. This lack of decisive movement underscores a market caught between cautious optimism and lingering uncertainty, with all eyes now firmly fixed on upcoming economic catalysts, particularly the US jobs report. As traders brace for potential volatility, a deep dive into the technical landscape and correlating market forces is essential for navigating the coming sessions. This period of consolidation, while potentially frustrating, often sets the stage for significant price action once key data points resolve the current ambiguity. Understanding the interplay between the Nasdaq 100's internal dynamics and external macroeconomic drivers, such as the US Dollar Index (DXY), is paramount for developing a robust trading strategy.
- Nasdaq 100 closed flat at $29,706.54, indicating a market in consolidation.
- RSI at 61.69 (1H) and 65.13 (4H) suggests bullish momentum but approaches overbought territory, warranting caution.
- ADX readings across timeframes (18.75 to 21.36) indicate a weak trend, suggesting potential for range-bound trading or a pending breakout.
- The correlation with the DXY (currently 99.58 and falling) is a key factor to monitor for potential shifts in risk appetite.
The past week's trading action for the Nasdaq 100 offered little in the way of a clear directional conviction, culminating in a near-unchanged close at $29,706.54. This indecisiveness is a classic symptom of markets holding their breath ahead of major economic releases. The July Non-Farm Payrolls (NFP) report, due imminently, carries the potential to inject significant volatility and clarity into the broader financial landscape. Traders have been meticulously dissecting every piece of incoming data, from Fed commentary to employment figures, seeking clues about the future path of monetary policy and its subsequent impact on risk assets like the tech-heavy Nasdaq 100. The current price action suggests that while underlying sentiment might lean bullish, the absence of a strong catalyst is preventing a decisive upward move. This equilibrium is delicate, and the upcoming NFP data could easily tip the scales.
Delving into the technical indicators, the 1-hour chart presents a mixed but generally positive picture for the Nasdaq 100. The Relative Strength Index (RSI) at 61.69 hovers in neutral territory but leans towards bullish momentum, indicating that buyers have maintained some control. Similarly, the MACD is showing positive momentum, with the MACD line above its signal line, further supporting the bullish inclination on this shorter timeframe. However, the ADX reading of 21.36 suggests a relatively weak trend, implying that the current upward movement might be part of a broader consolidation rather than the start of a strong new trend. This is further echoed by the Stochastic Oscillator, where K=65.41 and D=64.32, showing a slight upward bias but not yet in extreme overbought territory. The Bollinger Bands are positioned around the middle band, indicating a neutral to slightly bullish stance, with prices finding some footing above it.
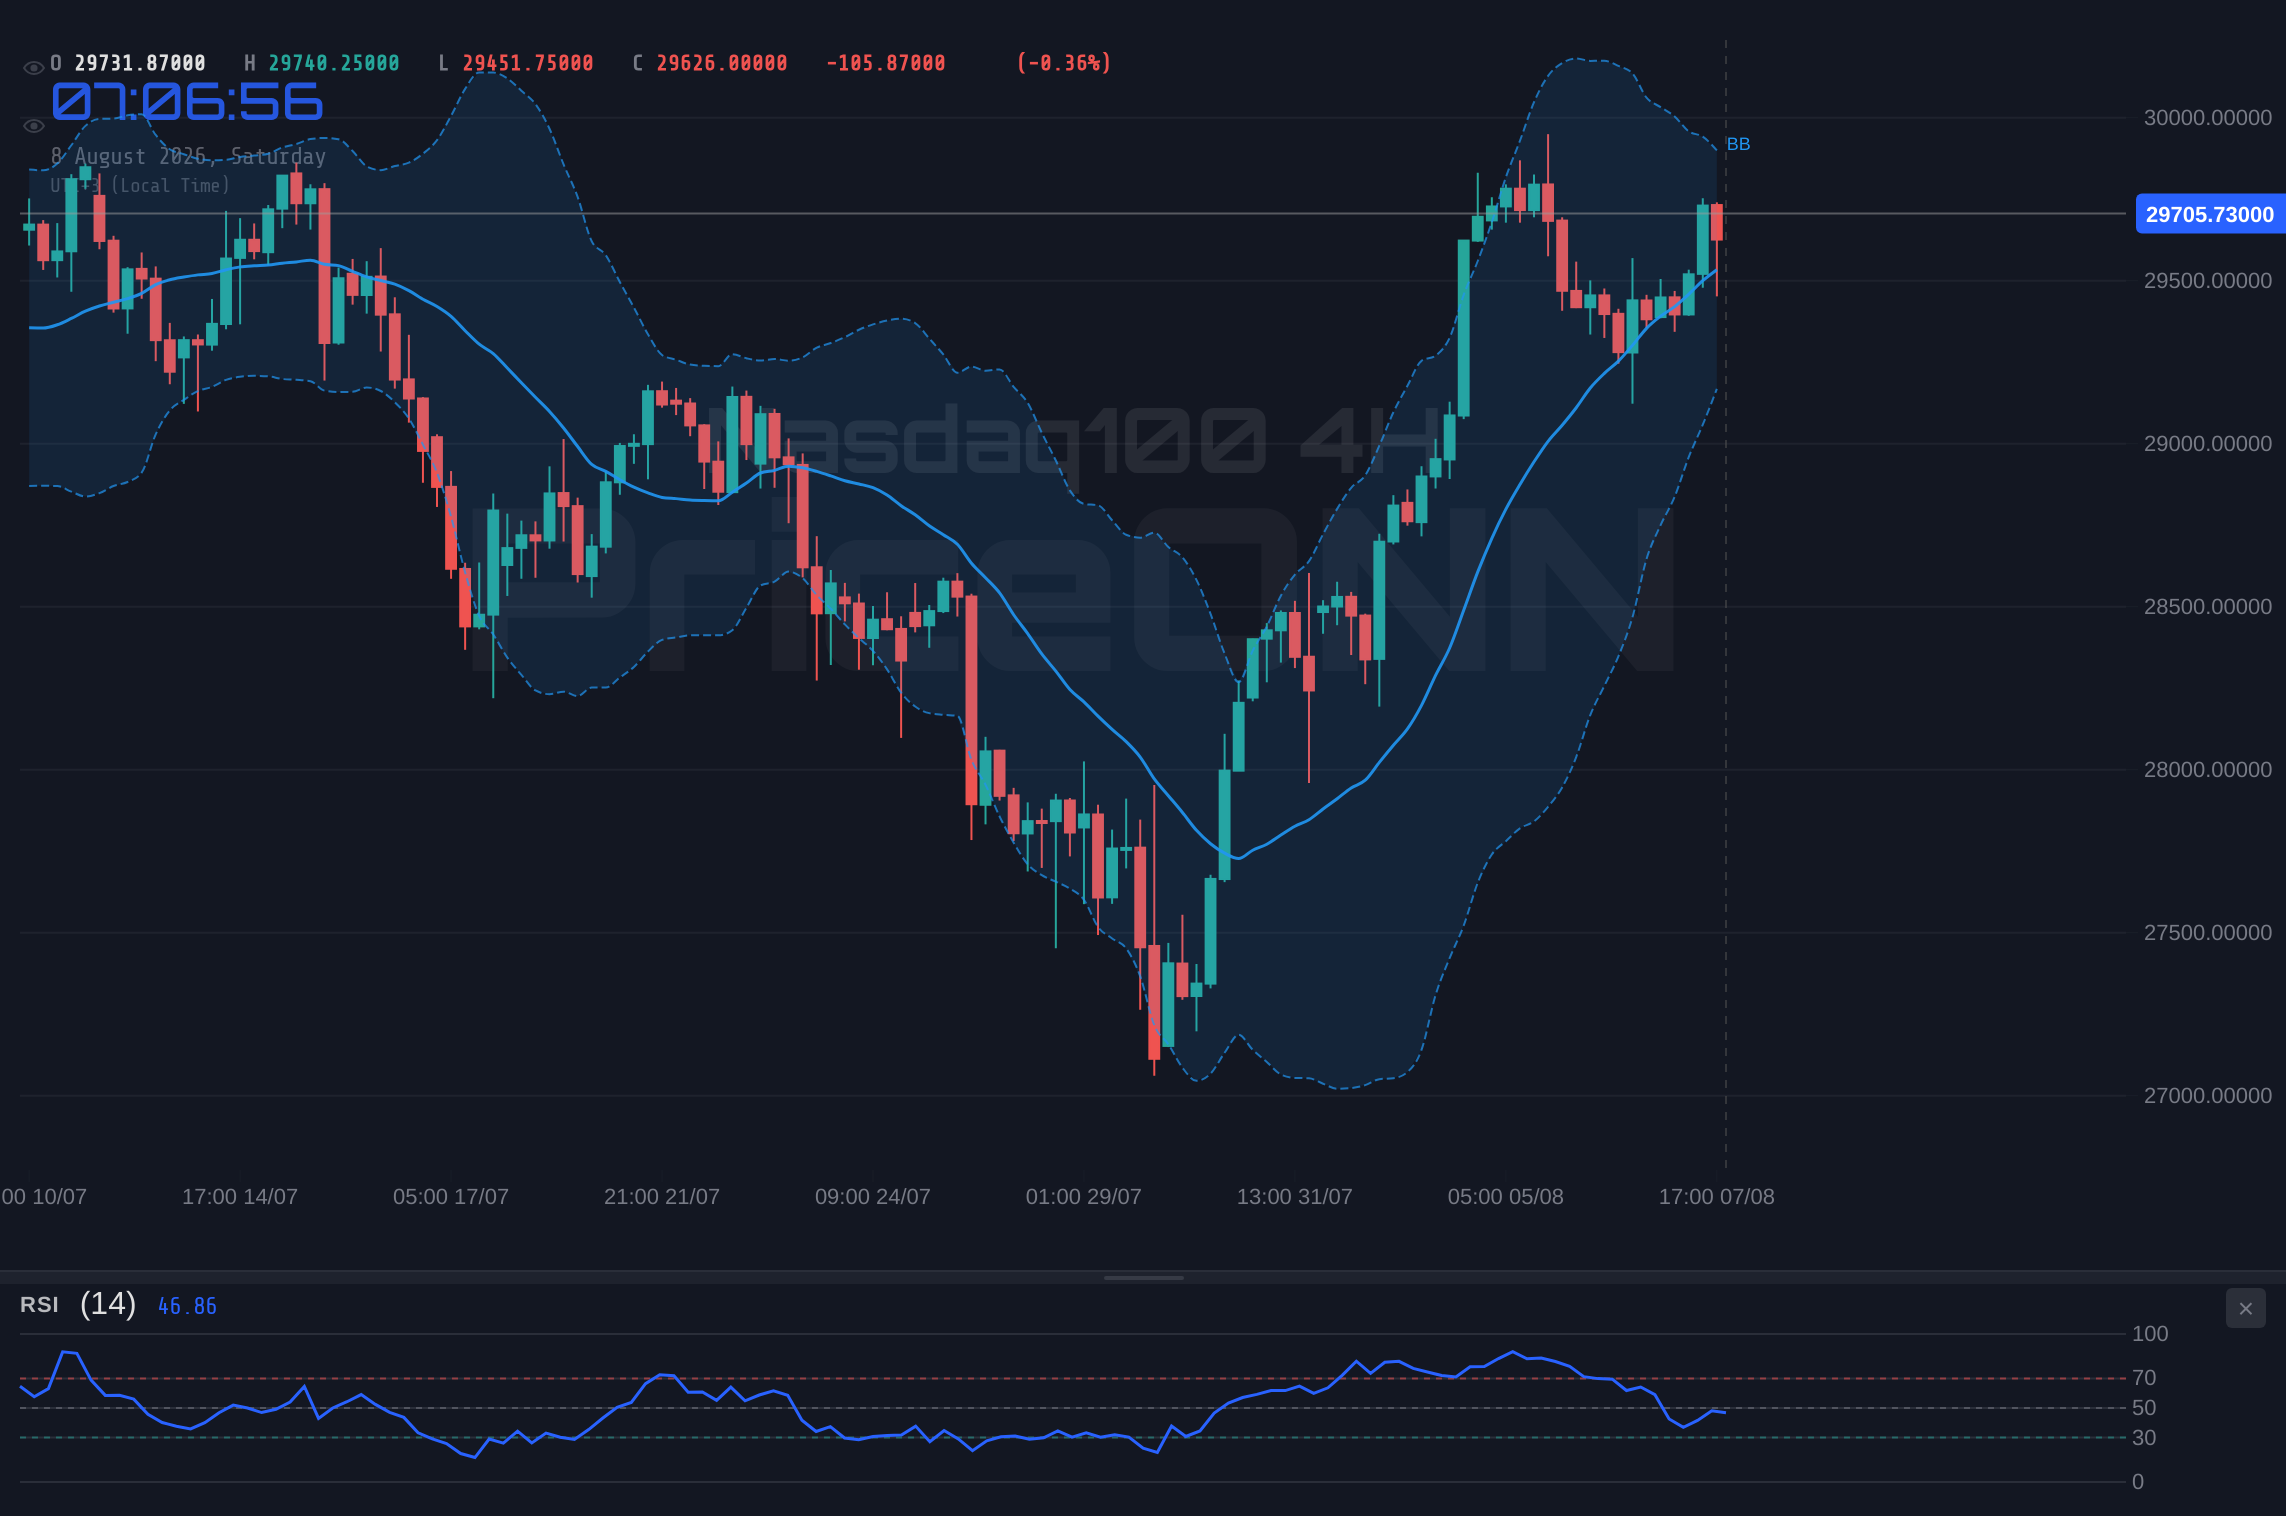
Shifting to the 4-hour timeframe, the technical landscape for the Nasdaq 100 continues to suggest a bullish bias, albeit with nuances. The RSI at 65.13 remains in the neutral zone, signaling positive momentum but inching closer to the overbought threshold. This suggests that while buyers are active, there might be limited room for further immediate upside without a fresh catalyst or a period of consolidation. The MACD on this timeframe is also showing positive momentum, reinforcing the short-term bullish sentiment. However, the ADX value of 33.8 indicates a stronger trend compared to the 1-hour chart, suggesting that the underlying trend, despite the week's flat close, has some conviction. The Stochastic Oscillator, with K=92.65 and D=54.98, is a notable point of interest; the high K value signals extreme overbought conditions, potentially foreshadowing a pullback or a period of sideways movement as sellers might step in to take profits. The Bollinger Bands are situated above the middle band, aligning with the general upward inclination.
On the daily chart, the Nasdaq 100 presents a more complex picture, reflecting the indecision observed at the weekly close. The RSI at 57.05 is firmly in neutral territory, indicating neither overbought nor oversold conditions, which aligns with the lack of a decisive trend. The MACD is exhibiting positive momentum, with the MACD line above its signal line, suggesting that the longer-term trend might still be intact, or at least recovering. However, the ADX value of 21.98 points to a weak trend, reinforcing the idea that the market is in a consolidation phase rather than a strong trending environment. This is a critical observation for traders: a weak ADX suggests that breakouts from current ranges may not have strong follow-through initially. The Stochastic Oscillator, with K=85.1 and D=72.72, is flashing an overbought signal on this longer timeframe, which is a significant divergence from the weaker ADX. This overbought condition, combined with the flat weekly close, suggests that upside may be capped in the short term without a significant shift in market sentiment or macroeconomic data.
The correlation with the US Dollar Index (DXY) is a crucial element in understanding the Nasdaq 100's recent price action. With the DXY currently trading at 99.58 and showing a downward trend across multiple timeframes, this typically correlates with increased risk appetite in equity markets, including the Nasdaq 100. A weaker dollar often makes US equities more attractive to international investors and can signal a shift away from safe-haven assets. However, the Nasdaq 100's flat close despite the dollar's weakness suggests that other factors, such as anticipation of the NFP report or specific sector rotations, might be playing a more dominant role in price determination. The DXY’s own technicals, with RSI at 36.17 on the 1H chart and ADX at 37.69 indicating a strong downtrend, suggest further dollar weakness could be on the horizon. If the NFP data comes in weaker than expected, it could accelerate this dollar decline and potentially provide a tailwind for the Nasdaq 100, but the current overbought signals on longer-term oscillators might temper the extent of any rally.
Geopolitical tensions, while not directly impacting the Nasdaq 100 as acutely as commodities or currencies, always lurk in the background as a potential risk-off catalyst. Recent news highlights concerns ranging from the Strait of Hormuz to US-China relations. While the market has shown resilience, a sudden escalation in these geopolitical fronts could trigger a flight to safety, impacting risk assets like tech stocks. For instance, the surge in gold prices above $4,300 following weak NFP data (as reported by various sources) demonstrates how negative surprises can shift market sentiment rapidly. While gold's rally is driven by different factors, a broad risk-off move would undoubtedly put pressure on the Nasdaq 100. Traders must remain vigilant, monitoring headlines that could disrupt the current market equilibrium and spill over into equity sentiment. The interplay between economic data, central bank policy expectations, and geopolitical stability forms a complex web that dictates market direction.
The economic calendar is dominated by the impending US July Non-Farm Payrolls (NFP) report. Projections for July payrolls were around +70,000, with the unemployment rate expected to hold steady at 4.2%. However, recent news indicates a shock: the US economy unexpectedly lost 23,000 jobs in July, a stark contrast to projections. This negative surprise has significant implications. It reduces the odds of a September rate hike by the Federal Reserve, which is generally a positive development for growth-sensitive assets like the Nasdaq 100. Gold prices surged above $4,300 on this news, and metals reversed their summer hawkish Fed trend. For the Nasdaq 100, this data point could be the catalyst needed to break out of its recent consolidation. However, the interpretation will be key: is this a temporary blip, or a sign of a broader economic slowdown that could eventually impact corporate earnings and tech valuations? The market's reaction will be telling.
Considering the conflicting signals across different timeframes and indicators, a cautious yet strategically positioned approach is warranted for the Nasdaq 100. The 1-hour and 4-hour charts lean bullish, supported by positive MACD momentum and RSI readings, but are tempered by overbought Stochastic levels and a weak ADX trend. The daily chart reinforces the consolidation theme, with a neutral RSI and a weak ADX, but an overbought Stochastic. This suggests that while the path of least resistance might be upwards in the immediate short term, significant upside may be capped without further confirmation or a catalyst. The key levels to watch are the support at $29,530.07 (1H) and $29,379.23 (4H), and the resistance at $29,679.68 (1H) and $29,829.28 (4H). A decisive break above $29,829.28 could signal a continuation of the bullish trend, whereas a fall below $29,379.23 might indicate a deeper correction.
The market's reaction to the weaker-than-expected NFP data will be crucial. If the Nasdaq 100 can decisively break above the $29,829.28 resistance level, it could signal a confirmation of bullish momentum, potentially targeting higher levels. This scenario would be supported by a continued decline in the DXY and a dovish shift in Fed rate hike expectations. Conversely, if the index fails to hold support levels, particularly the $29,379.23 mark, it could signal a deeper correction, exacerbated by any lingering overbought conditions on longer-term oscillators and potential profit-taking. The current environment demands adaptability, with traders needing to be ready to adjust positions as new information unfolds. The flat close at $29,706.54 is not an endpoint, but a pause before the next significant market move.
Looking ahead, the focus remains squarely on the implications of the latest employment figures and subsequent Fed commentary. The Nasdaq 100's ability to digest this new information will be a key determinant of its short-to-medium term trajectory. While the technical indicators present a mixed bag, the underlying sentiment, bolstered by potential Fed dovishness stemming from the weak jobs report, could provide the impetus for an upward move. However, the overbought signals on longer timeframes and the weak trend indicated by the ADX cannot be ignored. This suggests that any rally might be met with resistance, and a period of choppiness is likely until a clearer trend emerges. Traders should prioritize risk management, using the identified support and resistance levels to define their positions and entry/exit points.
The interplay between different asset classes also warrants attention. The surge in gold prices, driven by the weak NFP data and reduced rate-hike odds, highlights a potential shift in investor sentiment towards safer assets, although this can be counteracted by a general risk-on mood if the Fed remains perceived as accommodative. The performance of the US Dollar Index (DXY) will be a critical barometer; a continued downtrend in the DXY, currently at 99.58, could provide a supportive backdrop for equity markets like the Nasdaq 100. However, if geopolitical risks escalate significantly, we could see a flight to dollar strength, complicating the outlook for risk assets. The current technical setup on the Nasdaq 100, with its consolidation around $29,706.54, suggests that the market is waiting for a definitive signal from either domestic economic data or global risk factors.
The lack of a strong trend, as indicated by the ADX readings across all timeframes (1H: 21.36, 4H: 33.8, 1D: 21.98), is perhaps the most telling technical feature of the current Nasdaq 100 market. While the 4-hour ADX shows a stronger trend at 33.8, the shorter and longer timeframes suggest a less defined direction. This environment is conducive to range-bound trading or sharp, short-lived moves following significant news events. The Stochastic Oscillator's overbought readings on the 4-hour (K=92.65) and daily (K=85.1) charts are particularly noteworthy. They suggest that any upward momentum may be met with selling pressure as traders look to exit positions or take profits. Confirmation of a sustained breakout above key resistance levels, such as $29,829.28 on the 4H chart, would be needed to invalidate these overbought signals and signal a continuation of the bullish trend.
The Nasdaq 100 finds itself at a pivotal juncture, trading flat at $29,706.54 as it awaits the crucial NFP report. The technical indicators offer a mixed outlook: bullish short-term momentum is present, but longer-term oscillators show overbought conditions, and trend strength is weak. The DXY's decline provides a potential tailwind, but geopolitical risks and the overarching economic outlook remain factors to monitor. The upcoming NFP data is poised to be the primary driver, potentially breaking the current consolidation and establishing a clearer direction. Traders should remain vigilant, focusing on key support and resistance levels and managing risk diligently in this data-dependent environment.
Bearish Scenario: Consolidation Breakdown
60% ProbabilityNeutral Scenario: Range-Bound Action
25% ProbabilityBullish Scenario: Post-NFP Rally
15% ProbabilityFrequently Asked Questions: Nasdaq100 Analysis
What happens if Nasdaq100 breaks below the $29,379.23 support level?
A close below the 4-hour support at $29,379.23 would invalidate the bullish outlook and trigger our bearish scenario, targeting $29,280.22 and potentially $28,911.14. This would likely be accompanied by increased dollar strength or risk-off sentiment.
Should I buy Nasdaq100 at current levels around $29,706.54 given the mixed signals?
Given the mixed signals and overbought oscillators on longer timeframes, buying at current levels requires caution. A confirmed breakout above $29,829.28 on strong catalyst confirmation would be a more robust entry signal, while waiting for a pullback to support near $29,379.23 could offer a better risk-reward.
Is the RSI at 65 a sell signal for Nasdaq100 right now?
An RSI of 65 on the 4-hour chart indicates bullish momentum but is approaching overbought territory. It's not a direct sell signal on its own, but it warrants attention. A sustained move into the 70+ zone, especially combined with other bearish technicals or negative news, would increase the probability of a pullback.
How will the US Non-Farm Payrolls report affect Nasdaq100 this week?
The unexpectedly negative NFP report (loss of 23,000 jobs) suggests potential Fed dovishness, which could boost the Nasdaq 100. However, the market's reaction will depend on how this data is interpreted alongside geopolitical risks and other economic factors. A strong 'risk-on' response could push the index towards resistance levels around $29,829.28 and higher.
Track markets in real-time
AI-powered analysis, technical indicators and real-time price data.
Join Our Telegram Channel
Breaking market news, AI analysis and trading signals instantly.
Join Channel