

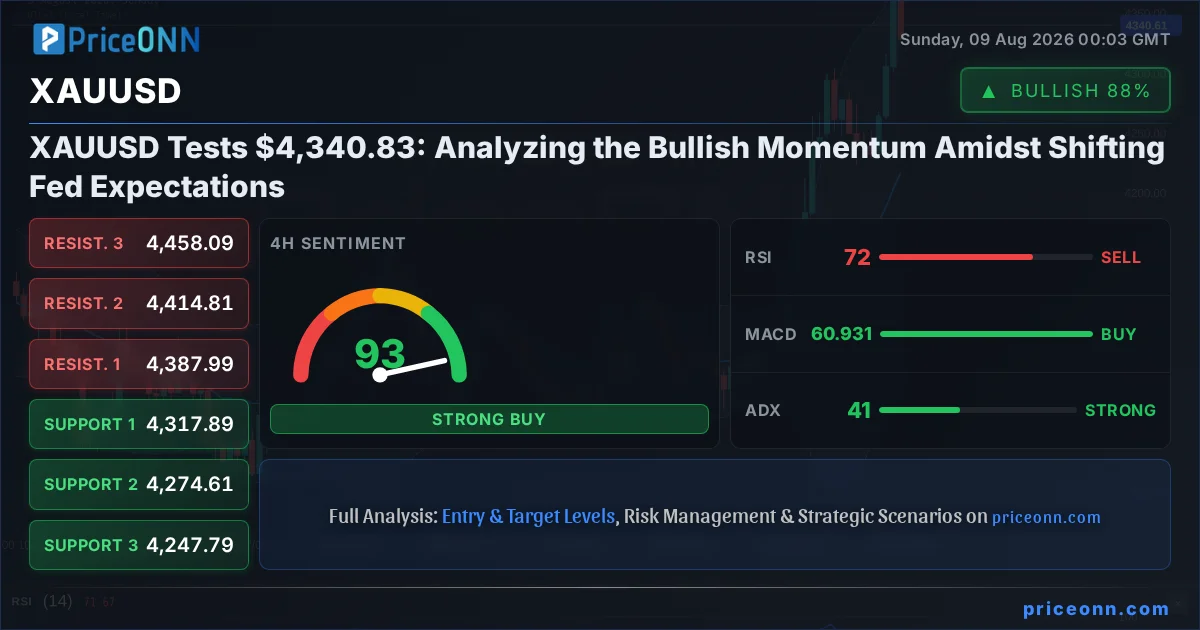
The roar of the bulls was undeniable last week as XAUUSD, the price of gold, surged past the significant $4,300 mark, closing the week with an impressive 2.37% gain and settling around the $4,340.83 level. This upward momentum, a significant reversal from the hesitations seen in prior weeks, has traders and investors alike scrutinizing the charts for the next move. The question on everyone's mind: is this the start of a sustained rally, or a temporary reprieve before further consolidation? The confluence of technical signals and shifting macroeconomic narratives suggests that while the immediate outlook is bullish, key levels must hold to confirm the trend's continuation. Understanding the interplay between a strengthening dollar index and the demand for safe-haven assets is crucial as we navigate this evolving market landscape.
- XAUUSD closed the week at $4,340.83, marking a significant 2.37% gain driven by a weak NFP report and easing Fed hike bets.
- The 4-hour chart shows a powerful bullish trend (ADX 40.51), with RSI at 72.29 indicating overbought conditions on this timeframe, suggesting potential for a short-term pullback.
- Key support at $4,330.83 needs to hold for the bullish trend to continue, while resistance at $4,341.60 is the immediate hurdle.
- Geopolitical risks, particularly concerning the Strait of Hormuz and US-China tensions, are providing underlying support for gold prices.
Navigating the Gold Rush: Technical Underpinnings of the Rally
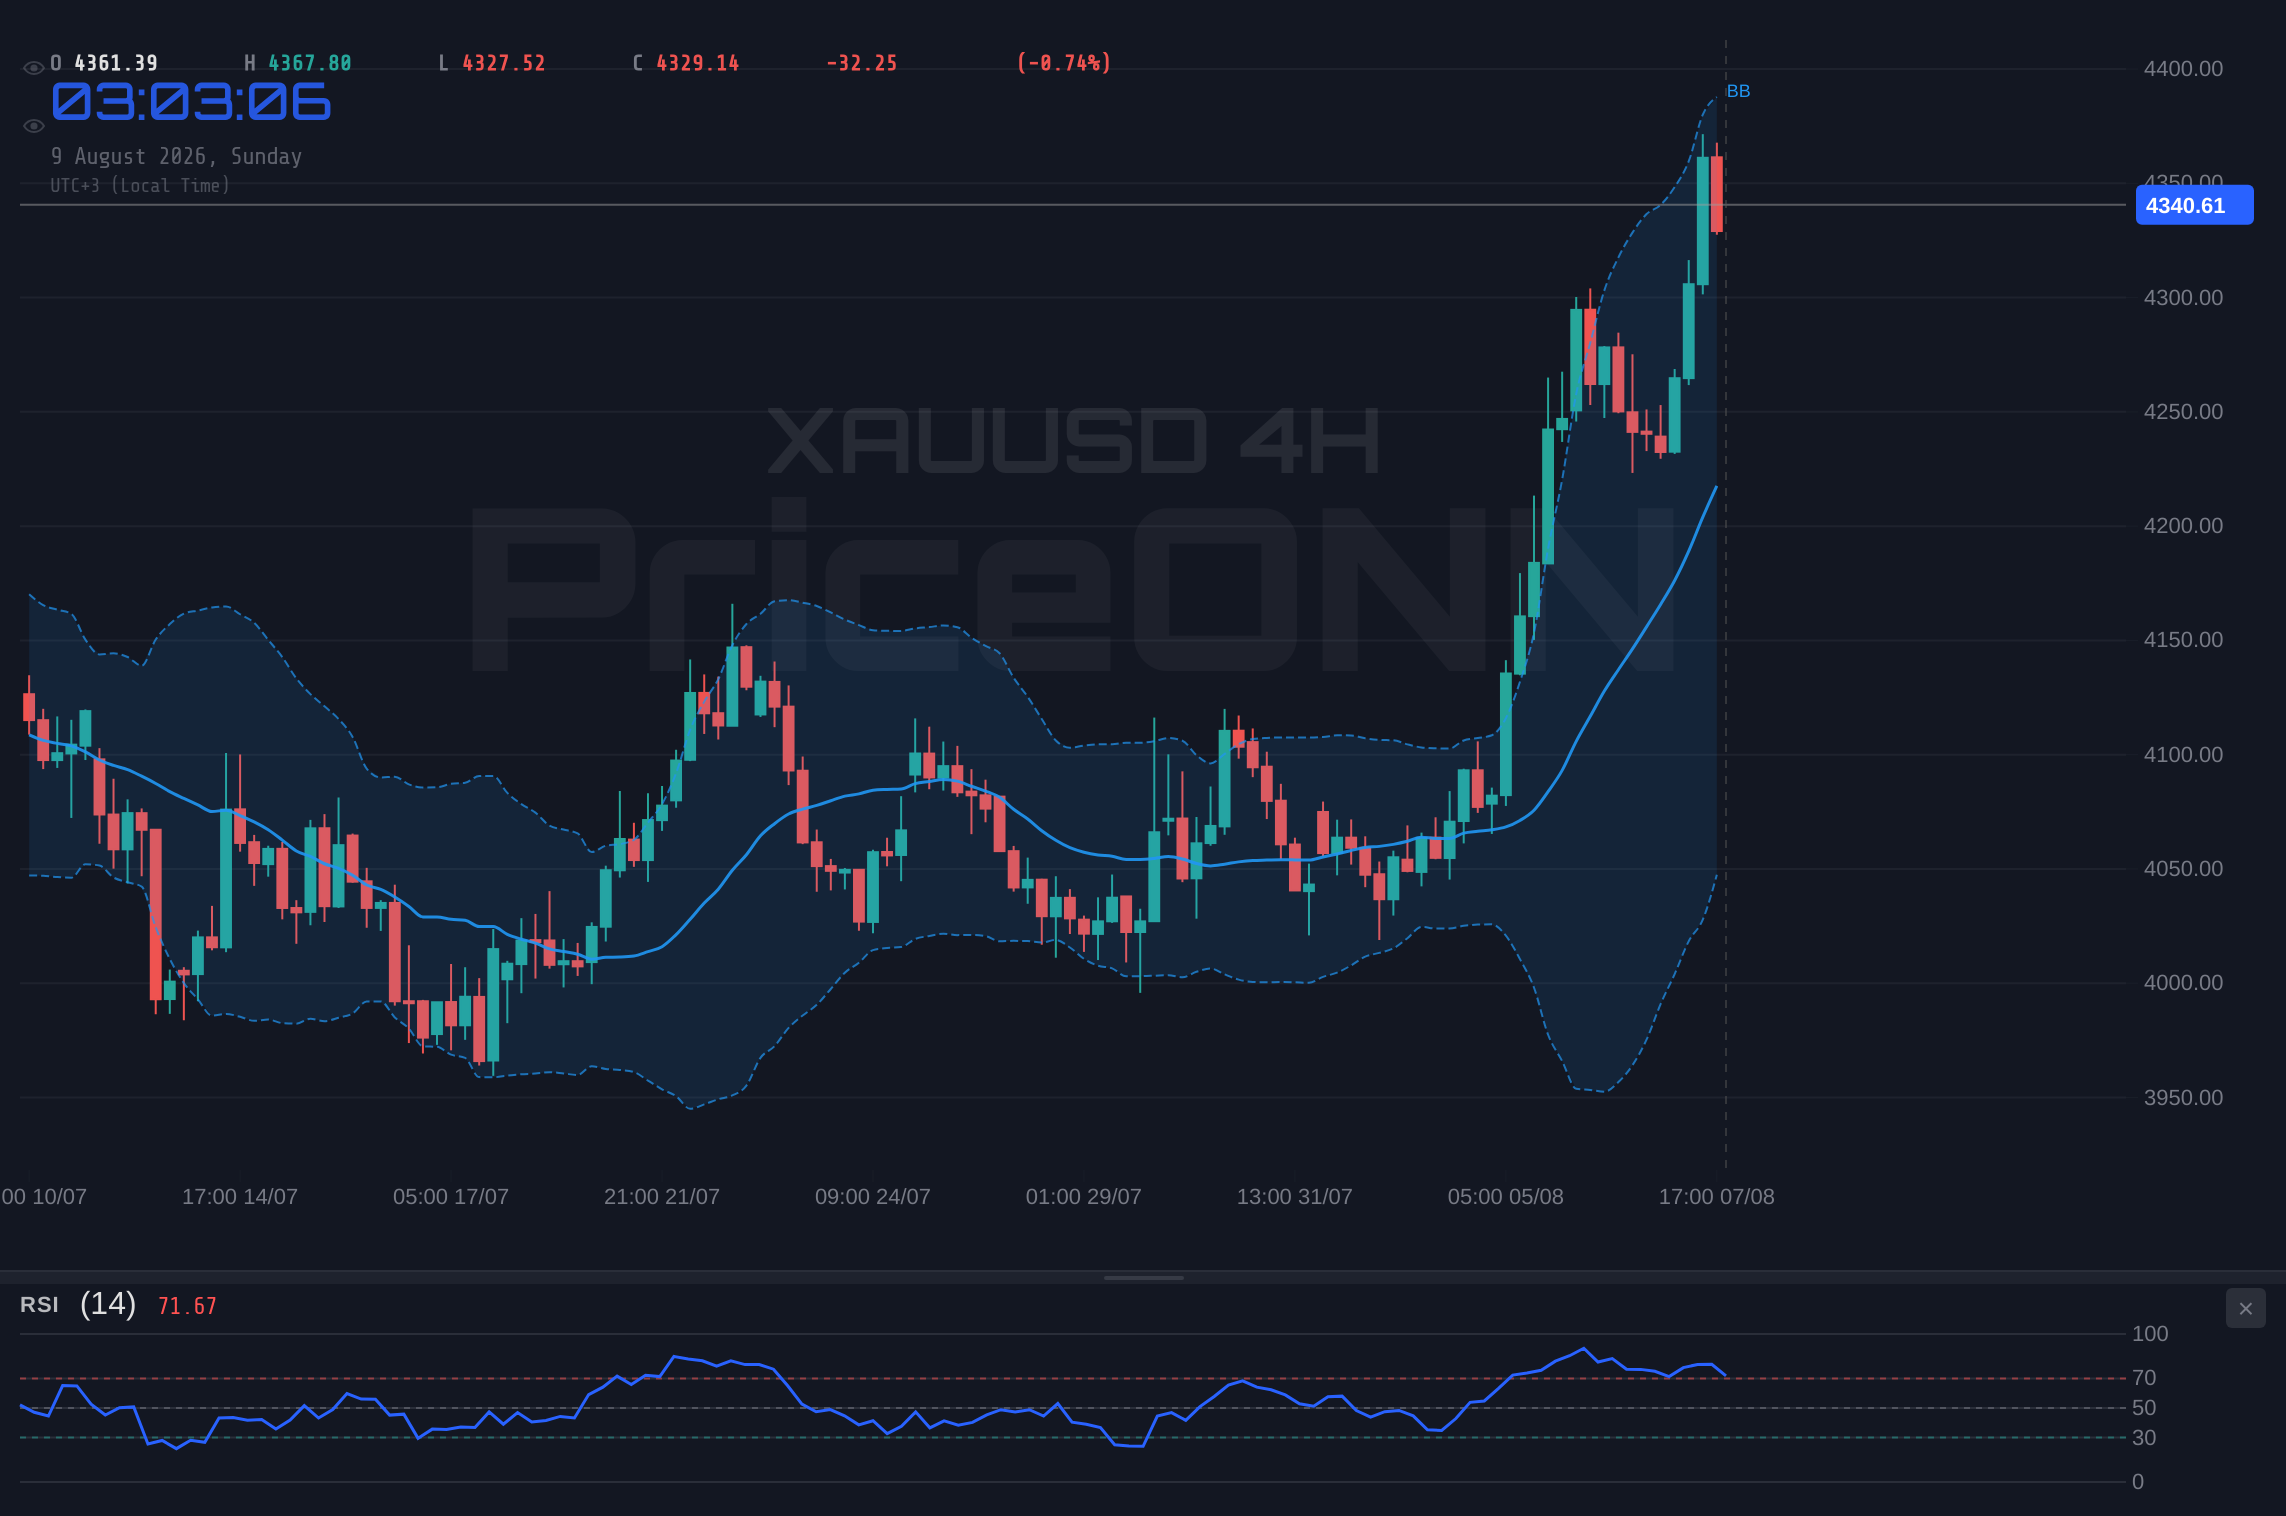
The technical tapestry woven by XAUUSD over the past week presents a compelling bullish narrative, particularly when examining the 4-hour and daily charts. The ADX, a measure of trend strength, stands robustly at 40.51 on the 4-hour timeframe, signaling a strong upward trend that has captured market participants' attention. This is further corroborated by the MACD, which continues to show positive momentum, with its signal line consistently above the MACD line, indicating that buyers are firmly in control of the short-to-medium term direction. The Bollinger Bands, a volatility indicator, also echo this bullish sentiment, with price action consistently trading above the middle band, suggesting an expansion of upward movement and a potential test of higher levels. This isn't just a fleeting pop; the underlying strength indicated by these indicators suggests a developing trend that warrants close observation.
However, a closer look reveals nuances that prevent a purely one-dimensional bullish outlook. On the 4-hour chart, the RSI is hovering at 72.29, firmly within overbought territory. While a strong trend can keep RSI elevated for extended periods, this reading suggests that the market may be due for a period of consolidation or a minor pullback to allow momentum indicators to reset. The Stochastic oscillator on the same timeframe, while showing a rising %K line above %D, is also entering potentially overbought territory, hinting at a possible slowdown or reversal if immediate resistance levels are not decisively breached. This divergence between the strong trend indicated by ADX and MACD, and the overbought readings on RSI and Stochastic, creates a zone of tension that traders must respect. It implies that while the overall direction is up, the path forward may not be a straight line, and pullbacks could offer opportunities for entry rather than signaling a complete trend reversal.
The daily chart, while still showing positive signals, offers a broader perspective. The ADX here is lower at 27.02, indicating a less aggressive trend compared to the 4-hour timeframe, but still within the 'strong trend' classification. The RSI at 65.48 remains in neutral territory, leaning towards bullish, and importantly, not yet in the overbought zone that would trigger immediate caution. The MACD also maintains positive momentum. The Bollinger Bands on the daily chart are positioned above the middle band, suggesting an upward bias. The Stochastic on the daily chart shows a strong upward signal with %K at 87.86 and %D at 59.64, firmly in overbought territory. This daily overbought reading, combined with the 4-hour overbought conditions, reinforces the idea that a period of consolidation or a minor retracement is a distinct possibility in the short term, even as the longer-term trend remains intact. The key takeaway is that while the overarching trend is bullish, the current overbought conditions across multiple timeframes necessitate careful entry strategies and risk management.
The $4,340.83 Level: A Critical Juncture for Gold
The current price of XAUUSD at $4,340.83 is more than just a number; it represents a critical psychological and technical juncture. On the 1-hour chart, $4,341.60 stands as the immediate resistance level. A decisive break and hold above this point would signal continued bullish momentum, potentially paving the way for a retest of higher levels. Conversely, failure to overcome this resistance could lead to a retreat towards the intraday support levels, with $4,330.83 serving as the first significant line in the sand. This level is crucial because it represents a pivot point where the short-term sentiment could shift. A break below $4,330.83 might invite further selling pressure, potentially targeting the next support at $4,326.12. Traders will be closely watching this intraday battleground to gauge the immediate direction.
Looking at the 4-hour timeframe, the resistance zone around $4,387.99 to $4,414.81 becomes the next major target for the bulls. Clearing these levels would confirm a significant continuation of the upward trend. However, significant support lies at $4,317.89. This level is critical as it represents a more substantial floor that, if breached, could signal a more pronounced correction. The daily chart presents even broader levels, with resistance identified at $4,288.53, $4,336.66, and $4,369.28. The current price of $4,340.83 is nestled between these daily levels, highlighting the importance of the immediate price action. The support levels on the daily chart, starting at $4,207.78, $4,175.16, and $4,127.03, provide a much wider safety net, suggesting that the overall bullish trend remains intact unless these lower levels are breached.
The interplay between these levels is what defines the trading landscape. A successful push above $4,341.60 on the 1-hour chart, followed by a hold above $4,330.83, would strengthen the bullish case. However, if price action falters around $4,340.83 and begins to drift lower, the focus will shift to the support structure. The fact that the ADX on the 4-hour chart is above 40 suggests that any pullback, while possible due to overbought indicators, might be shallow and met with renewed buying interest as traders look to enter the prevailing trend at more favorable prices. The higher timeframe (daily) trend strength, while lower than the 4-hour, still supports the idea of upward potential, making dips a potential buying opportunity for those with a longer-term view, provided key supports are respected.
Correlation Analysis: DXY, Equities, and the Gold Equation
Gold's price action is rarely in a vacuum; it's intricately linked to broader market forces, most notably the US Dollar Index (DXY) and the sentiment in major equity indices like the S&P 500 and Nasdaq. Last week saw a notable weakening in the DXY, which is currently trading around 99.55, down 0.39% for the day. This inverse correlation is a well-established principle: as the dollar weakens, gold, often seen as an alternative store of value, tends to become more attractive, especially when priced in dollars. The DXY's descent from its recent highs suggests that global investors are seeking assets beyond the greenback, and gold has been a primary beneficiary. This dynamic provides a fundamental tailwind for XAUUSD, reinforcing the bullish technical signals observed.
The equity markets also play a critical role in the gold narrative, acting as a barometer for risk appetite. The S&P 500, currently trading at 6572.87 with a 0.74% gain, and the Nasdaq at 29708.86, up 1.11%, both showed strength last week. Historically, a strong equity market can sometimes dampen demand for safe-haven assets like gold as investors flock to riskier, higher-return assets. However, the recent surge in gold occurred *alongside* the rise in equities. This suggests that the primary driver for gold's ascent last week wasn't a flight to safety due to market turmoil, but rather a combination of a weaker dollar and specific geopolitical concerns. The fact that gold is rising even as equities are also climbing might indicate a broader inflationary concern or a flight to quality that isn't purely driven by fear but by a search for tangible assets amidst shifting central bank policies.
Furthermore, the recent Non-Farm Payrolls (NFP) report, which showed an unexpected job loss of 23,000 in July, has significantly impacted market expectations regarding Federal Reserve policy. This data point has led to a reassessment of potential September rate hikes, with futures markets now pricing in a lower probability. A less hawkish Fed stance typically translates to a weaker dollar and, consequently, a more supportive environment for gold. The news, highlighted by sources like Reuters and Bloomberg, explicitly links the NFP shock to gold prices surging above $4,300 and a lower dollar. This macro-level event provides a fundamental catalyst that aligns with the bullish technical picture, suggesting that the recent rally in XAUUSD is supported by both technical strength and a shift in the global monetary policy outlook.
Geopolitical Undercurrents: Fueling the Safe-Haven Demand
Beyond the charts and economic data, geopolitical tensions continue to cast a long shadow over global markets, providing a persistent underlying bid for safe-haven assets like gold. Recent news reports have highlighted ongoing concerns surrounding the Strait of Hormuz, warnings from Saudi Arabia, and persistent US-China tensions. These geopolitical flashpoints, as reported by outlets such as Forex News and Financial Times, can quickly inject volatility into the markets, prompting investors to seek refuge in assets perceived as more stable. Gold, with its historical role as a store of value during times of uncertainty, benefits directly from such elevated geopolitical risk premiums.
The situation in the Strait of Hormuz, a critical chokepoint for global oil supply, is particularly noteworthy. Any disruption or perceived threat in this region can lead to immediate spikes in oil prices, which in turn can fuel inflation concerns. As oil prices, like Brent crude trading around $81.23, remain elevated and subject to geopolitical whims, the inflationary implications continue to support the case for gold. While the recent NFP report might suggest a cooling labor market, the persistent risk of supply-side inflation from geopolitical events means that central banks may still face a difficult balancing act, potentially keeping real interest rates lower than otherwise expected, which is gold-positive.
The broader US-China relationship also remains a significant factor. Trade disputes, technological competition, and geopolitical posturing can create ripples across global financial markets. While specific trade tariffs or sanctions might not be immediately evident, the underlying tension creates a background level of uncertainty. This uncertainty encourages diversification into assets like gold, which are less susceptible to the direct economic fallout of such bilateral disputes. The confluence of these geopolitical factors - Strait of Hormuz, broader Middle East stability, and US-China relations - creates a fertile ground for sustained safe-haven demand, adding another layer of support to XAUUSD's current bullish trajectory, even as technical indicators suggest caution in the very short term.
Trade Scenarios and Probabilities for XAUUSD
Bearish Scenario: Consolidation Below Resistance
40% ProbabilityNeutral Scenario: Range-Bound Correction
30% ProbabilityBullish Scenario: Continued Uptrend
30% ProbabilityGiven the overbought conditions on the 4H and Daily RSI and Stochastic indicators, there is an elevated risk of a short-term pullback or consolidation. Traders should exercise caution and employ strict risk management, especially if entering new positions near current levels. The upcoming week's economic calendar, particularly any central bank commentary, could introduce significant volatility.
The Week Ahead: What To Watch For XAUUSD
As we look towards the coming week, the narrative for XAUUSD will likely be shaped by the ongoing interplay between technical levels, macroeconomic data, and geopolitical developments. The recent NFP report has certainly altered the landscape, easing some of the immediate pressure for aggressive Fed rate hikes. This shift provides a supportive backdrop for gold, but the market will be keenly awaiting further confirmation. Key economic events to monitor include any statements from Federal Reserve officials, as well as upcoming inflation data. Any hints of persistent inflation could reignite rate hike expectations, potentially pressuring gold, while signs of cooling inflation would likely solidify the current bullish bias.
Technically, the $4,330.83 support level on the 1-hour chart remains paramount. A failure to hold this level could signal a deeper correction, potentially testing the $4,320.06 area. Conversely, a sustained move above the $4,341.60 resistance, followed by a hold above $4,347.66, would confirm the continuation of the bullish trend, opening the door for targets towards $4,352.37 and beyond. The overbought conditions on the daily Stochastic oscillator suggest that even if the trend continues, periods of sideways movement or minor dips are probable. This means that patience and strategic entry points will be crucial for traders looking to capitalize on the prevailing upward momentum without taking on excessive risk.
Geopolitical tensions, while often unpredictable, will continue to act as a background supporting factor for gold. Any escalation or de-escalation in key regions like the Strait of Hormuz or related to US-China relations could trigger sharp price movements. Traders should remain vigilant to these headlines, as they can override technical signals in the short term. The correlation with the DXY will also be closely watched. If the dollar continues its downtrend, it will likely provide further tailwinds for XAUUSD. However, if geopolitical risks subside significantly or if Fed rhetoric turns unexpectedly hawkish, the dollar could regain strength, posing a challenge to gold's current rally. The coming week promises to be dynamic, with multiple factors vying for influence over the price of gold.
Frequently Asked Questions: XAUUSD Analysis
What happens if XAUUSD breaks above the $4,341.60 resistance level this week?
A sustained break above $4,341.60, confirmed by holding this level as support on the 1-hour chart, would likely signal continued bullish momentum. This could open the door for further upside targets towards $4,347.66 and potentially $4,352.37, especially if DXY weakness persists and geopolitical risks remain elevated.
Should I buy XAUUSD at current levels of $4,340.83 given the overbought RSI on the 4-hour chart?
Buying directly at $4,340.83 carries risk due to the 4-hour RSI at 72.29 signaling overbought conditions. A more prudent approach might be to wait for a minor pullback towards the $4,330.83 support level, or for confirmation of a breakout above immediate resistance, offering a better risk-reward ratio with a 30% probability assigned to the bullish continuation scenario.
Is the RSI at 65.48 on the daily chart a sell signal for XAUUSD?
An RSI of 65.48 on the daily chart is considered neutral-to-bullish, not a direct sell signal. While it indicates upward momentum, it is not yet in the overbought territory (typically above 70). This reading suggests the underlying trend is still strong and doesn't necessarily warrant a bearish stance on its own, especially with other indicators showing positive momentum.
How will the weak NFP report affect XAUUSD this week?
The surprisingly weak NFP report, showing job losses, has reduced expectations for aggressive Fed rate hikes. This typically weakens the US Dollar (DXY), providing a fundamental tailwind for gold. Consequently, this data supports the current bullish outlook for XAUUSD, making a continued uptrend more probable unless other major catalysts emerge.
| Indicator | Value | Signal | Interpretation |
|---|---|---|---|
| RSI (14) | 64.41 | Neutral | Neutral momentum on 1H, leaning bullish |
| MACD Histogram | Positive | Bullish | Positive momentum on 1H |
| Stochastic %K | 53.42 | Neutral | Crossing below %D on 1H, potential pullback |
| ADX | 35.76 | Bullish | Strong trend strength on 1H |
| Bollinger Bands | Above Mid | Bullish | Price trading above middle band on 1H |
Track markets in real-time
AI-powered analysis, technical indicators and real-time price data.
Join Our Telegram Channel
Breaking market news, AI analysis and trading signals instantly.
Join Channel