
DowJones30 Hovers Near $53,774.50 Resistance: Bulls Dig In
The DowJones30 is testing resistance at $53,774.50. Bulls are holding ground despite weak trend signals, while bears eye a potential pullback. This analysis dives deep into the technicals.
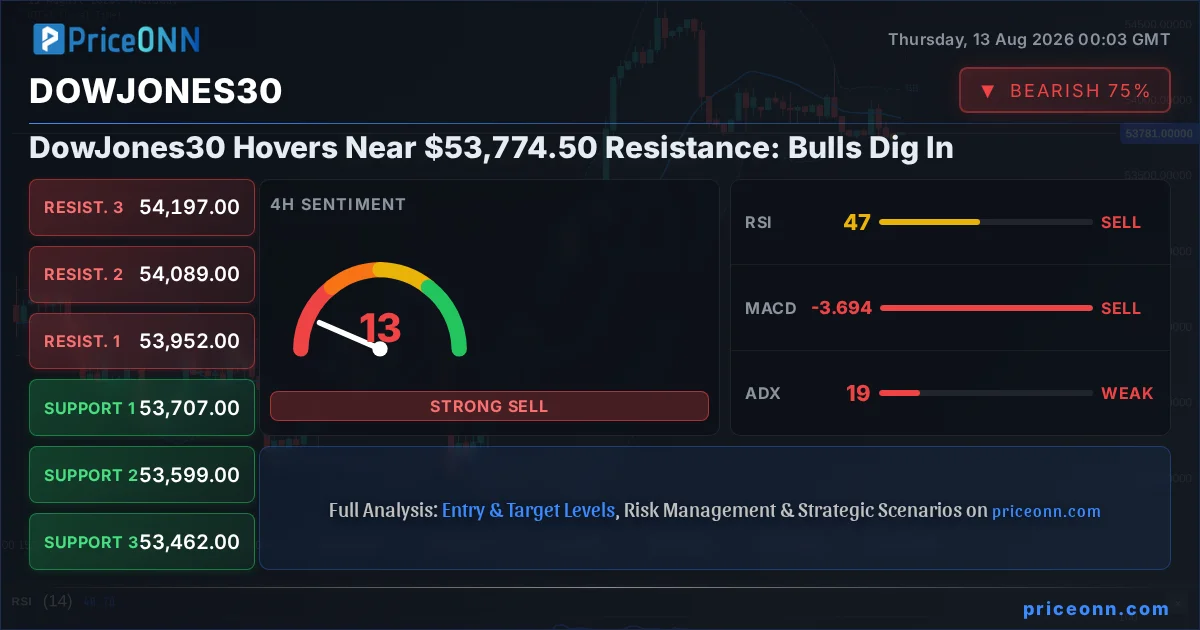
The Dow Jones Industrial Average is currently locked in a tense battle near its resistance level, trading at $53,774.50. Bulls are showing remarkable resilience, attempting to push past this crucial barrier, while the underlying technical signals hint at caution. This divergence between price action and momentum indicators creates a complex picture for traders, demanding a closer look at the forces at play. Is this a temporary pause before a renewed ascent, or is the market on the cusp of a significant pullback? Understanding the nuances of the current DowJones30 trend analysis is paramount for navigating these choppy waters.
- RSI at 44.17 signals potential bearish momentum on the 1-hour chart, suggesting caution.
- Critical resistance sits at $53,825.67, tested multiple times this week.
- The ADX at 11.03 indicates a weak trend, suggesting choppiness rather than a clear direction.
- DXY strength at 99.97 correlates with pressure on indices like the DowJones30, hinting at macro headwinds.
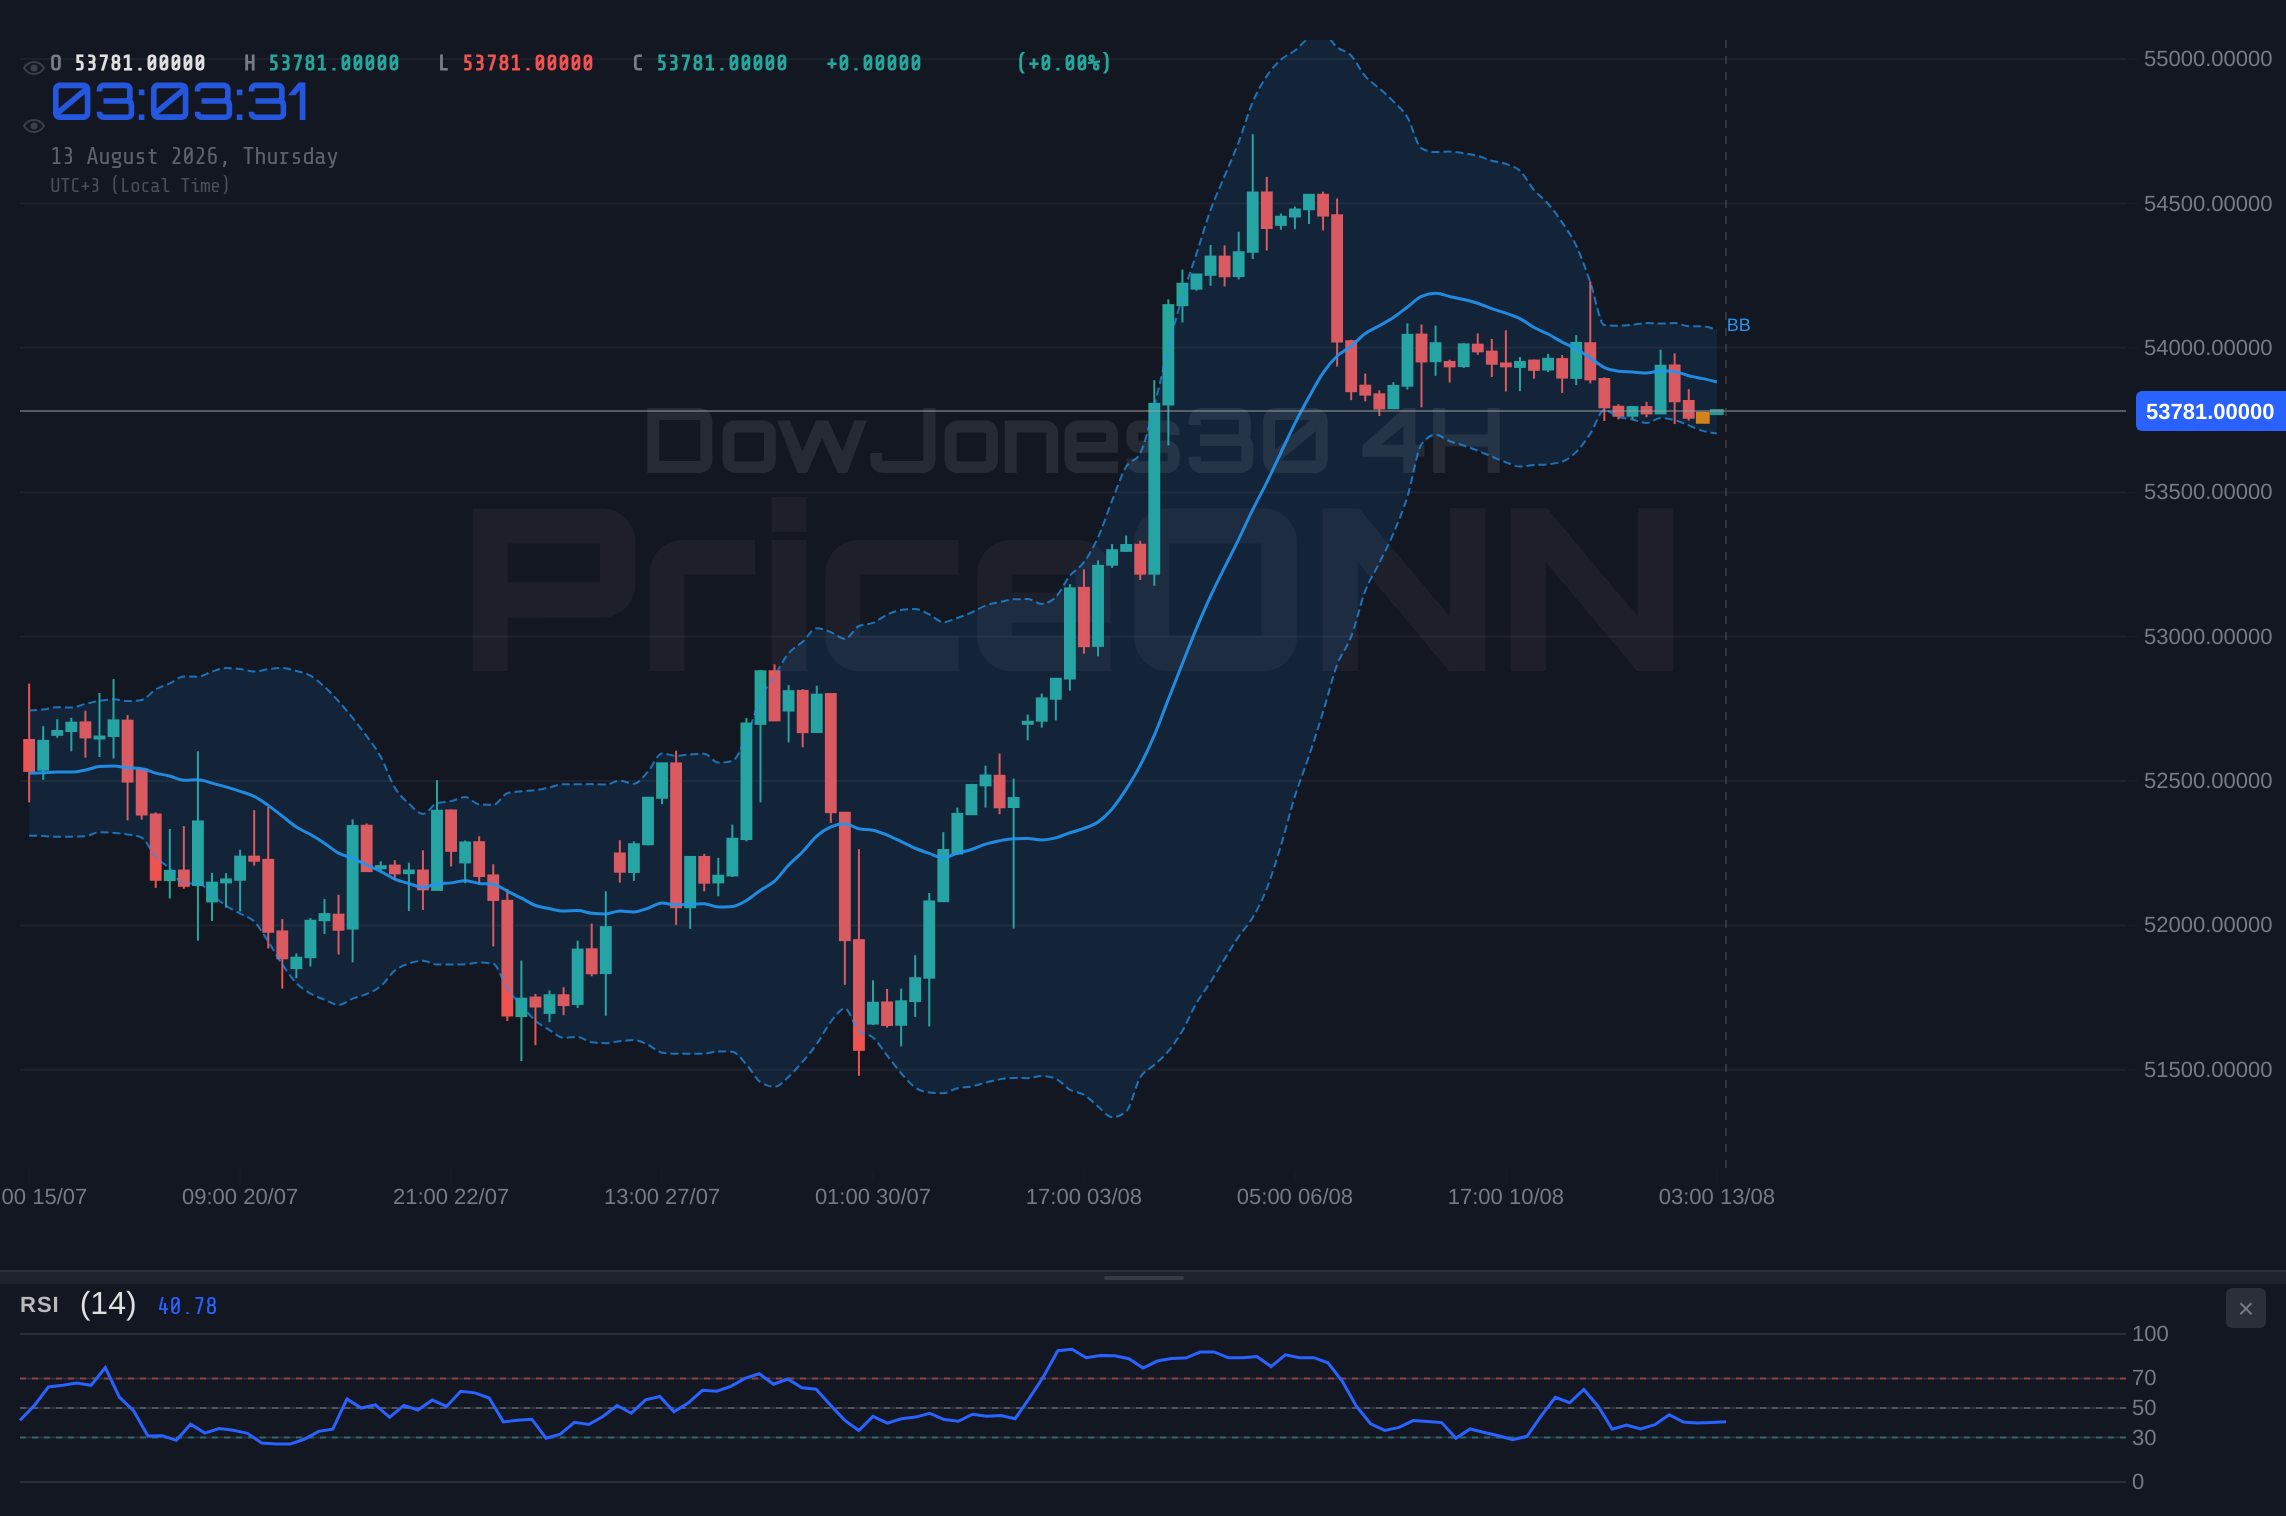
The market sentiment surrounding the DowJones30 is at a critical juncture. As the index hovers just below the $53,800 mark, the question on every trader's mind is whether the upward momentum can be sustained. The 1-hour chart paints a picture of indecision, with the Relative Strength Index (RSI) hovering at 44.17. This reading suggests that while sellers are not yet in complete control, the buying pressure seen in recent sessions is beginning to wane. This is precisely where you need to pay attention; a reading below 50 often precedes a move lower, and in this context, it could signal that the rally is losing steam. The Average Directional Index (ADX) further supports this notion, sitting at a mere 11.03. Such a low ADX value on the 1-hour timeframe is a classic indicator of a weak trend, implying that the current price action is more range-bound chop than a committed directional move. This is the kind of environment where breakout scanners might offer false signals, and patience truly looks like it will be rewarded. Traders who have been tracking the DowJones30 through the recent market fluctuations will recognize this pattern of weakening momentum as a precursor to potential reversals.
Adding to the complexity is the correlation with the Dollar Index (DXY). Currently at 99.97, the DXY is showing signs of strength, which typically exerts downward pressure on global indices, including the DowJones30. This inverse relationship means that as the dollar strengthens, assets priced in dollars, like US equities, can become relatively more expensive and less attractive to international investors. The fact that the DXY is not only holding its ground but showing a slight upward bias at 99.97 adds another layer of resistance for the bulls. If the dollar continues its ascent, it could provide the catalyst for a sharper pullback in the DowJones30, especially if it breaks through key support levels. The interplay between these macro forces and the immediate technical picture is what makes the current market setup so compelling, and it’s crucial to consider both aspects when forming a trading strategy. The DowJones30 today analysis shows a clear tension between short-term technical weakness and broader market correlations.
The Bull Case: Pushing Towards New Highs
Despite the cautionary signals from the 1-hour chart, the longer-term technicals and recent price action offer a compelling argument for the bulls. The 4-hour timeframe presents a more optimistic outlook, with the trend strength indicated at 79%, suggesting a predominantly upward bias. The Moving Average Convergence Divergence (MACD) on this timeframe shows positive momentum, with the MACD line above its signal line, indicating that buying pressure is still present. Furthermore, the Stochastic Oscillator is flashing a bullish signal, with the %K line (21.11) crossing above the %D line (13.73), suggesting a potential upward move from oversold conditions. This is often interpreted as a sign that the market is looking to reverse from its recent lows. While the RSI at 46.25 is not yet in bullish territory, it's moving away from oversold readings, which can be a precursor to a stronger uptrend. The key here is that the bulls are defending crucial support levels on this timeframe, with the first significant support identified at $53,707. A hold above this level, coupled with sustained buying volume, could pave the way for a retest of the immediate resistance.
On the daily chart, the picture for the bulls becomes even more pronounced. The trend strength is rated at a robust 86%, reinforcing the idea that the overarching trend remains upward. The MACD on the daily timeframe is also positive, sitting above its signal line, confirming the bullish momentum. The Stochastic Oscillator, despite showing a %K value of 70.25 and a %D of 80.53, is in a position where a cross above the %D line could signal a strong upward move, even if it's nearing overbought territory. The ADX at 22.44 indicates a moderately strong uptrend, suggesting that the market has enough conviction to move higher. The crucial aspect for the bulls is the $53,617.33 support level on the daily chart. If this level holds, and price action can push decisively above the $53,800 area, it would signal a strong continuation of the bullish trend. The DowJones30 price forecast from this perspective is optimistic, anticipating a move towards higher resistance levels. The ability of the index to hold these daily support levels is paramount for the continuation of the bull narrative.
The narrative for the bulls is further strengthened by the overall market context. While the DXY is showing some strength, the broader risk appetite, as indicated by the SP500's current price of 6572.87, remains relatively positive, despite some short-term weakness. The SP500's daily trend is currently listed as 'Düşüş' (Downward) with a strength of 100%, which might seem counterintuitive to a bullish Dow Jones outlook. However, the 4-hour chart for SP500 shows a trend strength of 50% and a bullish MACD signal, indicating that the short-term trend might be consolidating or preparing for a rebound. This slight divergence suggests that while the broader market might be facing headwinds, specific sectors or indices like the Dow Jones could still find footing. The fact that the Dow Jones 30 has managed to hold its ground and even approach resistance levels, despite the broader market's uncertainty, speaks to the resilience of its underlying components. This implies that specific economic factors or sector-specific strength might be driving the Dow Jones independently of the wider equity market sentiment, a point often overlooked in superficial market analysis.
Moreover, the recent economic data releases, while mixed, have not presented a clear case for immediate Fed tightening, which could be interpreted positively by equity markets. The July CPI data, for instance, came in line with expectations at 0.1% month-on-month, suggesting that inflationary pressures remain subdued. This scenario reduces the immediate pressure on the Federal Reserve to aggressively hike interest rates, which is generally supportive of stock markets. While the market is always forward-looking, the absence of alarming inflation figures provides a breathing room for bulls. The DowJones30's ability to consolidate near its highs in such an environment suggests underlying strength. The key level to watch for bulls remains the $53,825.67 resistance. A decisive close above this level, ideally on increased volume, would confirm the bullish thesis and open the door for further upside targets. Such a move would likely be interpreted as a breakout from the current consolidation phase, signaling renewed confidence in the market.
The Bear Case: Resistance Holds, Pullback Looms
Conversely, the bearish argument is primarily built upon the confluence of short-term technical warnings and the psychological significance of the $53,774.50 resistance level. As mentioned, the 1-hour RSI at 44.17 is a significant red flag. Readings below 50 on this short timeframe often precede further declines, especially when coupled with other bearish indicators. The MACD on the 1-hour chart is also showing negative momentum, with the MACD histogram printing negative values and the MACD line below the signal line. This suggests that sellers are gaining an edge in the immediate term. The Stochastic Oscillator on the 1-hour chart, while currently showing a bullish crossover, is emerging from oversold territory, and its %K value of 18.99 is still relatively low, indicating that the upward momentum from this signal might be weak and short-lived. The ADX at 11.03 is perhaps the strongest indicator for the bears in the short term, as it signals a lack of conviction in the current move. In a weak trend environment, price is more susceptible to reversals at key resistance levels. This is exactly the scenario the bears are betting on; they believe the market is ripe for a correction.
The 4-hour chart, while showing a generally upward trend, also contains elements that support the bearish view. The Stochastic Oscillator, with %K at 21.11 and %D at 13.73, is entering oversold territory, but more importantly, it's showing a bearish crossover (K
The correlation with the DXY at 99.97 also plays into the hands of the bears. A strengthening dollar typically acts as a headwind for US equities. If the DXY continues to climb, it could easily drag the Dow Jones lower, especially if it breaks through its own support levels. Furthermore, the SP500, despite its own mixed signals, has a daily trend marked as 'Düşüş' (Downward) with 100% strength. While this doesn't directly dictate the Dow Jones's movement, it reflects a broader caution in the equity markets. If the SP500 begins to experience a significant decline, it's highly probable that the Dow Jones will follow suit, regardless of its individual bullish technicals on the 4-hour chart. The bears are betting that the general market sentiment will eventually overwhelm the specific bullish drivers for the Dow Jones, leading to a broader risk-off move.
The geopolitical landscape, although not explicitly detailed in the provided market data, often plays a crucial role in market sentiment. Any escalation of global tensions or unexpected economic shocks could quickly shift the market's focus from domestic technicals to safe-haven assets. For instance, a sudden geopolitical event could strengthen the dollar and simultaneously trigger a sell-off in equities, providing the perfect environment for the bears to regain control. While the provided news snippets mention a stalled U.S.-Iran deal and a rebound in oil prices, these factors could contribute to underlying uncertainty. If these geopolitical risks begin to materialize into concrete market movements, they could easily become the catalyst for a DowJones30 pullback, especially as it tests this key resistance area. The bears are watching these developments closely, ready to capitalize on any shift in risk appetite.
Navigating the Levels: Scenarios and Probabilities
Given the conflicting signals and the current market tension, it's essential to outline potential scenarios. The probabilities assigned reflect the current technical picture, with a bias towards the bearish short-term indicators and the strong resistance level.
Bearish Scenario: Resistance Holds, Pullback Initiates
65% ProbabilityNeutral Scenario: Consolidation Around Resistance
25% ProbabilityBullish Scenario: Resistance Breakout Continues
10% ProbabilityThe current technical setup on the Dow Jones Industrial Average presents a clear battleground. The bears seem to have a slight edge due to the short-term indicators and the proximity to resistance, but the longer-term bullish trend cannot be ignored. The ADX's weakness on the 1-hour chart ($11.03) suggests that any move, whether up or down, might lack strong conviction initially. However, the 4-hour and daily charts show stronger trend indications (ADX 22.44 and 22.44 respectively), implying that if a breakout occurs, it could have more staying power. The key is to observe how the price reacts to the immediate resistance at $53,825.67 and support at $53,707. A decisive move above resistance, confirmed by increasing volume and improved momentum indicators, would favor the bullish scenario. Conversely, a failure to break higher and a subsequent move below the $53,707 support level would likely trigger the bearish scenario, opening the door for a significant correction. The DXY's current level of 99.97 remains a crucial factor to monitor; any further strengthening could cap upside potential for the index.
Frequently Asked Questions: DowJones30 Analysis
What happens if the DowJones30 breaks above $53,825.67 resistance, given the current weak 1-hour trend?
A break above $53,825.67 resistance, if confirmed by increasing volume and improving momentum indicators on the 4-hour chart, could signal a continuation of the bullish trend. However, given the weak ADX of 11.03 on the 1-hour chart, this breakout might initially lack strong conviction and could face choppy price action before establishing a clear direction.
Should I buy DowJones30 at current levels of $53,774.50, considering the RSI is at 44.17 on the 1-hour chart?
Buying at current levels of $53,774.50 carries significant risk, as the 1-hour RSI at 44.17 suggests waning bullish momentum and potential for a pullback. The 65% probability assigned to the bearish scenario indicates that a more conservative approach, waiting for a clear break of resistance or a test of support, might be prudent for risk management.
Is the RSI at 44.17 a sell signal for DowJones30 right now?
An RSI reading of 44.17 on the 1-hour chart is not a definitive sell signal, but it indicates a shift away from bullish momentum and leans towards bearish pressure. It suggests that buyers are losing control and that a move lower is becoming more probable, especially if key support levels are breached.
How will the subdued inflation data affect the DowJones30 this week, especially near resistance?
Subdued inflation data, like the 0.1% July CPI, generally supports equity markets by reducing the immediate pressure for aggressive Fed rate hikes. This could provide a tailwind for the DowJones30, but its proximity to resistance at $53,825.67 means that any positive impact might be capped unless a decisive breakout occurs. The market will likely remain sensitive to any hints of future policy changes.
| Indicator | Value | Signal | Interpretation |
|---|---|---|---|
| RSI (14) | 44.17 | Neutral | Moving away from overbought, but still lacks bullish conviction. |
| MACD Histogram | -19.5 | Bearish | Negative momentum suggests selling pressure. |
| Stochastic | K: 21.11, D: 13.73 | Bullish Crossover | Emerging from oversold, but crossover signal strength is questionable. |
| ADX | 11.03 | Weak Trend | Indicates choppy, range-bound conditions. |
| Bollinger Bands | Middle Band | Watch | Price is below the middle band on 1H, indicating potential weakness. |
Track markets in real-time
AI-powered analysis, technical indicators and real-time price data.
Join Our Telegram Channel
Breaking market news, AI analysis and trading signals instantly.
Join Channel