
DXY Tests $100.03: Bearish Trend Deepens Amid Inflation Data
The Dollar Index (DXY) hovers around $100.03, facing persistent selling pressure. Analysis of key indicators and recent inflation data suggests the bearish trend may continue.
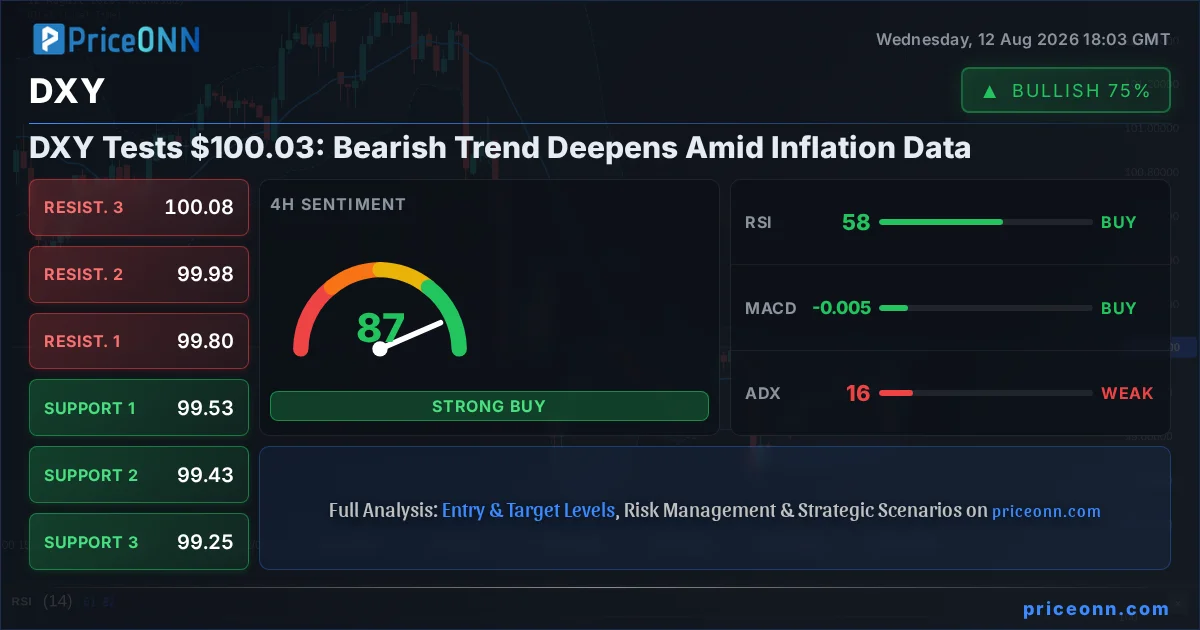
The Dollar Index (DXY) is currently navigating a critical juncture, trading at $100.03. This level, a significant psychological and technical marker, finds the DXY facing persistent headwinds. While recent price action might suggest a pause, a deeper dive into the technical indicators and the broader macroeconomic landscape reveals a narrative that leans increasingly bearish for the greenback. The interplay between subdued inflation prints and shifting market sentiment is creating a complex environment, but the current data paints a picture of a dollar struggling to regain its footing against a backdrop of cautious optimism elsewhere.
- RSI at 44.32 on the daily chart signals waning bullish momentum, indicating potential for further downside.
- A critical support level sits at $99.72, tested multiple times, with a break below threatening further losses.
- The ADX at 28.84 on the daily chart confirms a strong downtrend, suggesting current price action is part of a larger bearish move.
- With DXY trading at $100.03, correlated assets like gold are showing resilience, hinting at a potential shift in safe-haven preference.
The Dollar's Tightrope Walk at $100.03
The $100.03 mark for the Dollar Index (DXY) isn't just another number; it's a battleground. For weeks, this level has been a focal point, with bulls attempting to establish a firm foothold above it and bears consistently pushing back. The latest data shows the DXY has indeed dipped below this crucial psychological threshold, and the technical indicators are flashing warning signs. On the daily chart, the Relative Strength Index (RSI) stands at 44.32, firmly in neutral territory but displaying a downward trajectory. This suggests that any upward momentum is losing steam, and the path of least resistance might be lower. The MACD, a popular momentum indicator, is also showing negative momentum, with its histogram below the signal line, reinforcing the bearish sentiment. This isn't a picture of strength; it's one of considerable pressure.
The 4-hour timeframe offers a slightly more nuanced view, but the overall trend direction remains under scrutiny. While the DXY has seen some attempts to climb, the ADX at 15.72 on this timeframe indicates a weak trend. This suggests that the market is currently choppy and lacking clear direction on shorter timeframes, making it difficult for bulls to gain significant traction. However, the daily chart's ADX reading of 28.84 paints a different story, pointing towards a strong downtrend. This divergence between timeframes highlights the complexity of the current market. Traders are watching closely to see if the weaker short-term signals will eventually succumb to the stronger long-term bearish trend, or if a period of consolidation will precede a potential reversal.
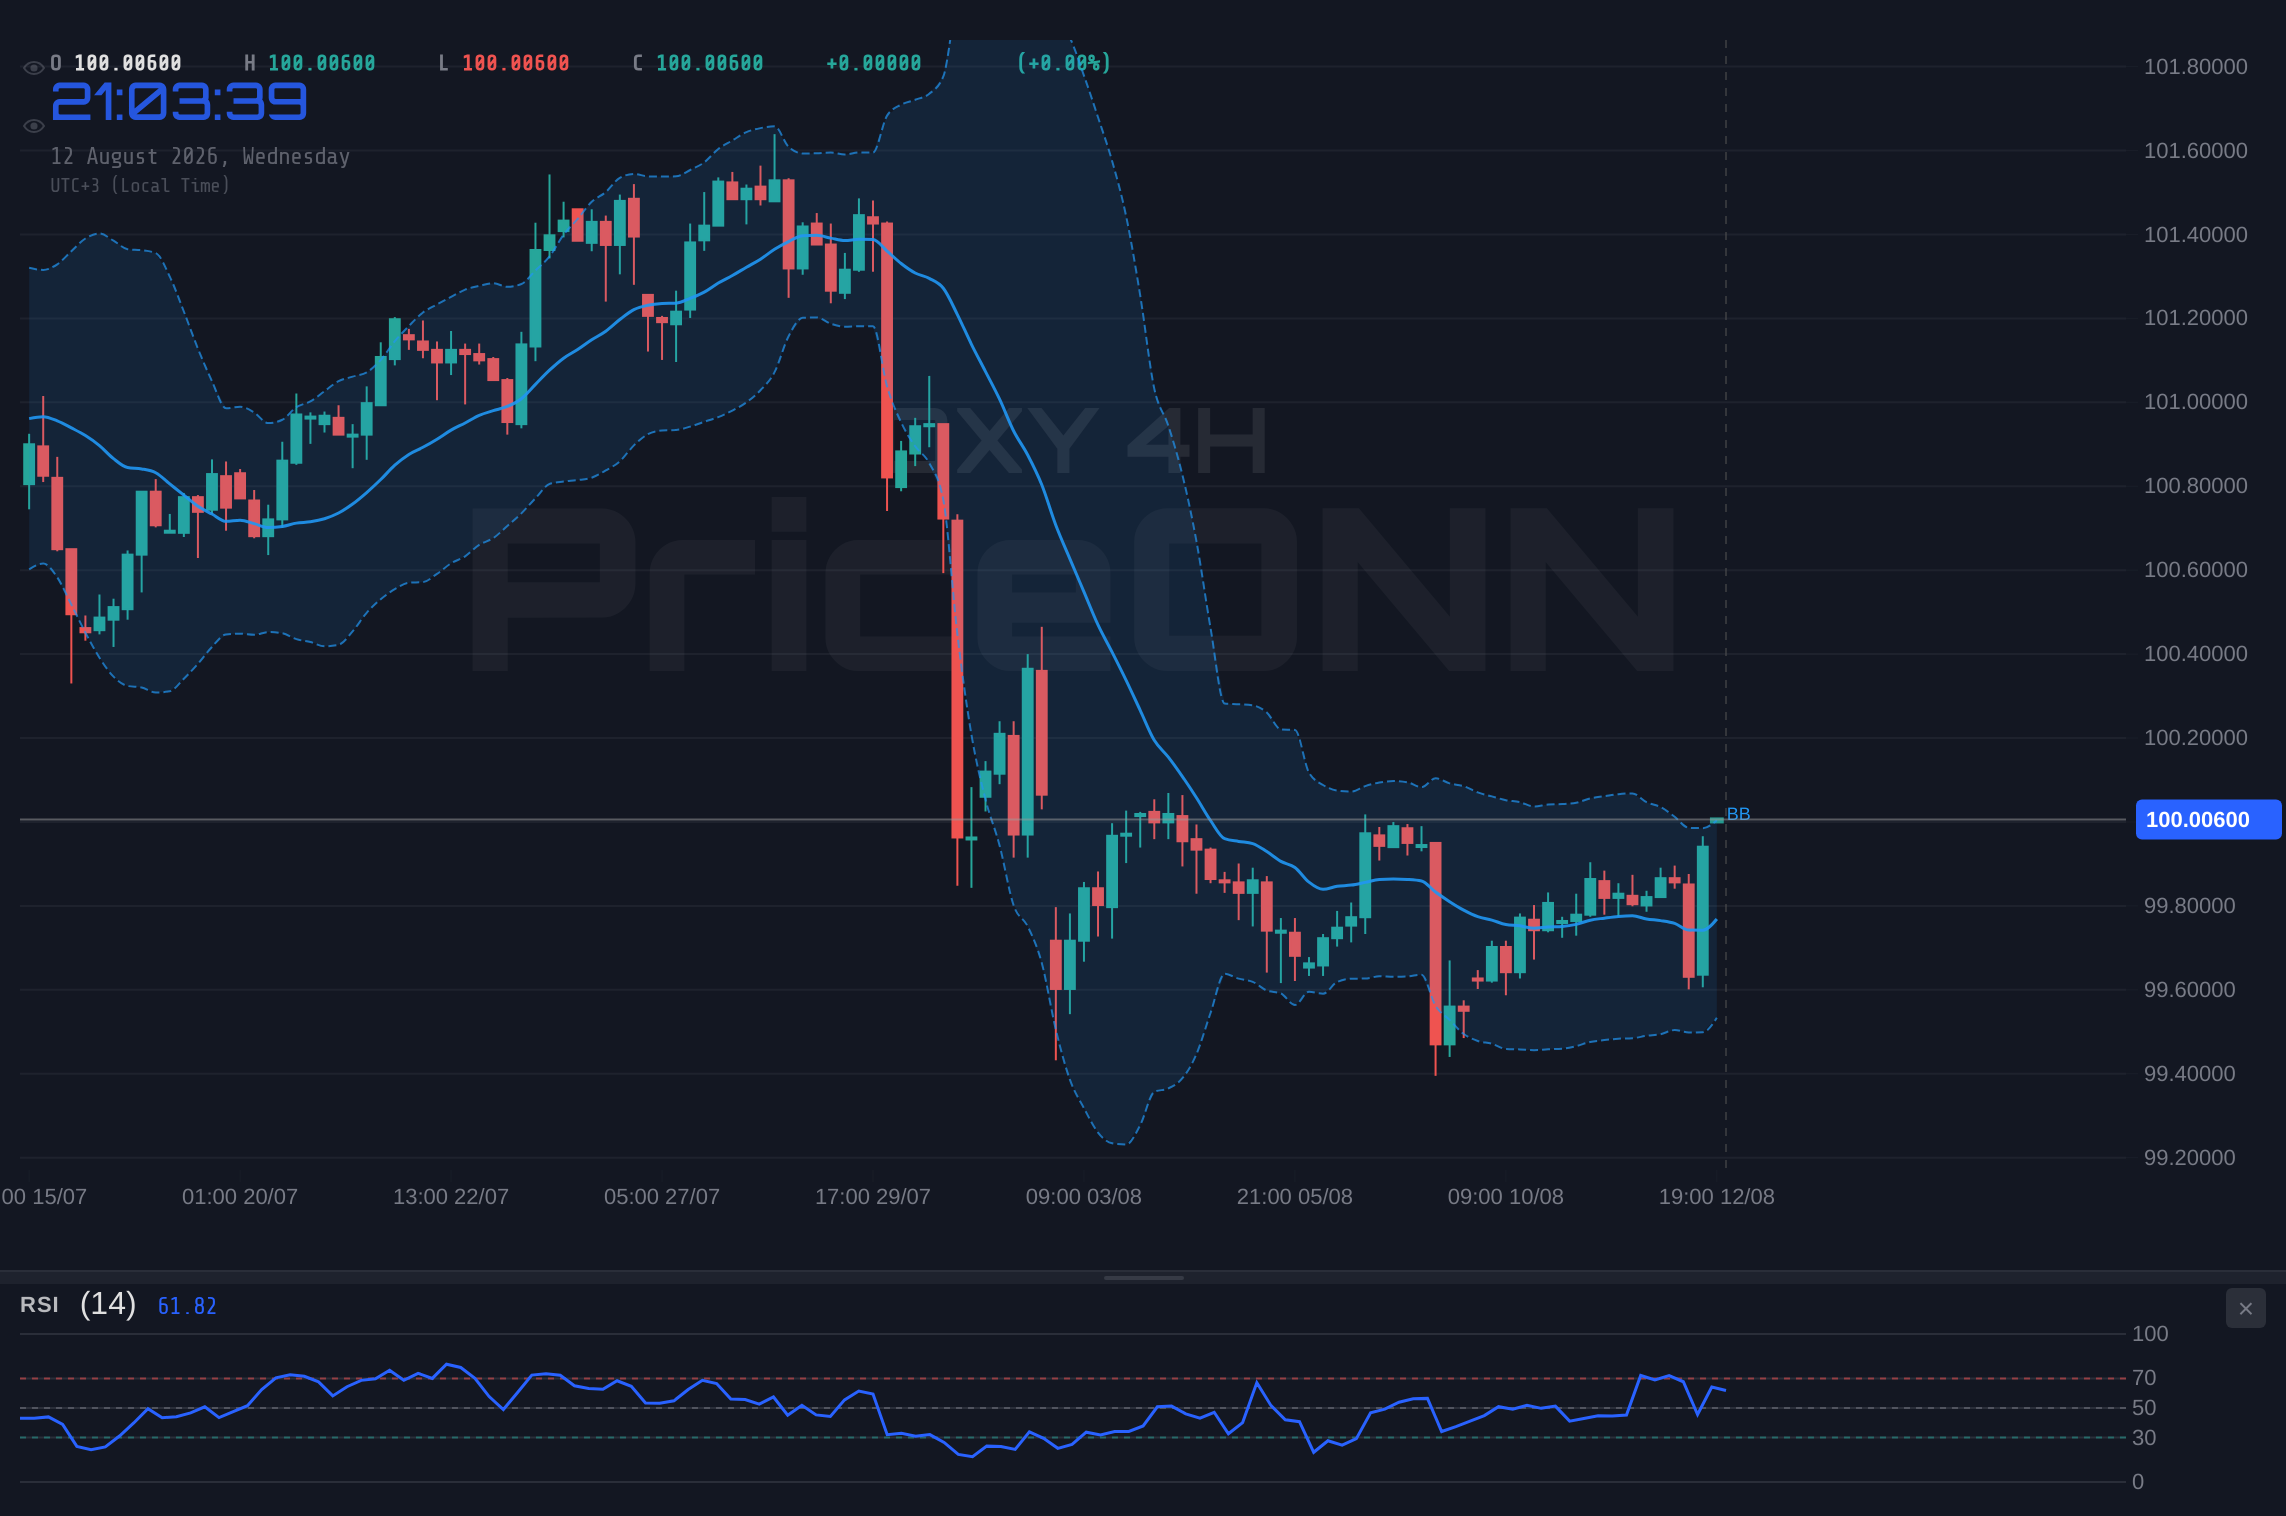
The implications of this persistent weakness in the DXY are far-reaching, particularly for global markets. A stronger dollar typically exerts downward pressure on commodities like gold, as they become more expensive for holders of other currencies. Conversely, a weaker dollar can boost commodity prices and support riskier assets. The current dynamic, where gold is showing resilience and even pushing towards multi-month highs around $4,396.99, suggests that market participants are not betting on a strong dollar resurgence in the immediate term. This inverse correlation is a key theme to watch as we navigate the coming trading sessions.
Inflation Data: A Double-Edged Sword
Recent economic data, particularly concerning inflation, has played a significant role in shaping the DXY's trajectory. The latest report indicated that inflationary pressures remain somewhat subdued, with the Consumer Price Index (CPI) rising by 0.1% month-on-month in July, aligning with expectations. While this might seem like good news for the Federal Reserve, aiming to bring inflation under control without triggering a recession, it also removes a key catalyst for aggressive monetary tightening. Markets have been pricing in a certain degree of hawkishness from the Fed, and any data that suggests inflation is cooling faster than anticipated can dampen expectations for further rate hikes.
This is precisely where the narrative becomes complex for the DXY. On one hand, subdued inflation might lead to expectations of a Fed on hold, which could theoretically weaken the dollar if other central banks are perceived to be more hawkish. On the other hand, a strong dollar can also be a function of global risk aversion, where investors flock to the perceived safety of the U.S. dollar. However, recent market behavior, particularly the strength observed in gold despite dollar movements, suggests that risk appetite might be slowly improving, or at least not deteriorating significantly. This environment doesn't inherently favor a strong dollar rally.
The divergence between the dollar's performance and that of gold is particularly noteworthy. Gold prices have been edging higher, nearing two-month highs around $4,396.99. This resilience in gold, even as the DXY hovers around $100.03, suggests that market participants are betting that oil prices, which have seen some rebound, won't necessarily force the Fed back into aggressive tightening. The upcoming CPI report is seen as the first major check on this narrative. If inflation proves stickier than expected, it could reignite hawkish Fed expectations and potentially support the dollar. However, if the data confirms the cooling trend, it could further undermine dollar strength.
Technical Breakdown: What the Charts Are Saying
Delving into the technicals provides a clearer picture of the DXY's current predicament. On the 1-hour chart, the trend is classified as neutral with a power of 50%, reflecting the intraday choppiness. Key support levels are identified at 99.86, 99.77, and 99.72, while resistance stands at 100.00, 100.05, and 100.14. The RSI at 48.26 shows a slight bearish inclination, and the MACD indicates negative momentum. Stochastic oscillator readings also lean towards a bearish signal (%K
However, the 4-hour chart presents a stronger bearish signal. The trend is identified as bullish with a power of 94%, which might seem contradictory given the dollar's recent struggles. Yet, the indicators here paint a concerning picture for the bulls. The RSI at 60.92 is in neutral territory but trending down, suggesting potential for a reversal. MACD shows negative momentum, and Stochastic is in bullish territory (%K > %D), but this can sometimes precede a downturn in overbought conditions. The ADX at 48.08 strongly indicates a powerful uptrend, which is a significant outlier given the daily chart's bearish leanings. This conflicting signal between timeframes is crucial; the 4-hour chart might be reflecting a delayed reaction or a temporary bounce within a larger downtrend.
The daily timeframe, arguably the most significant for long-term trend analysis, confirms the bearish outlook. The trend is neutral with 50% power, but the underlying indicators are predominantly bearish. The RSI at 67.13 is approaching overbought territory, a sign that the recent upward push might be unsustainable and ripe for a pullback. The MACD is positive, but its histogram suggests momentum is slowing. The Stochastic oscillator is in overbought territory (K=90.76, D=82.89), a classic warning sign of a potential reversal. The ADX at 30.09, while indicating a strong trend, doesn't specify direction, but when combined with other indicators, it suggests the current trend, whatever its direction, is robust. The general signal for the daily timeframe is 'BUY', but this is heavily influenced by the Stochastic's overbought condition and the RSI's upward trajectory, which could easily reverse.
Correlations and Market Sentiment
Understanding the DXY's movement requires looking beyond its own charts. Its correlation with other major markets provides vital context. Typically, a strengthening DXY leads to pressure on assets like gold and major currency pairs such as EURUSD and GBPUSD. Conversely, a weaker DXY often supports these assets. Currently, with DXY trading around $100.03, we observe a fascinating divergence. Gold, a traditional safe-haven asset, has shown remarkable strength, pushing towards $4,396.99. This suggests that investors are either less concerned about the dollar's immediate prospects or are actively seeking alternative stores of value, perhaps due to geopolitical risks or a belief that the Fed's tightening cycle is nearing its end.
The performance of major currency pairs also offers clues. EURUSD is trading at 1.15208, showing a slight bearish bias on the 1-hour chart but a stronger bullish trend on the daily. GBPUSD, at 1.34923, also displays mixed signals across timeframes, though its daily chart shows a bullish trend. The fact that these pairs are not collapsing against the dollar, despite the dollar's key level test, implies that the bearish sentiment for the DXY is not universally shared across all risk assets. This could be attributed to the fact that the dollar remains a benchmark currency, and its weakness might not be a sign of outright risk-on sentiment, but rather a recalibration of expectations regarding Fed policy relative to other central banks.
Equities, represented by the S&P 500 and Nasdaq 100, are showing strength, with significant daily gains. The S&P 500 is up 0.74% at 6572.87, and the Nasdaq 100 is up 0.89% at 29799.29. This risk-on sentiment in equities typically runs counter to a strong dollar narrative. If the market is indeed favoring riskier assets like stocks, it implies a reduced demand for safe-haven assets like the dollar. This further reinforces the bearish case for the DXY, suggesting that the current price action around $100.03 might be a precursor to a more significant downtrend, especially if economic data continues to signal cooling inflation and a less aggressive Fed.
Scenario Analysis: What's Next for the DXY?
Bearish Scenario: Dollar's Descent Continues
65% ProbabilityNeutral Scenario: Consolidation Around $100.00
25% ProbabilityBullish Scenario: A Rebound Attempt
10% ProbabilityThe immediate future for the DXY hinges on its ability to hold or break key levels. The bearish scenario, carrying a 65% probability, hinges on a sustained close below the critical support at $99.72. If this level gives way, we could see a swift move towards the 4-hour support levels at $99.53 and $99.43. This would align with the bearish signals from the daily RSI and MACD, and confirm the strong downtrend indicated by the daily ADX. Invalidation for this scenario would be a decisive break and hold above the $100.14 resistance.
A neutral scenario, with a 25% probability, anticipates further consolidation around the $100.00 psychological level. This would involve price action remaining within the established range, likely between $99.72 and $100.14. Such a scenario would indicate indecision in the market, possibly awaiting clearer signals from upcoming economic data or central bank commentary. The bullish scenario, currently carrying only a 10% probability, would require a strong catalyst to push the DXY above the $100.14 resistance. A close above this level could open the door for a move towards $100.50 and potentially higher, but this appears less likely given the current technical and fundamental backdrop.
Navigating the Uncertainty: What to Watch Next
The DXY's struggle at $100.03 is more than just a technical pattern; it reflects a broader shift in market sentiment and expectations surrounding Fed policy. As inflation data continues to moderate, the pressure on the Federal Reserve to maintain a hawkish stance diminishes. This is a critical factor that could continue to weigh on the dollar. Investors will be closely watching upcoming economic releases, particularly any further indicators on inflation and employment, to gauge the Fed's next move. Any signs of persistent inflation could reignite dollar strength, while continued cooling could cement the bearish outlook.
Geopolitical developments also remain a significant wildcard. While the DXY often acts as a safe haven, the current market environment sees other assets like gold also benefiting from safe-haven demand. This suggests that the dollar's traditional role might be slightly diluted, or that market participants are diversifying their safe-haven strategies. Events in the Middle East, or any unexpected global political instability, could quickly shift market sentiment and impact the DXY's trajectory. For now, the focus remains on the interplay between monetary policy expectations and the ongoing performance of major global economies.
Frequently Asked Questions: DXY Analysis
What happens if DXY breaks below the $99.72 support level?
A break below $99.72 would likely trigger further selling pressure, potentially pushing the DXY towards the $99.53 and $99.43 levels on the 4-hour chart. This would align with the bearish signals from the daily RSI and MACD indicators, confirming a continuation of the downtrend.
Is the RSI at 44.32 a sell signal for DXY right now?
An RSI of 44.32 on the daily chart is not an immediate sell signal in itself, as it's in neutral territory. However, its downward trajectory suggests waning bullish momentum, making it a cautionary indicator that supports a bearish outlook, especially when viewed alongside other bearish signals.
How will subdued July CPI data affect DXY this week?
Subdued July CPI data, which met expectations, reduces the immediate pressure on the Fed to hike rates aggressively. This could continue to weigh on the DXY, as it dampens expectations for hawkish monetary policy and potentially supports a bearish outlook for the dollar.
Should traders consider buying DXY at current levels near $100.03?
Given the technical indicators and the prevailing bearish sentiment, buying DXY at $100.03 carries significant risk. The bearish scenario has a higher probability, and a break below $99.72 could lead to substantial losses. Patience and waiting for a clearer bullish confirmation, such as a sustained break above $100.14, would be a more prudent approach.
The market is at a crucial inflection point for the Dollar Index. While the $100.03 level represents a significant psychological barrier, the confluence of technical indicators and macroeconomic data points towards potential further downside. Traders and investors should remain vigilant, paying close attention to upcoming economic releases and the DXY's reaction to key support and resistance levels. The narrative of cooling inflation and potentially a Fed on hold appears to be gaining traction, which, if sustained, could lead to a continued weakening of the dollar. Patience and disciplined risk management will be paramount in navigating this complex market environment.
| Indicator | Value | Signal | Interpretation |
|---|---|---|---|
| RSI (14) | 44.32 | Neutral | Waning momentum, potential for downside |
| MACD Histogram | -0.03 | Bearish | Negative momentum confirmed |
| Stochastic (%K/%D) | 34.62 / 19.75 | Bullish Signal (but on downtrend) | Conflicting signal, caution needed |
| ADX | 28.84 | Strong Trend | Confirms trend strength, direction dependent on other indicators |
| Bollinger Bands | Mid Band | Below Mid Band | Bearish pressure evident |
Track markets in real-time
AI-powered analysis, technical indicators and real-time price data.
Join Our Telegram Channel
Breaking market news, AI analysis and trading signals instantly.
Join Channel