
XAUUSD Tests Key $4,416 Resistance as Bulls Eye Further Gains
Gold is trading at $4,402.36, nearing the $4,416 resistance. Technical indicators show strong bullish momentum, but traders watch for a potential breakout or pullback.
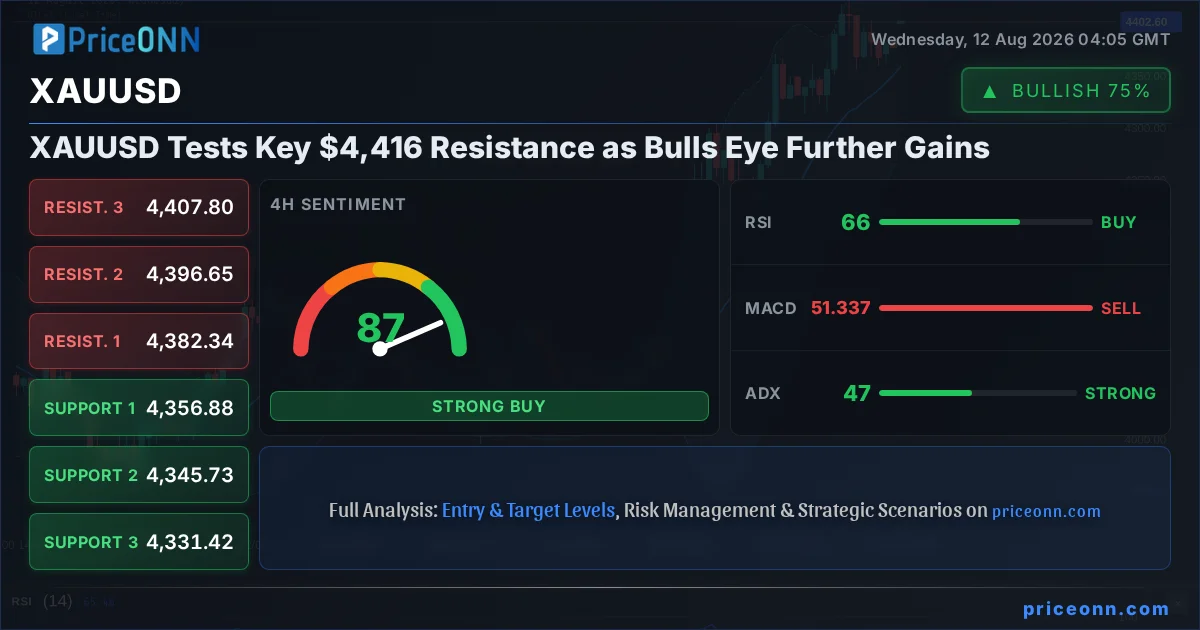
The age-old battle between bulls and bears is intensifying around the $4,402.36 mark for gold (XAUUSD), with the precious metal currently testing critical resistance levels. This pivotal moment, occurring amidst a backdrop of shifting macroeconomic sentiment and persistent geopolitical undercurrents, presents a fascinating case study for traders seeking to decipher the next significant move. As gold approaches the $4,416.53 resistance, the question isn't just whether it will break through, but what forces are truly driving this ascent and whether the momentum can be sustained. This analysis delves into the intricate technical signals and the broader market context to understand the potential trajectories for gold in the immediate future.
- RSI at 67.39 signals a strong upward trend, nearing overbought territory but not yet indicating a reversal.
- Critical resistance sits at $4,416.53, a level gold has approached with significant bullish momentum.
- The ADX at 30.05 on the daily chart indicates a strong trend, supporting the current bullish sentiment.
- Correlation with a strengthening DXY at 99.9 suggests potential headwinds for gold if the dollar continues its ascent.
The current price action for XAUUSD, hovering around $4,402.36, paints a picture of determined bullish conviction. On the 1-hour chart, the trend is unequivocally bullish with a power score of 90%, supported by a positive MACD momentum and Stochastic oscillator flashing a strong buy signal (%K > %D). This short-term strength is further corroborated by the 4-hour timeframe, which also shows a dominant bullish trend (93% power) despite some mixed signals from Stochastic and MACD momentum. The daily chart, however, introduces a layer of nuance. While the overall trend is classified as neutral (50% power), the ADX at 30.05 indicates a strong trend environment, and the RSI at 67.39, though in the neutral zone, clearly leans towards further upside. This confluence of indicators suggests that while short-to-medium term sentiment is strongly bullish, the longer-term picture requires careful observation, particularly around the $4,416.53 resistance.
The narrative for gold's recent strength is multifaceted, drawing support from a combination of technical factors and evolving market sentiment. Reports from August 11th highlighted gold rallying towards a two-month high, reaching the $4,400 per ounce mark, driven by growing safe-haven demand. This demand is often amplified during periods of geopolitical uncertainty, as seen with the stalled U.S.-Iran deal mentioned in recent news, which can add an undercurrent of risk premium to precious metals. Furthermore, expectations of central bank policy shifts, particularly regarding interest rates, play a crucial role. A softer labor market, as reported on August 10th, might reinforce the Federal Reserve's reluctance to hike rates further, or even signal potential cuts down the line. Such a scenario typically weakens the dollar, making dollar-denominated assets like gold more attractive to international buyers. The interplay between these factors creates a fertile ground for bullish sentiment to take root.
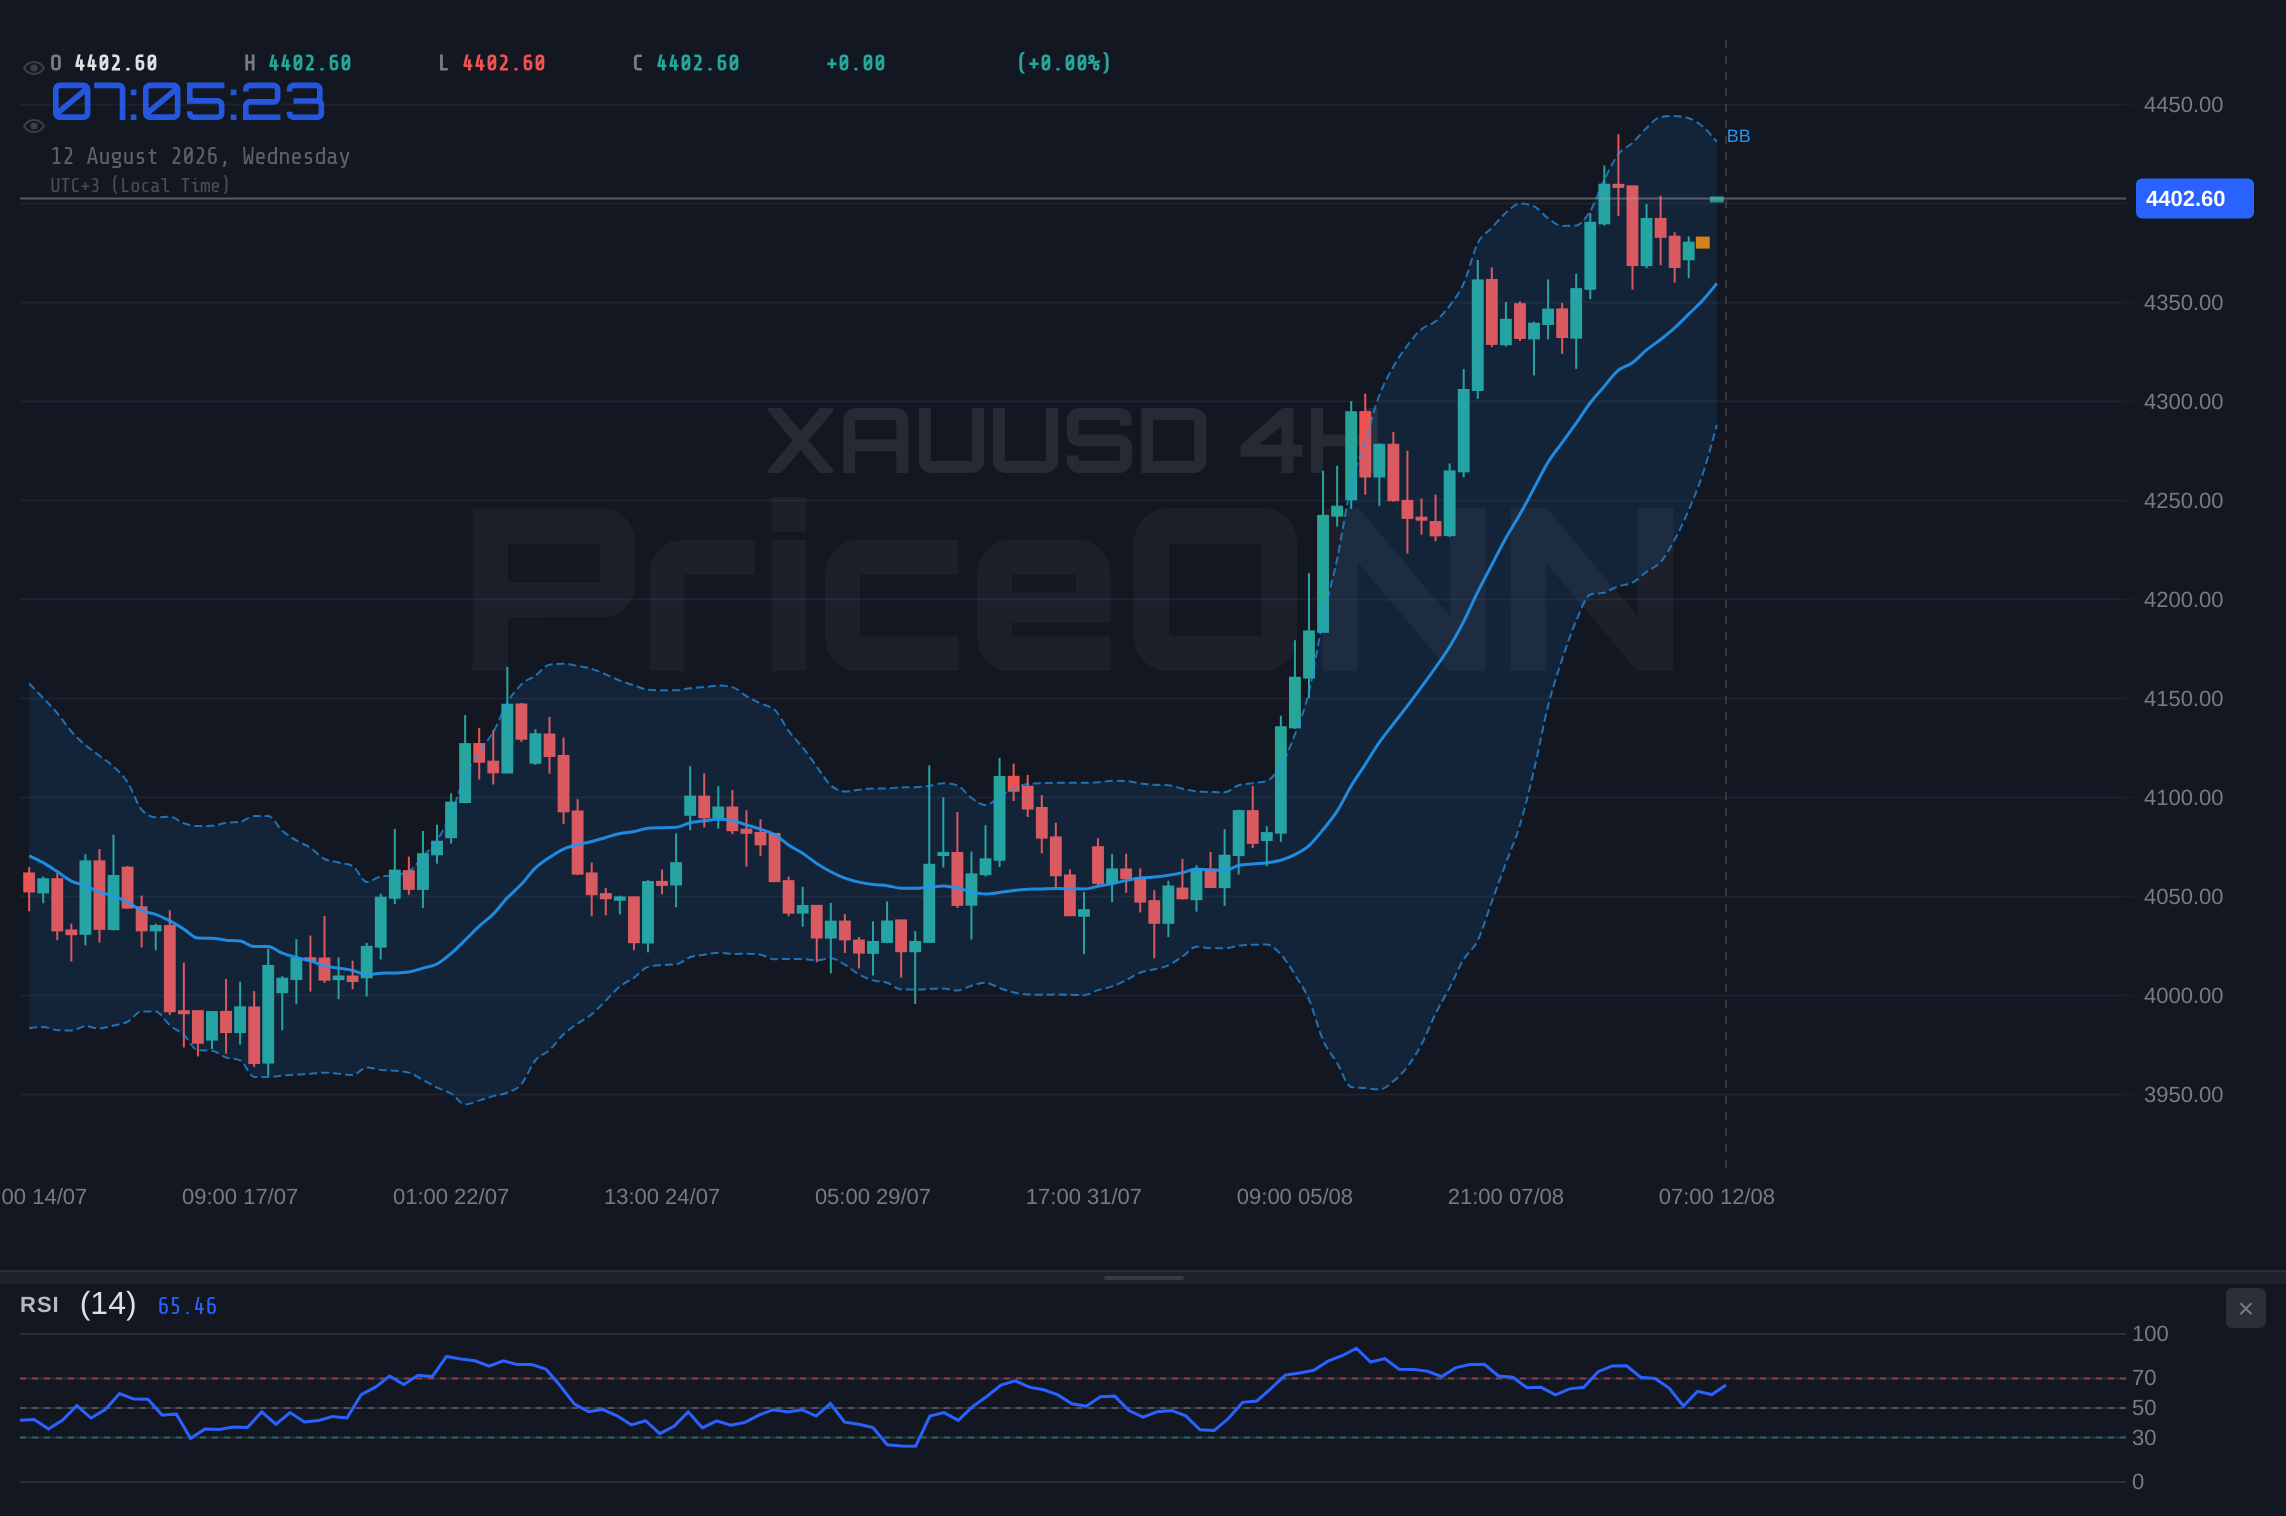
Let's dissect the bull case for XAUUSD more granularly. The 1-hour timeframe presents a near-unanimous buy signal, with an 8:0:0 (Buy:Sell:Neutral) ratio. The RSI at 60.42 is comfortably in the neutral zone, suggesting room for further upside before hitting overbought conditions. The MACD is positive, and the Bollinger Bands are showing an upward bias, trading above the middle band. The Stochastic oscillator, with K at 89.33 and D at 51.21, strongly indicates a buy, with %K significantly outperforming %D. Even the ADX, typically a measure of trend strength, is in a supportive, albeit weak, trend environment at 19.07. This paints a picture of upward momentum building on the shorter timeframes.
Stepping back to the 4-hour chart, the bullish sentiment remains robust, reflected in a 6:2:0 buy-sell ratio. The ADX at 47.43 signifies a strong uptrend, a key confirmation for sustained moves. While the Stochastic %K (57.37) is below %D (65.1), suggesting a potential short-term pause or pullback, the RSI at 66.13 still has room to climb. The MACD shows negative momentum, which might seem contradictory, but in a strong uptrend, this can sometimes represent consolidation within the larger move rather than a reversal signal. The daily chart continues this theme: a 6:2:0 buy-sell ratio with an ADX of 30.05 confirming a strong trend. The Stochastic is in overbought territory (K: 91.61, D: 83.03), which is a signal to watch for potential consolidation or a minor pullback, but the RSI at 67.39 is still well within the bounds of a healthy uptrend.
However, no market analysis is complete without acknowledging the counterarguments and the potential for a bearish scenario. The most immediate hurdle for gold is the resistance level at $4,418.92 on the 1-hour chart and $4,416.53 on the daily. A failure to decisively break and hold above these levels could trigger profit-taking. The DXY (Dollar Index) is currently at 99.9 and showing a bullish trend on the 1-hour and 4-hour charts, despite a bearish signal on the daily timeframe. A sustained rise in the dollar typically exerts downward pressure on gold, as it increases the cost of the metal for holders of other currencies. Furthermore, if upcoming economic data, such as the CPI report mentioned in the news, surprises to the upside, it could rekindle inflation fears and prompt a hawkish shift in central bank rhetoric, which would likely strengthen the dollar and weigh on gold.
The conflicting signals within the technical indicators also warrant attention. On the 4-hour chart, the MACD is showing negative momentum, and the Stochastic is in a bearish configuration (%K
Considering the interplay of bullish momentum, key resistance levels, and potential macroeconomic shifts, we can outline three distinct scenarios. The bullish scenario hinges on a decisive breakout above the $4,416.53 resistance. This would likely be fueled by continued dovish sentiment from central banks, persistent geopolitical risks, or a weaker-than-expected CPI report. Such a move could target the next resistance at $4,426.62 and potentially extend towards $4,439.08. The invalidation for this scenario would be a close back below the $4,400 psychological level, or more critically, below the support at $4,398.76. This would suggest the breakout attempt failed, and a move lower is probable.
Conversely, the bearish scenario anticipates a failure at the current resistance. If gold cannot sustain its push above $4,416.53, profit-taking could accelerate, especially if the DXY strengthens or inflation data comes in hotter than expected. This could lead to a retest of the $4,400 mark, followed by a potential slide towards the first daily support at $4,338.04 and then $4,308.07. The trigger for this scenario would be a clear rejection from the $4,416.53-$4,418.92 resistance zone, coupled with a break below the 1-hour support at $4,398.76. The invalidation of this bearish thesis would be a strong daily close above $4,416.53, signaling that the resistance has indeed given way.
The neutral or consolidation scenario acknowledges the current strength but also the potential for a pause. Gold might consolidate in a range between the current price and the $4,416.53 resistance, or perhaps pull back slightly to test the $4,398.76 support before making its next move. This scenario is plausible if economic data releases are mixed or if market participants adopt a wait-and-see approach ahead of key events. In this case, price action might be choppy, with intraday volatility but a lack of clear directional conviction on the daily timeframe. The Stochastic oscillator's overbought condition on the daily chart lends credence to this possibility, suggesting a period of digestion before the next major trend develops.
Navigating the Currents: A Technical Deep Dive
Delving deeper into the technical landscape, the confluence of indicators on the daily chart presents a compelling picture. The ADX, a measure of trend strength, stands at 30.05. While this indicates a strong trend, it's crucial to remember that ADX alone doesn't dictate direction. However, when combined with a rising RSI (currently 67.39) and positive MACD momentum, it reinforces the prevailing bullish sentiment. The Stochastic oscillator, however, is flashing a clear overbought signal at 91.61 for %K and 83.03 for %D. This suggests that gold may be due for a pause or a minor pullback, as buyers may be becoming exhausted at these elevated levels. Historically, such overbought conditions on the daily Stochastic have often preceded periods of consolidation or minor corrections, typically lasting a few trading sessions before the primary trend resumes, provided the underlying support levels hold.
The Bollinger Bands on the daily chart are also trading above the middle band, indicating an upward bias. The price action has been hugging the upper band, a sign of strong bullish momentum. However, this can also signal that the market is becoming extended. A close back below the middle band, which currently sits around the $4,338 mark, would be a significant bearish signal, suggesting a potential reversal or a deeper correction. The 1-hour chart presents a slightly different story, with the Stochastic at 89.33 and RSI at 60.42, still showing room for upside but also nearing zones where caution is advised. The MACD is positive, and the Bollinger Bands are above the middle band, reinforcing the short-term bullish trend. The ADX at 19.07 on this timeframe, however, points to a weaker trend, suggesting that the intraday moves might be more susceptible to reversals or choppy price action.
The correlation with the DXY is a critical factor to monitor. With the Dollar Index at 99.9 and showing strength on the shorter timeframes, there's an inherent tension. A rising dollar typically makes gold more expensive for foreign buyers, potentially dampening demand. However, the current market narrative might be decoupling gold from its traditional inverse correlation with the dollar, especially if geopolitical risks or inflation concerns are the primary drivers. If the DXY continues its ascent, breaking above the 100.00 psychological level, it would likely pose a significant headwind for gold. Conversely, any sign of weakness in the dollar, perhaps stemming from softer economic data or a shift in Fed expectations, could provide a further boost to gold prices, especially as they approach the $4,416.53 resistance.
The recent news flow provides context for this dynamic. Reports from August 11th indicated that gold reached a two-month high partly due to stalled U.S.-Iran deal negotiations, highlighting the impact of geopolitical tensions. Simultaneously, the August 10th report on the labor market suggested a cooling economy, which could influence Federal Reserve policy. If this leads to a perceived pause or pivot in monetary policy, it would typically weaken the dollar and support gold. However, the August 11th report from Saxo Bank noted that bullion has to hold $4,360 to keep the rally alive, with headwinds building from oil, yields, and the dollar. This suggests that while bullish factors are present, the path forward is not without its obstacles, and the $4,416.53 level is a significant test.
Watch the volume accompanying price action around the $4,416.53 resistance. A decisive breakout on increasing volume would validate the bullish move, whereas a rejection on low volume might signal a false breakout and a potential reversal.
Looking at the broader market context, the performance of equities like the S&P 500 and Nasdaq provides further clues. Currently, the S&P 500 is showing a bullish trend on the 1-hour and 4-hour charts but a bearish trend on the daily, indicating mixed sentiment. The Nasdaq 100 exhibits neutral trends across all timeframes. This divergence suggests that the risk appetite in the broader market is not strongly aligned, which can sometimes lead to increased volatility in assets like gold as traders shift between risk-on and risk-off positions. If major equity indices begin to show sustained weakness, it could further bolster gold's safe-haven appeal. Conversely, a strong rally in equities might draw capital away from precious metals.
The energy market, particularly Brent crude oil prices at $88.32, also plays a role. Rising oil prices can signal increasing inflation expectations, which historically benefits gold as an inflation hedge. The bullish trend in Brent crude on the 1-hour and 4-hour charts, with ADX readings suggesting strong trends, could be providing a subtle tailwind for gold. However, the daily ADX for Brent is at 19.36, indicating a weaker trend on that timeframe, suggesting that the inflationary impulse from oil might not be as strong or sustained as it appears on shorter intervals. This adds another layer of complexity to the bullish case for gold, as the inflationary hedge narrative is not unequivocally supported by all timeframes.
The Bull Case: $4,416.53 as a Launchpad
The primary argument for a continued rally in gold rests on the strong technical signals across multiple timeframes and the supportive macroeconomic backdrop. The bullish trend strength indicated by the ADX on the daily (30.05) and 4-hour (47.43) charts is significant. Coupled with RSI readings that, while approaching overbought territory, still show room for ascent, and positive MACD momentum on the daily and 1-hour charts, the technical foundation for further upside appears solid. The fact that gold has rallied to a two-month high and is pushing towards $4,416.53 suggests strong buying interest. If this level is breached decisively, with confirmation from increasing volume and sustained price action above it, the next targets at $4,426.62 and $4,439.08 become highly probable. This scenario is further bolstered by the potential for continued geopolitical tensions and a favorable monetary policy environment (i.e., low interest rates or potential cuts) which would weaken the dollar and enhance gold's appeal as a safe-haven asset.
The Bear Case: Resistance Holds Firm
The counter-argument emphasizes the psychological and technical significance of the resistance zone around $4,416.53-$4,418.92. The overbought Stochastic oscillator on the daily chart is a primary warning sign, suggesting that the market is extended and vulnerable to a correction. If gold fails to break through this resistance, a wave of profit-taking could emerge. This could be exacerbated by a strengthening DXY, perhaps driven by unexpectedly strong U.S. economic data or hawkish commentary from Fed officials. A break below the immediate support at $4,398.76 would then become the trigger for a bearish move, potentially targeting the $4,386.30 and $4,378.60 levels. The conflicting MACD momentum on the 4-hour chart also lends weight to the possibility of a pullback, indicating that the upward force may be weakening at these higher prices.
The Verdict: Cautious Optimism Prevails
Weighing the evidence, the bull case appears to have a slight edge, primarily due to the sustained strength observed across multiple timeframes and the prevailing macroeconomic narrative favoring gold. However, the proximity to significant resistance and the overbought signals on the daily Stochastic warrant a degree of caution. A decisive breakout above $4,416.53, confirmed by volume and sustained trading, would strongly validate the bullish outlook. Until then, expect potential consolidation or minor pullbacks. The key for traders is to manage risk diligently, waiting for clear confirmation of a breakout or a well-defined pullback to favorable entry levels. The market is offering opportunities, but patience and discipline will be crucial in navigating the coming price action.
Trade Scenarios and Risk Management
Bearish Rejection Scenario
40% ProbabilityConsolidation/Range-Bound Scenario
35% ProbabilityBullish Breakout Scenario
25% ProbabilityFrequently Asked Questions: XAUUSD Analysis
What happens if XAUUSD fails to break above the $4,416.53 resistance?
If gold is rejected at the $4,416.53 resistance, a pullback is likely. This could see prices retest the $4,398.76 support level. A break below this level, potentially triggered by a stronger dollar or less dovish Fed expectations, could lead to further downside towards $4,386.30.
Should I buy XAUUSD at current levels around $4,402.36 given the RSI at 67.39?
Buying at current levels carries risk due to the proximity to resistance and the RSI nearing overbought territory on the daily chart. A more prudent approach might be to wait for a confirmed breakout above $4,416.53 with strong volume, or for a pullback to a more favorable support level like $4,398.76, offering a better risk-reward ratio.
Is the daily Stochastic at 91.61 a sell signal for XAUUSD right now?
The Stochastic oscillator being in the overbought zone (K: 91.61, D: 83.03) suggests that the current rally may be extended and vulnerable to consolidation or a correction. While it's not a direct sell signal on its own, it indicates that upside potential might be limited in the short term, and traders should be cautious about chasing further gains without confirmation.
How will the upcoming CPI data potentially affect XAUUSD around the $4,416 resistance?
If the CPI data comes in hotter than expected, it could rekindle inflation concerns and strengthen the dollar, potentially causing gold to pull back from the $4,416.53 resistance. Conversely, softer CPI data might reinforce expectations of Fed rate cuts, weakening the dollar and providing the catalyst for gold to break through this key resistance level.
Track markets in real-time
AI-powered analysis, technical indicators and real-time price data.
Join Our Telegram Channel
Breaking market news, AI analysis and trading signals instantly.
Join Channel