

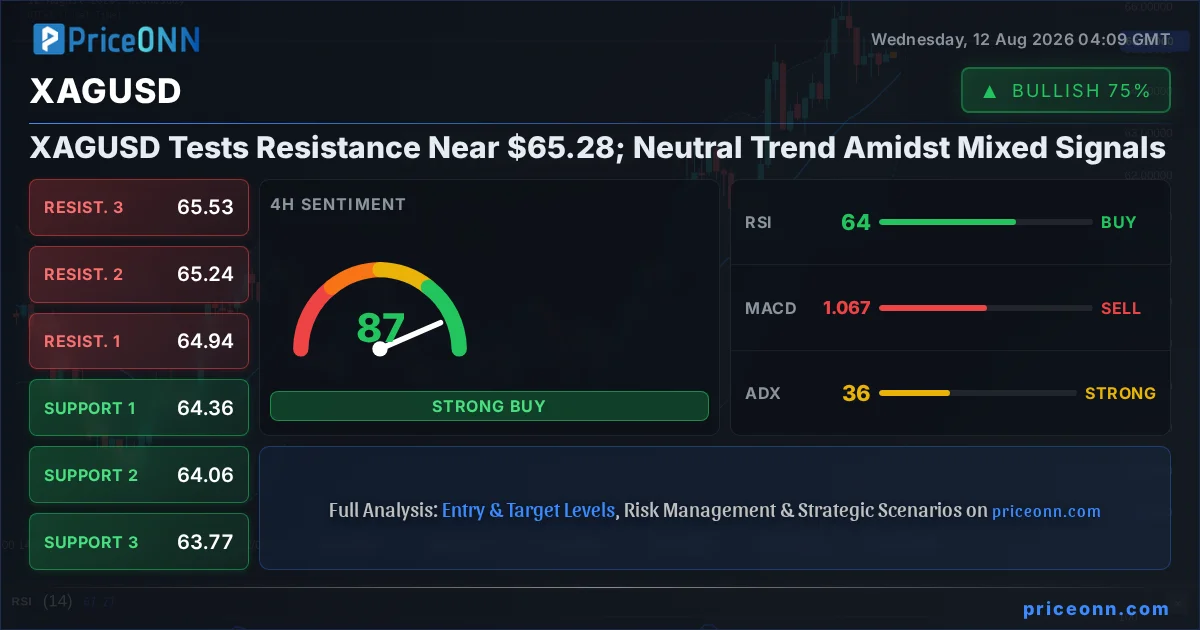
Silver, or XAGUSD, is currently locked in a tense tug-of-war, trading precisely at $65.28. This critical juncture highlights a market caught between conflicting technical signals and a neutral daily trend, leaving traders to dissect the nuances of its current trajectory. The question on everyone's mind: is this a pause before a significant move, or simply the calm before a more prolonged period of sideways action?
- RSI at 64.1 on the 4H chart signals a neutral-to-bullish momentum, yet Stochastic shows a potential pullback signal in the overbought zone.
- Critical support for XAGUSD is holding at $64.36, while resistance looms just above at $65.61, a narrow range defining the immediate trading landscape.
- The ADX at 35.82 on the 4H timeframe indicates a strong trend is in play, but conflicting signals from other indicators suggest this trend's direction is currently undecided.
- Broader market sentiment, influenced by DXY movements and upcoming economic data like CPI, will likely dictate whether silver can break its current neutral stance.
The Bullish Case: Silver's Ascent Towards $66
Momentum Indicators Hint at Upside Potential
On the shorter timeframes, the bullish narrative for XAGUSD gains traction. The 1-hour chart paints a picture of rising momentum, with the trend strength sitting at a robust 90%. Here, the RSI hovers at 58.58, comfortably in neutral territory but with a clear upward inclination, suggesting room for further gains. The MACD is also showing positive momentum, with its signal line below the MACD line, a classic sign of increasing buying pressure. Furthermore, the Stochastic oscillator on the 1-hour chart is particularly compelling, with the %K line at 82.28 and the %D line at 62.5. This significant divergence, where %K is well above %D, strongly indicates a bullish signal, pointing towards potential upward movement. Even the ADX, typically a measure of trend strength rather than direction, sits at 19.75, suggesting that while the trend isn't overwhelmingly strong yet, the underlying conditions are not actively resisting upward price action.
The 4-hour chart, while offering a slightly more cautious view, still leans towards bullish potential. The trend strength here is even higher at 93%, indicating a dominant upward bias over this timeframe. The RSI at 64.1 is in the upper neutral zone, reinforcing the idea that buyers are actively participating. The Stochastic oscillator, despite being in the overbought territory (K=47.65, D=58.76), shows %K below %D, which in isolation might suggest a pullback, but in the context of a strong trend, it could also be a precursor to a continuation phase after a minor consolidation. The ADX here is notably higher at 47.42, confirming a strong uptrend, which is a key factor for any sustained move higher. The overall signal across these shorter-to-medium term charts is a strong 'BUY' recommendation, with 6 buys, 2 sells, and 0 neutrals on the 4H, and a clean 8 buys on the 1H.
Daily Chart Affirmation and Macro Tailwinds
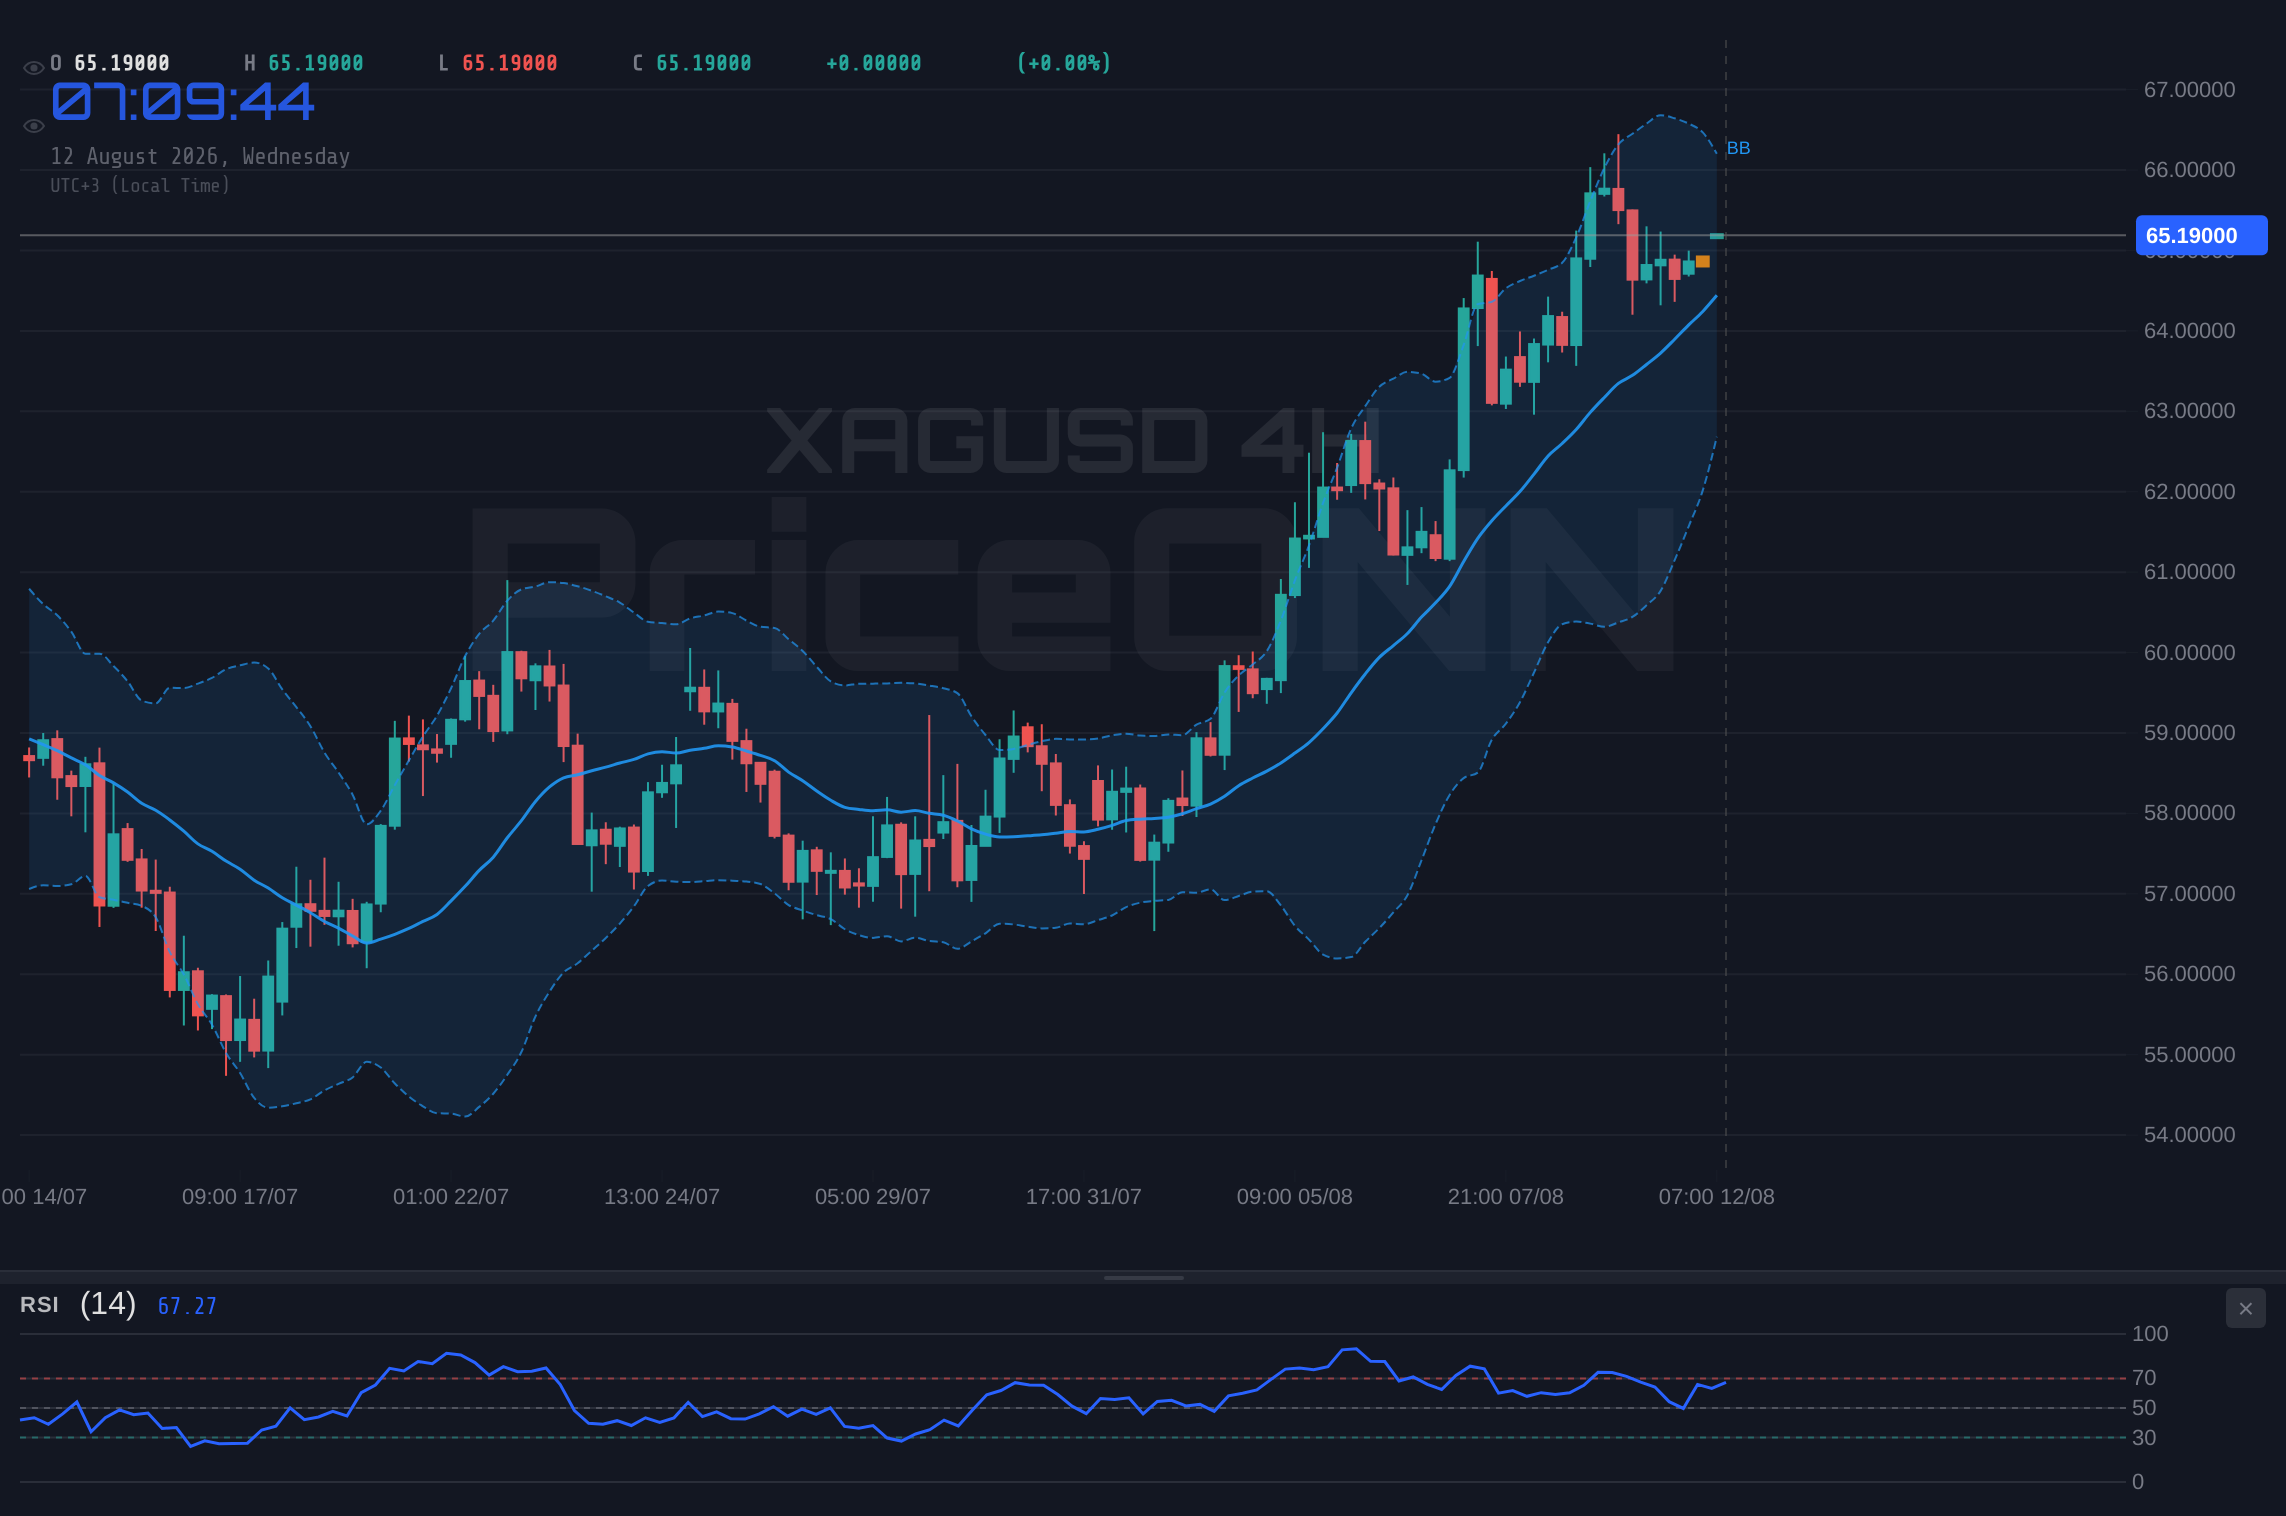
Extending the bullish outlook to the daily timeframe, the picture becomes more nuanced but still offers support for upside. While the trend is classified as neutral (50% strength), the underlying indicators are largely constructive. The RSI at 67.35 is approaching overbought territory but hasn't breached it, leaving room for price appreciation. Crucially, the MACD is showing positive momentum, with the MACD line positioned above its signal line, a signal that has historically preceded further rallies. The Bollinger Bands are also supportive, with price trading above the middle band, indicating an upward bias. The Stochastic oscillator on the daily chart is showing an extreme reading, with %K at 91.53 and %D at 83.02, firmly in the overbought zone. This suggests caution is warranted as a pullback is possible, but it also confirms significant buying interest has been present. The ADX at 30.05 further solidifies the presence of a strong trend, even if the daily direction is less defined than on shorter frames.
From a macroeconomic perspective, several factors could be bolstering silver's appeal. Recent news suggests that gold, silver's precious metal cousin, has been rallying, pushing towards two-month highs around $4,450. This is often driven by a combination of safe-haven demand and expectations around central bank policy. Reports indicate that gold prices edged higher amid expectations of a Fed hold, following a weaker-than-expected jobs report. This sentiment can spill over into the silver market, as both metals often benefit from similar macro tailwinds, particularly when inflation concerns linger and interest rate hike expectations subside. The dollar index (DXY), currently at 99.9, has seen some upward movement, which can typically put pressure on precious metals. However, if the narrative shifts towards a Fed pivot or a pause in rate hikes due to labor market weakness, the DXY's strength might be capped, providing a more favorable environment for XAGUSD. The ongoing geopolitical tensions, mentioned in relation to oil prices and a stalled U.S.-Iran deal, also contribute to a background of uncertainty that can support precious metals as safe-haven assets.
The Bearish Case: Resistance Holds Firm, Caution Prevails
Conflicting Indicators and Overbought Signals
Despite the optimistic signals on shorter timeframes, a closer examination reveals significant headwinds for XAGUSD. The divergence in signals between the 1-hour and longer timeframes is a key concern. While the 1-hour chart shows bullish momentum, the 4-hour Stochastic is showing a potential bearish signal with %K (47.65) below %D (58.76), indicating a possible shift in momentum. More critically, the daily Stochastic oscillator is deep in overbought territory at 91.53%K and 83.02%D. This extreme reading suggests that the recent upward move has pushed silver into technically overvalued territory, making it vulnerable to a sharp correction or at least a period of consolidation. RSI readings, while not yet critically overbought on the daily (67.35), are approaching levels where price often stalls or reverses. The ADX on the 1-hour chart at 19.75 indicates a weak trend, meaning the current upward move might lack conviction and could easily reverse.
The price action itself presents a formidable barrier. XAGUSD is currently testing resistance around the $65.61 level on the 1-hour chart, and the broader daily resistance is marked at $65.99. The fact that the price is hovering near these levels, rather than decisively breaking through, suggests strong selling pressure is present. The daily chart's neutral trend classification (50% strength) underscores this indecision. While the MACD shows positive momentum on the daily, it's crucial to remember that this is a lagging indicator. The more immediate signals from Stochastic and the proximity to daily resistance levels are painting a more cautious picture. If silver fails to break decisively above $65.61 and, more importantly, the $65.99 daily resistance, bears could seize control, pushing the price back towards the support levels. The close proximity of the 1H resistance at $65.61 and the 4H resistance at $65.53 also presents a strong confluence of selling interest that could cap any further immediate upside.
Macroeconomic Headwinds and Dollar Strength
The bullish macro narrative is not without its counterarguments. While a weaker jobs report might suggest a Fed pause, it also raises concerns about economic slowdown, which could dampen demand for industrial metals like silver, even if it supports gold as a safe haven. If the market interprets the jobs data as a precursor to broader economic weakness, risk appetite could decline, leading to a sell-off in riskier assets and potentially impacting silver. Furthermore, the Dollar Index (DXY) is showing signs of strength, currently at 99.9 and with a bullish trend on the 1-hour and 4-hour charts. A strengthening dollar typically makes dollar-denominated commodities like silver more expensive for holders of other currencies, thus reducing demand. The DXY's daily chart shows a downtrend, but the shorter-term strength is a significant factor to consider. If the DXY manages to break above its daily resistance at 99.99, it could exert considerable downward pressure on XAGUSD.
The news regarding oil prices spiking due to geopolitical tensions is a double-edged sword. While higher oil prices can sometimes correlate with inflation, which might benefit precious metals, they also signal increased global instability. This instability could lead to a flight to safety, but not necessarily into silver. If the market's primary concern becomes a global economic slowdown driven by geopolitical conflict, investors might flock to the US Dollar or US Treasuries as true safe havens, rather than silver. The 'stalled U.S.-Iran deal' and 'Hormuz escalation' mentioned in recent reports are potent reminders of how quickly geopolitical risk can shift market dynamics, potentially leading to broad-based risk aversion that would punish riskier assets and even industrial commodities. This uncertainty creates a complex backdrop where the safe-haven appeal of silver might be overshadowed by broader economic fears and dollar strength.
Technical Confluence: The $65.28 Crossroads
The current price of $65.28 sits at a pivotal point, precisely where conflicting signals from various technical indicators create a neutral outlook for XAGUSD. On the 1-hour chart, the trend is strongly bullish (90% strength) with supportive RSI (58.58) and a clear Stochastic buy signal (%K > %D). However, this is immediately contrasted by the 4-hour Stochastic showing a potential pullback (%K
The confluence of resistance levels around $65.61 (1H) and $65.99 (1D) presents a significant hurdle for the bulls. Failure to decisively break these levels, especially with the daily Stochastic flashing overbought warnings, could trigger significant profit-taking. Conversely, the support levels at $65.07 (1H) and $64.36 (4H) offer potential floors. A break below $64.36 would invalidate the short-term bullish arguments and likely accelerate a move towards the deeper 4H support at $63.77. The overall picture is one of indecision, where the market is testing key resistance levels while grappling with overbought conditions on longer timeframes and mixed trend strength across different charts. This makes $65.28 a critical level to watch, as a decisive move above resistance or a firm rejection and break below support will likely dictate the next significant price direction.
Trade Scenarios and Probability Assessment
Bearish Rejection Scenario: Consolidation Beckons
55% ProbabilityNeutral Consolidation: Range-Bound Action
30% ProbabilityBullish Breakout: Targeting New Highs
15% ProbabilityNavigating the Uncertainty: A Trader's Perspective
For the short-term trader focused on the 1-hour chart, the setup is tricky. The strong bullish signals are enticing, but the proximity to resistance and the overbought Stochastic readings on longer timeframes demand caution. A scalp trade might look for a quick move towards $65.61, with a tight stop-loss just below $65.28 or even tighter if resistance holds firm. However, the risk of a reversal is significant given the daily Stochastic's extreme readings. Patience is key; waiting for a clear break above $65.61 with follow-through, or a confirmed rejection and break below $65.07, would offer a much clearer entry point.
Swing traders will likely find the daily and 4-hour charts more relevant. The strong ADX on the 4-hour chart (47.42) suggests a trend is present, but the neutral daily trend and overbought Stochastic are major concerns. The bearish scenario with a target at $63.77 appears to have a higher probability (55%) due to these conflicting signals and the approaching resistance. For a bullish position, waiting for a daily close above $65.99 would be essential, invalidating the overbought signals and confirming a new leg higher. The risk/reward for a long position at current levels, aiming for the $65.99 resistance, is not particularly attractive given the potential for a sharp pullback. The neutral consolidation scenario, with price likely trading between $64.36 and $65.61, offers a less volatile but also less rewarding trading environment.
The influence of broader market trends cannot be overstated. The DXY's current strength around 99.9, coupled with the mixed performance of major indices like the SP500 (currently at 6572.87, showing a neutral 4H trend but a bearish daily trend), adds layers of complexity. If risk aversion picks up, driven by geopolitical news or economic data, silver could face selling pressure. Conversely, any hint of a Fed dovish pivot, spurred by inflation data that cools significantly, could boost precious metals. Traders must remain vigilant, monitoring these correlated assets and economic releases closely. The current neutral trend on the daily chart for XAGUSD, combined with conflicting indicators, suggests that significant directional conviction is lacking. Therefore, a strategy focused on range trading within the defined support and resistance zones, or waiting for a decisive breakout with confirmation, appears most prudent. Managing risk tightly is paramount, especially given the elevated Stochastic readings and the critical resistance levels being tested.
Frequently Asked Questions: XAGUSD Analysis
What happens if XAGUSD breaks above the $65.99 daily resistance level?
A decisive daily close above $65.99 would invalidate the overbought Stochastic signal and confirm a bullish breakout. This could potentially trigger a move towards further resistance levels, with Target 1 at $67.34 and Target 2 at $68.24, as the bullish scenario gains probability.
Is RSI at 64.1 a sell signal for XAGUSD on the 4H chart, given the current price of $65.28?
An RSI of 64.1 on the 4H chart is in the upper neutral zone, indicating bullish momentum but not yet overbought conditions that would typically trigger a sell. However, combined with the daily Stochastic's extreme readings, it warrants caution rather than an immediate sell signal.
Should I buy XAGUSD at current levels of $65.28, considering the mixed signals?
Buying at $65.28 carries significant risk due to the conflicting technical signals and proximity to resistance. The bearish scenario (55% probability) suggests a pullback is more likely. Waiting for a confirmed break above $65.99 or a rejection and break below $64.36 would offer a clearer, lower-risk entry.
How will upcoming CPI data affect XAGUSD this week, given the current neutral trend?
If CPI data comes in hotter than expected, it could fuel inflation concerns, potentially boosting silver as a hedge and weakening the DXY. Conversely, cooler-than-expected data might reduce inflation fears, causing a risk-off sentiment that could pressure silver despite its safe-haven appeal.
Track markets in real-time
AI-powered analysis, technical indicators and real-time price data.
Join Our Telegram Channel
Breaking market news, AI analysis and trading signals instantly.
Join Channel