

The financial markets have been a whirlwind this past week, with the SP500 index finding itself at a critical juncture around the $6,572.87 mark. The narrative driving this volatility is a complex interplay of shifting central bank expectations, highlighted by a surprisingly weak Non-Farm Payrolls (NFP) report, and escalating geopolitical risks, particularly concerning oil supply routes. As traders digest these conflicting signals, the path forward for equities appears increasingly uncertain, demanding a cautious yet strategic approach. This analysis delves into the technical underpinnings and fundamental catalysts shaping the SP500's trajectory as we head into the crucial next trading week.
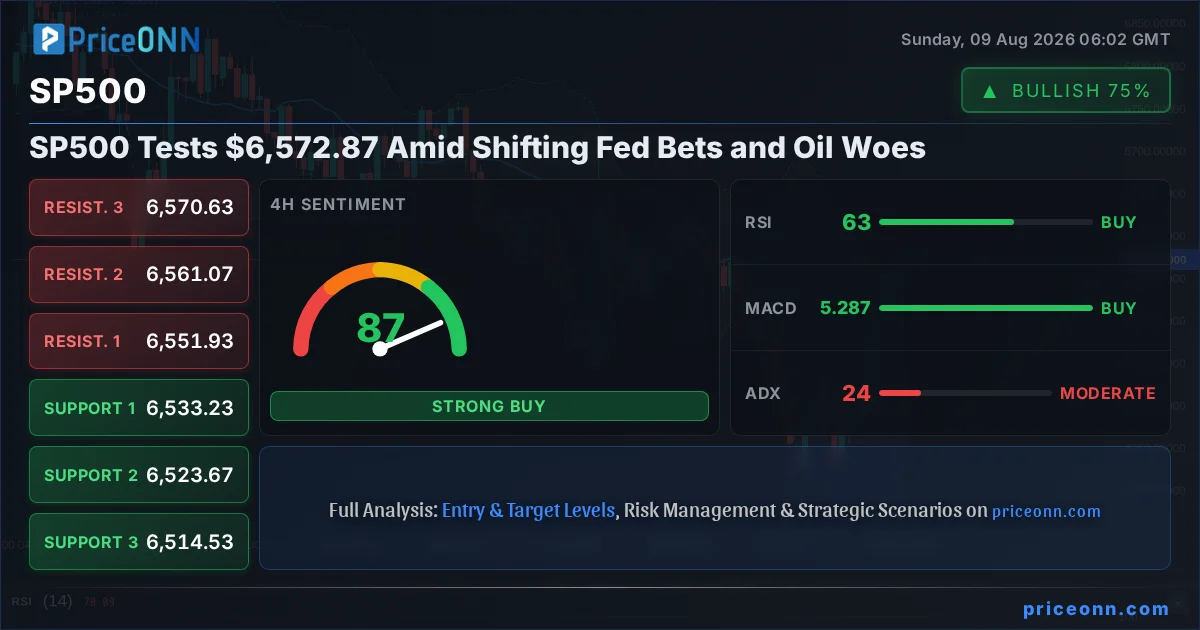
- The SP500 is trading around $6,572.87, with key support at $6,533.23 and resistance at $6,551.93 on the 4H chart.
- July's NFP report showed an unexpected loss of 23,000 jobs, significantly impacting Fed rate hike expectations for September.
- Geopolitical tensions around the Strait of Hormuz are keeping oil prices elevated, adding an inflationary concern despite weak NFP data.
- The DXY has seen consolidation, but the weak jobs report could signal a potential breakout, influencing currency pairs and risk assets like the SP500.
The past week has been a masterclass in market crosscurrents. On one hand, the much-anticipated July Non-Farm Payrolls (NFP) report delivered a shock, revealing an unexpected loss of 23,000 jobs. This starkly contrasts with projections, which had anticipated an increase of around 83,000. This data point has thrown a considerable spanner in the works for the Federal Reserve's monetary policy outlook. Prior to the NFP release, the market was pricing in a higher probability of a September rate hike. However, the weak employment figures have dramatically shifted those odds, with traders now leaning towards a Fed pause. This pivot in expectations, if sustained, could have significant implications for risk assets, including equities. The SP500, currently navigating levels around $6,572.87, is particularly sensitive to shifts in Fed policy, as lower interest rates generally translate to a more favorable environment for stock valuations. The immediate aftermath saw a knee-jerk reaction, with the dollar weakening and gold prices surging above $4,300 as rate-hike probabilities diminished. This risk-on sentiment, at least initially, provided some buoyancy to stock markets.
However, the picture is far from clear, and this initial risk-on rally is being tempered by persistent geopolitical anxieties, particularly concerning global oil supplies. Reports have highlighted how the U.S. energy system is working to mitigate potential supply shocks originating from the Strait of Hormuz, a vital chokepoint for global energy trade. Even with the weak NFP data suggesting a potential economic slowdown, elevated oil prices, driven by these geopolitical risks, continue to fan inflationary concerns. This creates a challenging dilemma for the Federal Reserve: do they prioritize combating inflation, potentially necessitating higher rates despite a weakening labor market, or do they pivot towards a more accommodative stance to support economic growth? This uncertainty is visibly reflected in the SP500's price action, which, despite the initial positive reaction to the NFP data, has struggled to build sustained momentum. The index's inability to decisively break through key resistance levels suggests that market participants are adopting a wait-and-see approach, awaiting further clarity on both the economic and geopolitical fronts.
Navigating the Crosscurrents: Technical Signals and Price Action
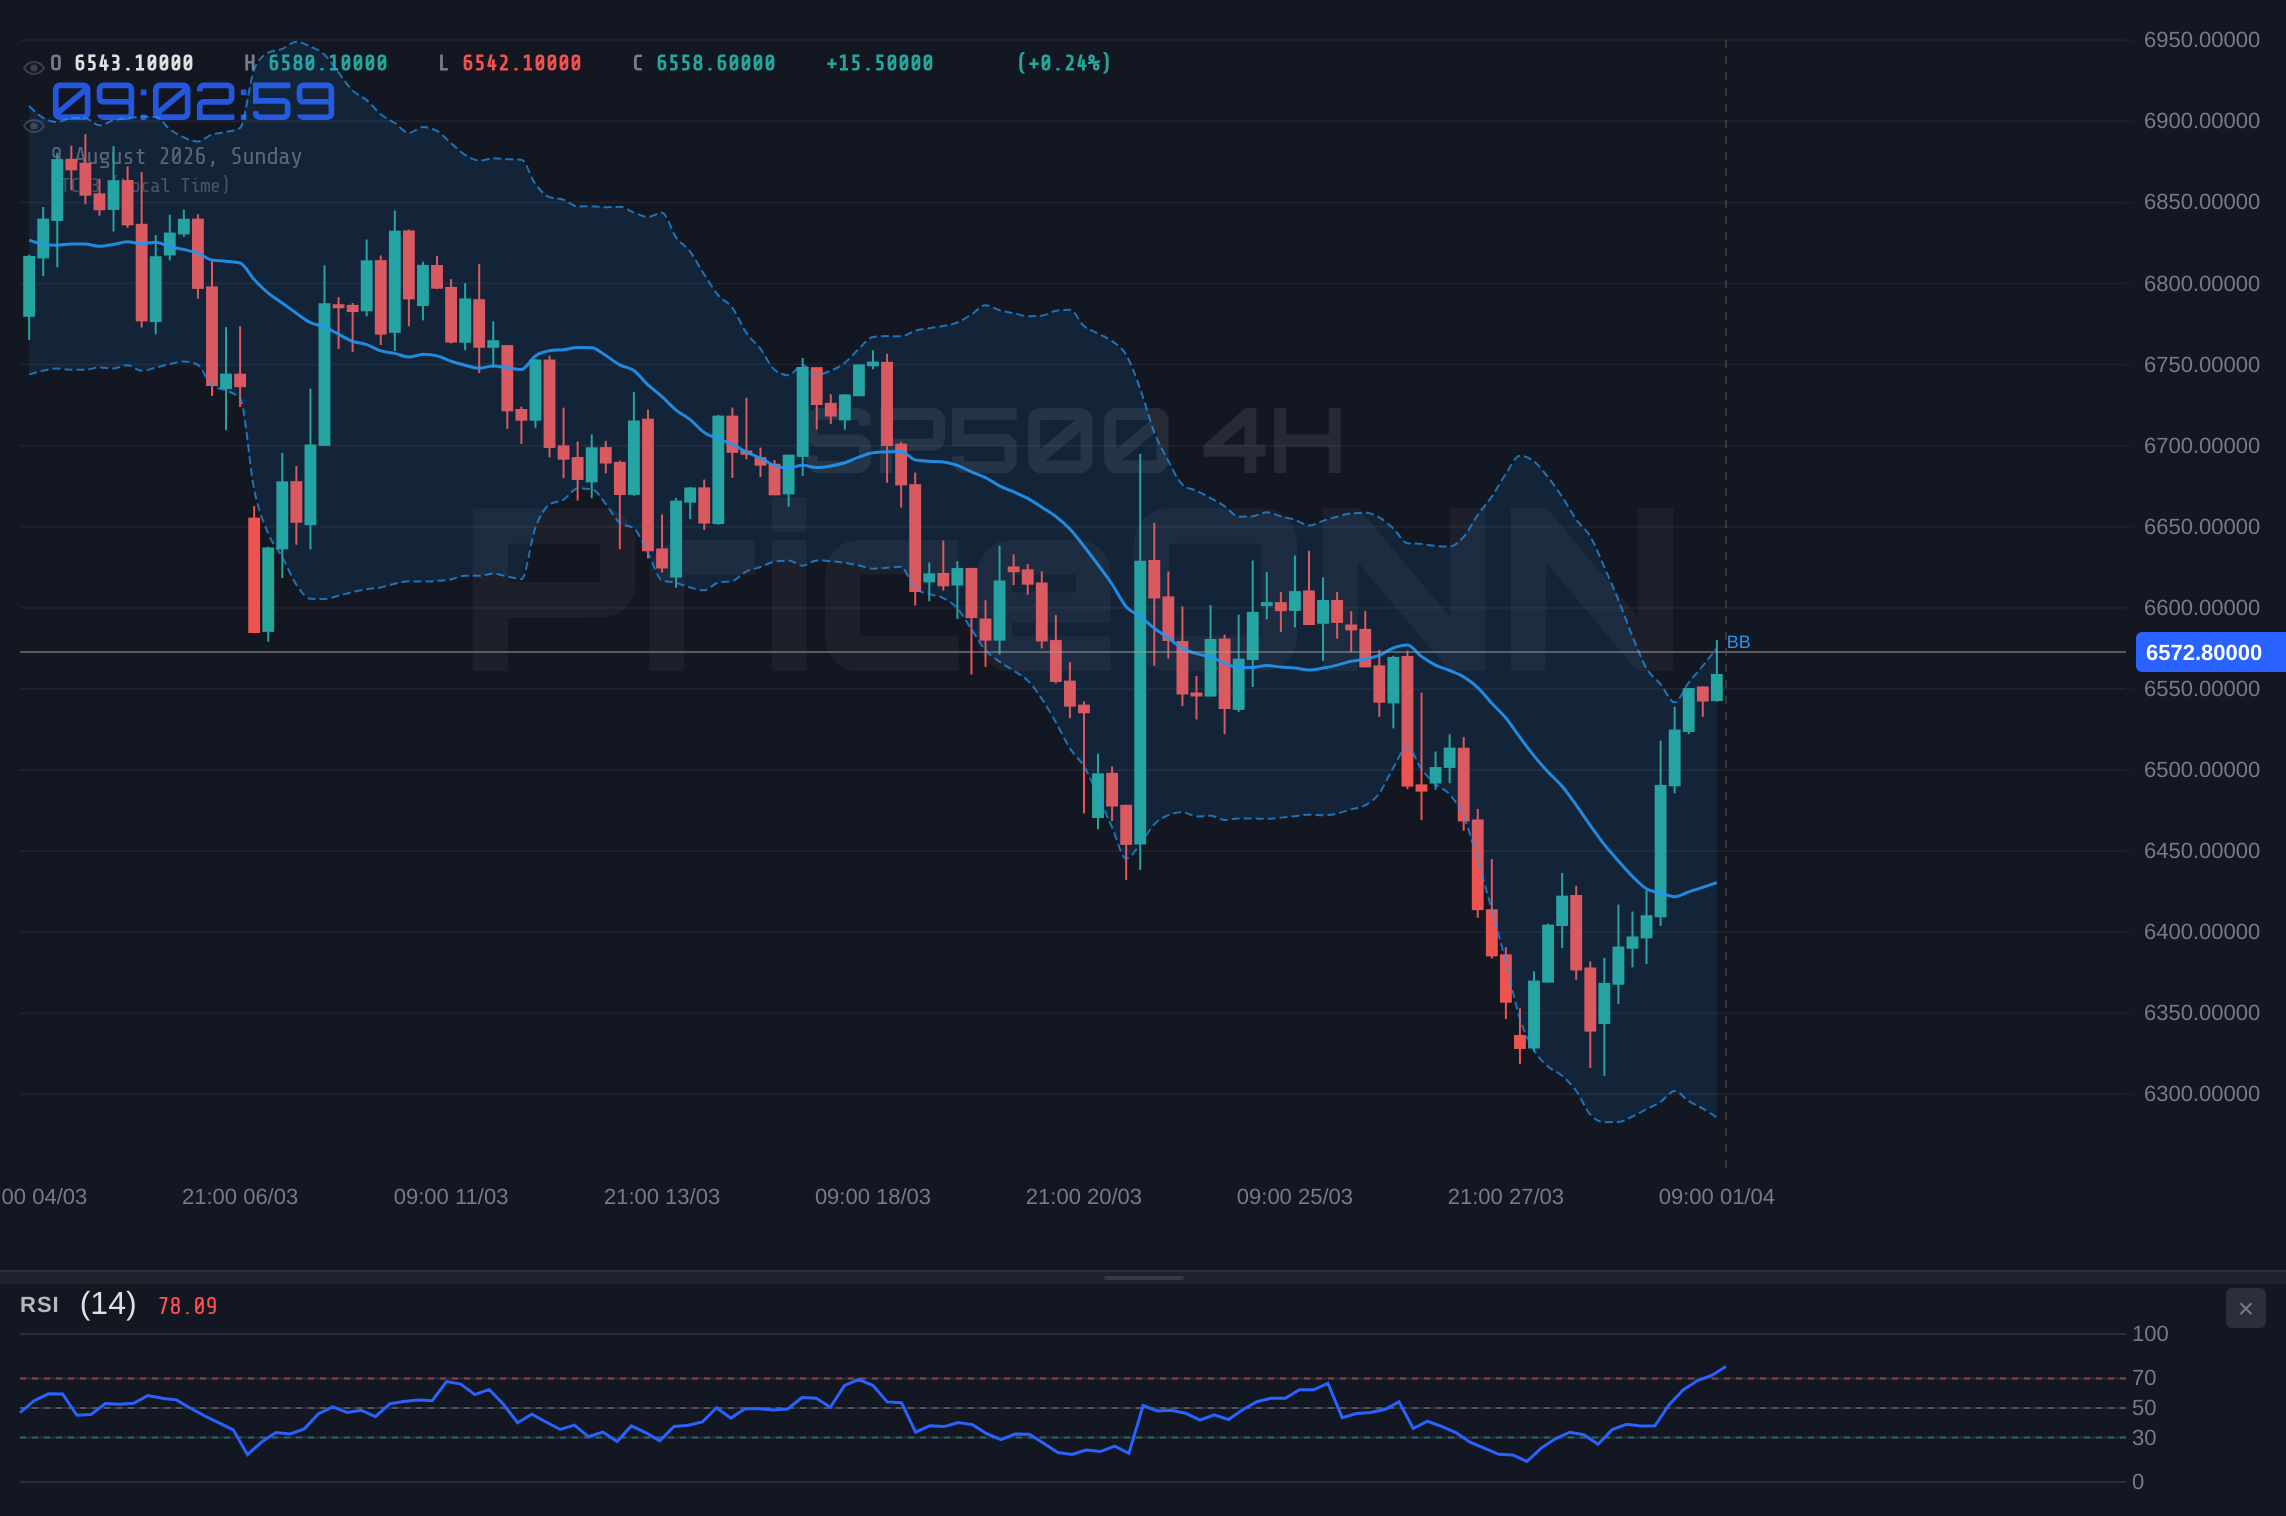
From a technical standpoint, the SP500's chart paints a picture of cautious indecision, even as the overall trend indicators suggest underlying strength. On the 4-hour timeframe, the index is currently trading around $6,572.87. The trend is described as neutral with a strength of 50%, which, while not indicating a strong directional bias, often precedes significant moves. Key support levels are identified at $6,533.23, $6,523.67, and $6,514.53. These are the levels where buying interest has historically emerged, providing a floor to price declines. Conversely, resistance looms at $6,551.93, $6,561.07, and $6,570.63. The battle between these support and resistance zones is where the immediate price action is unfolding.
The Relative Strength Index (RSI) on the 4-hour chart reads 62.83, placing it firmly in the neutral zone but exhibiting an upward bias. This suggests that while the market isn't yet overbought, the momentum is leaning towards the upside. However, the RSI on the 1-hour timeframe is at 70.95, indicating overbought conditions. This divergence is crucial; it highlights a potential for short-term profit-taking or a consolidation phase, even as longer-term indicators remain constructive. The MACD indicator is showing positive momentum on the 4-hour chart, with the MACD line above its signal line, reinforcing the idea of underlying bullish sentiment. Yet, on the 1-hour chart, the MACD exhibits negative momentum, with the MACD line below its signal line, echoing the RSI's cautionary signal. This conflict between timeframes suggests that while the broader trend might still be intact, the immediate pressure could be towards a pullback.
The Stochastic Oscillator presents a mixed bag across different timeframes. On the 4-hour chart, it shows K=97.85 and D=86.96, firmly in overbought territory and signaling a potential reversal or at least a pause in the rally. This is corroborated by the 1-hour Stochastic, where K=65.73 and D=73.5, showing K below D, which is a bearish crossover signal. This conflicting information from the Stochastic oscillator across timeframes underscores the indecision. However, the Average Directional Index (ADX) provides a clearer picture of trend strength. On the 4-hour chart, the ADX stands at 24.23, indicating a moderately trending market. On the 1-hour chart, it is higher at 49.72, suggesting a strong trend is in play, although the conflicting RSI and MACD signals question its direction. The overall signal on the 4-hour timeframe is 'BUY' (6 Buy, 2 Sell), but the 1-hour timeframe leans towards 'SELL' (5 Sell, 3 Buy). This technical tug-of-war necessitates a closer examination of how these conflicting signals might resolve.
The Dollar's Dance and Its Impact on Equities
The U.S. Dollar Index (DXY) has been consolidating for the past two months, creating a period of relative stability in currency markets. However, the recent weak NFP report has introduced a significant catalyst for a potential breakout. Historically, a strong dollar tends to exert downward pressure on U.S. equities, especially large-cap companies with substantial international exposure, as it makes their exports more expensive and reduces the value of foreign earnings when repatriated. Conversely, a weaker dollar can provide a tailwind for the stock market.
The DXY's current price is 99.55, showing a daily decrease of -0.39%. On the 1-hour timeframe, the trend is neutral with a strong ADX of 37.77, indicating a potential for a sharp move. The RSI at 33.54 suggests bearish momentum, aligning with the recent dollar weakness. The 4-hour chart shows a similar picture, with the DXY at 36.08 and ADX at 28.46, pointing to a strong downtrend. The Stochastic oscillator on the 1-hour chart shows K=28.27, D=28.25, a slight bullish crossover, while on the 4-hour, K=39.85 and D=72.12 indicate a bearish crossover. This mixed technical picture for the dollar mirrors the broader market's uncertainty.
If the weak NFP data leads to a sustained decline in the DXY, it could provide a much-needed boost to the SP500. A weaker dollar generally implies a less hawkish Federal Reserve, which is positive for equities. However, the geopolitical situation surrounding oil supply adds a layer of complexity. If oil prices remain elevated due to supply concerns, it could reignite inflation fears, potentially forcing the Fed's hand despite the weak labor market. This creates a scenario where a weaker dollar might not translate into a straightforward bullish outcome for the SP500 if inflation remains sticky. The correlation between the DXY and the SP500 is crucial here. Typically, a falling DXY supports the SP500, but persistent inflation concerns could disrupt this relationship. Traders are closely watching whether the dollar's weakness is a temporary reaction to the jobs report or the beginning of a more significant downtrend. The upcoming week's economic data, particularly inflation figures, will be pivotal in determining the Fed's next move and, consequently, the dollar's direction and its impact on the SP500.
Geopolitical Tensions: The Oil Price Conundrum
The global energy markets are currently under a significant spotlight, largely due to heightened geopolitical tensions, particularly concerning the Strait of Hormuz. This strategic waterway is a critical chokepoint for global oil and LNG supply, and any disruption here can send ripples across the world economy. Reports indicate that U.S. energy infrastructure is working to mitigate the impact of potential supply shocks, but the underlying risk remains palpable.
Brent crude is trading around $81.23, having seen a daily decrease of 1.39%. On the 1-hour chart, the trend is neutral with a strong ADX of 29.28, pointing to a strong downtrend, while the RSI at 47.69 suggests bearish momentum. The 4-hour chart shows Brent at 49.39 RSI, also in bearish territory, with a weak ADX of 18.16 suggesting a lack of strong trend. The 1-day chart shows Brent at 46.51 RSI, again bearish, with an ADX of 21.05 indicating a moderate downtrend. This suggests that while oil prices have seen some pullback, the underlying geopolitical risk premium is likely keeping them elevated. WTI crude is trading around $78.20, also showing a daily decrease, with similar technical indicators suggesting bearish momentum in the short term.
The persistence of high oil prices, even in the face of weak economic data like the recent NFP report, presents a significant challenge for policymakers and investors. Elevated energy costs contribute to inflation, potentially complicating the Federal Reserve's decision-making process. If inflation remains stubbornly high, the Fed might be compelled to maintain a hawkish stance, even if the labor market is softening. This scenario could lead to stagflationary pressures – a combination of stagnant economic growth and high inflation – which is generally detrimental to equity markets. The SP500's reaction to oil price movements is therefore closely watched. A sustained rise in oil prices, driven by geopolitical events, could counteract the positive effects of a potentially looser monetary policy, creating a complex and potentially bearish environment for stocks. The market is currently grappling with this dichotomy: weak economic data suggests a need for easing, but geopolitical supply risks suggest inflation may persist, complicating the path forward.
Market Structure and Trader Positioning
Understanding how different market participants are positioned can offer valuable insights into potential price movements. While we don't have direct access to Commitment of Traders (COT) data or detailed options flow in this context, we can infer positioning from the technical indicators and price action. The conflicting signals across various timeframes for the SP500 suggest a market that is not yet fully committed to a direction. The presence of overbought conditions on shorter timeframes (1H RSI at 70.95) alongside stronger underlying trends on longer timeframes (4H ADX at 24.23) indicates a potential battle between short-term profit-taking and longer-term trend followers.
The fact that the SP500 is currently trading around $6,572.87, near key resistance levels like $6,551.93 and $6,561.07, suggests that sellers might be stepping in to defend these areas. Conversely, the support levels at $6,533.23 and $6,523.67 are likely being monitored by buyers looking for opportunities on any dips. The inability of the index to decisively break higher, despite the initial positive reaction to the NFP report, indicates a lack of strong conviction among buyers at these elevated levels. This could be due to the aforementioned geopolitical risks and the lingering inflation concerns that complicate the Fed's policy path.
The ADX reading of 49.72 on the 1-hour chart, while indicating a strong trend, is being interpreted in the context of conflicting momentum signals. This suggests that the trend might be weakening or that the market is struggling to establish a clear direction. When such strong trend indicators are present alongside conflicting momentum oscillators like RSI and MACD, it often signals a period of consolidation or a potential reversal. Traders are likely waiting for a clearer signal, perhaps a decisive break above resistance or a firm hold of support, before committing to significant positions. The upcoming week's economic calendar, including inflation data, will be crucial in providing the clarity needed to break this stalemate.
The Fed's Tightrope Walk: Rate Expectations and Inflation
The Federal Reserve finds itself in a precarious position. The July NFP report, indicating an unexpected contraction in job growth, points towards a cooling labor market and potentially slowing economic momentum. This data typically supports a more dovish monetary policy stance, with markets pricing in a higher likelihood of the Fed holding interest rates steady in September. The CME FedWatch Tool, if available, would likely reflect this shift, showing a diminished probability of a rate hike.
However, the persistent geopolitical risks surrounding oil supply continue to cast a shadow of inflation uncertainty. Elevated energy prices can feed into broader inflation metrics, complicating the Fed's mandate of price stability. If inflation proves to be more persistent than anticipated, the Fed may be forced to maintain a hawkish bias, even if economic growth falters. This tightrope walk between supporting employment and controlling inflation is a delicate balancing act. The market's reaction to the SP500 is highly sensitive to these Fed expectations. A pivot towards a more accommodative policy (lower rates or slower tightening) is generally bullish for equities, as it reduces borrowing costs and can stimulate economic activity. Conversely, a continued hawkish stance, driven by inflation fears, could weigh on stock prices, especially if it leads to a recession.
The current technical setup on the SP500, with mixed signals across timeframes and price hovering near resistance, reflects this underlying policy uncertainty. The market is grappling with the implications of both a potentially slowing economy and the risk of sustained inflation. This ambiguity is likely contributing to the current choppy price action. As we look ahead, the upcoming inflation data (CPI, PCE) will be critical in shaping the Fed's narrative and, consequently, market sentiment. A softer inflation print would likely reinforce the 'Fed pause' narrative and support risk assets, while a hotter-than-expected reading could reignite hawkish fears and put pressure on the SP500.
Economic Calendar Watchlist: Key Data and Events
The coming week is packed with potentially market-moving economic data releases that will be crucial for shaping the outlook for the SP500. Following the disappointing July NFP report, all eyes will be on upcoming inflation figures. The U.S. Consumer Price Index (CPI) and Personal Consumption Expenditures (PCE) price index reports are particularly important as they provide the Fed with key insights into inflationary pressures.
If these inflation reports come in softer than expected, it would further solidify the market's expectation of a Fed pause and could provide a significant boost to the SP500. This would align with the weakening labor market data, suggesting that the economy is cooling sufficiently to allow the Fed to ease off its tightening cycle. Such a scenario could encourage investors to increase their exposure to riskier assets like equities, potentially driving the index higher towards its resistance levels. Conversely, any indication that inflation remains stubbornly high, perhaps due to the persistent impact of elevated oil prices or other supply-side factors, could force the Fed to reconsider its dovish pivot. This would likely lead to renewed selling pressure on the SP500, pushing it back towards its support levels.
Beyond inflation data, other releases such as weekly jobless claims, retail sales, and potentially revised manufacturing or services PMIs will also contribute to the overall economic picture. The Bank of Japan's (BoJ) Summary of Opinions is also scheduled, which could influence currency markets and indirectly affect global risk sentiment. While the BoJ's policy is generally less impactful on the SP500 than the Fed's, any hawkish signals could support the Yen and potentially lead to broader risk aversion. The market's reaction to these data points will be closely monitored, with traders looking for confirmation of either a sustained economic slowdown warranting Fed easing or persistent inflationary pressures that could keep monetary policy tight.
Scenario Analysis: Mapping Potential SP500 Movements
Given the current confluence of conflicting signals – a weakening labor market, persistent geopolitical risks affecting oil prices, and a mixed technical picture – the SP500 faces a period of heightened uncertainty. Probability estimates are crucial for navigating such environments, allowing traders to position themselves based on the most likely outcomes while remaining prepared for alternatives.
Bearish Scenario: Inflation Fears Reignite
60% ProbabilityNeutral Scenario: Consolidation Around Key Levels
25% ProbabilityBullish Scenario: Fed Pause Confirmed, Inflation Cools
15% ProbabilityThe bearish scenario, carrying a 60% probability, hinges on inflation fears resurfacing, potentially driven by continued geopolitical risks to oil supply or hotter-than-expected inflation data. In this case, the SP500 could break below the crucial 4-hour support at $6,533.23, targeting $6,523.67 and then $6,514.53. This would signal a renewed risk-off sentiment, potentially amplified by a strengthening dollar if the Fed is forced to maintain a hawkish stance. The invalidation for this scenario would be a sustained move back above the 4-hour resistance at $6,570.63, suggesting the bearish thesis is flawed.
The neutral scenario, with a 25% probability, anticipates continued range-bound trading as the market waits for definitive catalysts. Price action would likely oscillate between the 4-hour support at $6,533.23 and resistance at $6,570.63. Within this range, traders might target the intermediate levels of $6,551.93 and $6,523.67. This scenario plays out if upcoming data fails to provide a clear direction or if conflicting signals continue to paralyze decision-making. The trigger for exiting this range would be a decisive break above resistance or a firm break below support.
The bullish scenario, currently assigned a 15% probability, relies on a clear confirmation of a Fed pause, likely spurred by cooling inflation data, and a de-escalation of geopolitical tensions. A break and sustained hold above the 4-hour resistance at $6,570.63, ideally with strong volume, would be the trigger. This could open the door for a move towards the daily resistance levels of $6,605.07 and potentially $6,685.83. This outcome would be supported by a weakening dollar and a resurgence of risk appetite. However, the current backdrop suggests this is the least probable outcome in the immediate term.
The Week Ahead: Watching Key Levels and Catalysts
Looking ahead to the next trading week, the SP500 remains at a critical crossroads. The immediate focus will be on how the market digests the implications of the weak NFP report and the ongoing geopolitical narrative surrounding oil prices. The technical levels identified on the 4-hour chart – support at $6,533.23 and resistance at $6,570.63 – will be paramount. A decisive break above resistance, particularly if accompanied by strong volume and positive macroeconomic data, could signal a resumption of the bullish trend. Conversely, a failure to hold support at $6,533.23 might trigger a more significant decline, especially if inflation data remains elevated or geopolitical risks escalate.
The U.S. CPI and PCE reports will be the primary economic catalysts. Should inflation continue to moderate, it would likely bolster the 'Fed pause' narrative, providing a tailwind for the SP500. However, the market's reaction will also depend on the broader context. If the dollar strengthens significantly alongside cooling inflation, it could mute the positive impact on equities. The interplay between inflation, Fed policy expectations, and geopolitical stability will dictate the market's direction. Traders should remain vigilant for any shifts in these key drivers, using the identified support and resistance levels as guides for potential entry and exit points. Managing risk through appropriate stop-loss orders will be essential, given the current market's sensitivity to unexpected news.
The correlation with the DXY will also be a key theme to monitor. If the dollar index continues its decline, it could offer support to the SP500. However, if geopolitical tensions cause oil prices to spike again, potentially reigniting inflation fears, the dollar might find renewed strength, which could reverse the positive sentiment for equities. Ultimately, the market is seeking clarity – clarity on inflation, clarity on the Fed's path, and clarity on the geopolitical landscape. Until such clarity emerges, expect continued choppiness and a heightened sensitivity to economic data releases and headlines. The $6,572.87 level represents a battleground where these competing forces are currently playing out, and the resolution of this struggle will likely define the SP500's performance in the coming days.
Frequently Asked Questions: SP500 Analysis
What happens if the SP500 breaks below the $6,533.23 support level?
If the SP500 closes decisively below the 4-hour support at $6,533.23, it could trigger a bearish scenario. This would likely lead to a test of the next support level at $6,523.67, with a potential downside target towards $6,514.53. Such a move would signal increasing risk aversion, possibly driven by renewed inflation fears or geopolitical instability.
Should I buy the SP500 at current levels around $6,572.87 given the mixed signals?
Buying at current levels around $6,572.87 requires careful consideration due to the mixed technical signals and uncertain macro outlook. A more prudent approach might be to wait for a clear breakout above the $6,570.63 resistance with confirmation, or a confirmed hold of the $6,533.23 support, to reduce risk and improve the risk/reward ratio.
Is the RSI at 70.95 on the 1-hour chart a sell signal for the SP500 right now?
An RSI reading of 70.95 on the 1-hour chart indicates overbought conditions, which can suggest a potential for short-term profit-taking or a pause in the rally. While it's not a definitive sell signal on its own, it warrants caution and suggests that immediate upside momentum might be limited without further confirmation from other indicators or price action.
How will upcoming inflation data affect the SP500 this week?
Softer inflation data would likely reinforce the 'Fed pause' narrative, potentially boosting the SP500 towards higher resistance levels. Conversely, hotter-than-expected inflation could reignite hawkish Fed expectations, putting pressure on the index and testing its support levels around $6,533.23.
Track markets in real-time
AI-powered analysis, technical indicators and real-time price data.
Join Our Telegram Channel
Breaking market news, AI analysis and trading signals instantly.
Join Channel