

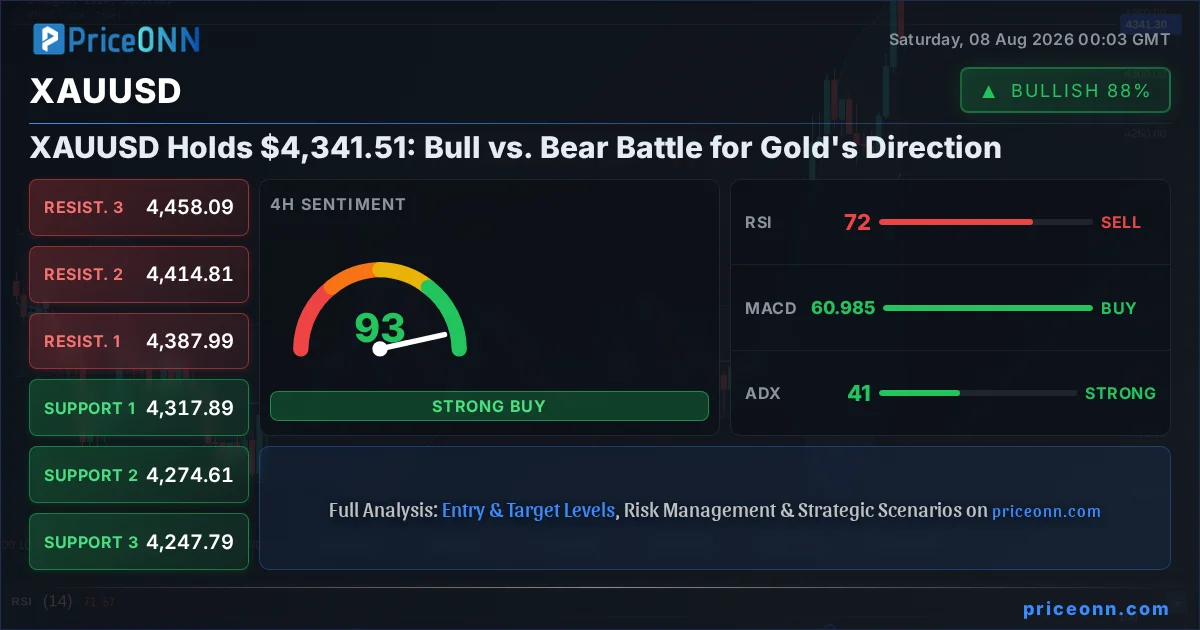
The precious metal, XAUUSD, finds itself at a pivotal crossroads, currently trading around the critical $4,341.51 mark. This level represents a battleground where bullish aspirations clash with bearish pressures, creating a tense equilibrium that traders are scrutinizing intensely. Last week's surprising US Non-Farm Payrolls (NFP) report, which showed an unexpected job loss of 23,000, sent shockwaves through the markets, initially propelling gold prices above $4,300 and easing Federal Reserve rate-hike expectations. However, as the dust settles, a complex interplay of factors - including a strengthening US Dollar Index (DXY), persistent geopolitical risks, and nuanced technical indicators - suggests that the true direction of gold is far from decided. This analysis delves into the intricate technical landscape and fundamental undercurrents shaping the ongoing tug-of-war for gold's future trajectory.
- The US economy unexpectedly shed 23,000 jobs in July, a surprise that initially sent gold above $4,300 and eased Fed rate-hike bets.
- Critical support for XAUUSD currently sits at $4,330.83, with resistance looming at $4,341.60 on the 1-hour chart.
- The ADX indicator at 35.76 on the 1-hour chart and 40.51 on the 4-hour chart signals a strong underlying trend, despite the neutral daily trend strength.
- The US Dollar Index (DXY) is showing signs of stabilization around 99.58, creating a headwind for gold as it attempts to consolidate its recent gains.
- Geopolitical tensions, particularly surrounding the Strait of Hormuz and US-China relations, continue to provide a background bid for gold as a safe-haven asset.
The Bull Case: Momentum and Macro Tailwinds
The bullish argument for gold is anchored by several compelling factors, primarily stemming from the unexpected weakness in the US labor market. The July NFP report, revealing a net loss of 23,000 jobs against projections of an 83,000 increase, has significantly altered the Federal Reserve's perceived path forward. This data point has dramatically reduced the probability of a September interest rate hike, a sentiment reflected in the CME FedWatch tool which now prices in a lower chance of such a move. Lower interest rates, or even the prospect of a Fed pause, historically create a more favorable environment for non-yielding assets like gold. The reduced yield on US Treasuries, a direct consequence of easing rate hike expectations, makes gold relatively more attractive to investors seeking value preservation and potential upside. Furthermore, the 1H and 4H charts show strong bullish signals: RSI readings at 64.58 and 72.44 respectively indicate upward momentum, while the MACD remains above its signal line, confirming positive momentum. The ADX, a measure of trend strength, is robust across multiple timeframes (35.76 on 1H, 40.51 on 4H), suggesting that the underlying upward trend, despite daily neutral readings, has significant legs. The significant daily gain of 2.38% or 101.1 points, with a trading range from $4,229.48 to $4,371.52, underscores the recent bullish conviction. This price action, coupled with the overall 'BUY' signals from multiple indicators across shorter timeframes, paints a picture of a market leaning towards further appreciation.
The narrative of declining inflation expectations, fueled by the weaker jobs report and falling oil prices (Brent down 1.3%, WTI down 1.17%), also plays into the hands of gold bulls. As inflation fears recede, the impetus for aggressive monetary tightening diminishes. Gold has traditionally been viewed as an inflation hedge, but its appeal also lies in its role as a store of value when real yields (nominal yields minus inflation) are low or negative. The current environment, where nominal yields might be stable but inflation expectations are falling, can lead to rising real yields, which is typically a headwind for gold. However, the market's reaction to the NFP data suggests that the immediate impact of lower rate hike probabilities is outweighing the real yield effect. Moreover, the ongoing geopolitical risks, particularly the tensions surrounding the Strait of Hormuz and broader US-China relations, continue to act as a persistent tailwind for gold. News reports from Reuters and Bloomberg highlight these concerns, with Iranian actions impacting global LPG trade and creating underlying market anxiety. This 'fear premium' often drives safe-haven demand for gold, providing a floor even as other macro factors might suggest caution. The fact that gold prices surged after the weak US data, as reported by ForexLive and other financial news outlets, reinforces its status as a go-to asset during times of economic uncertainty and shifting monetary policy expectations.
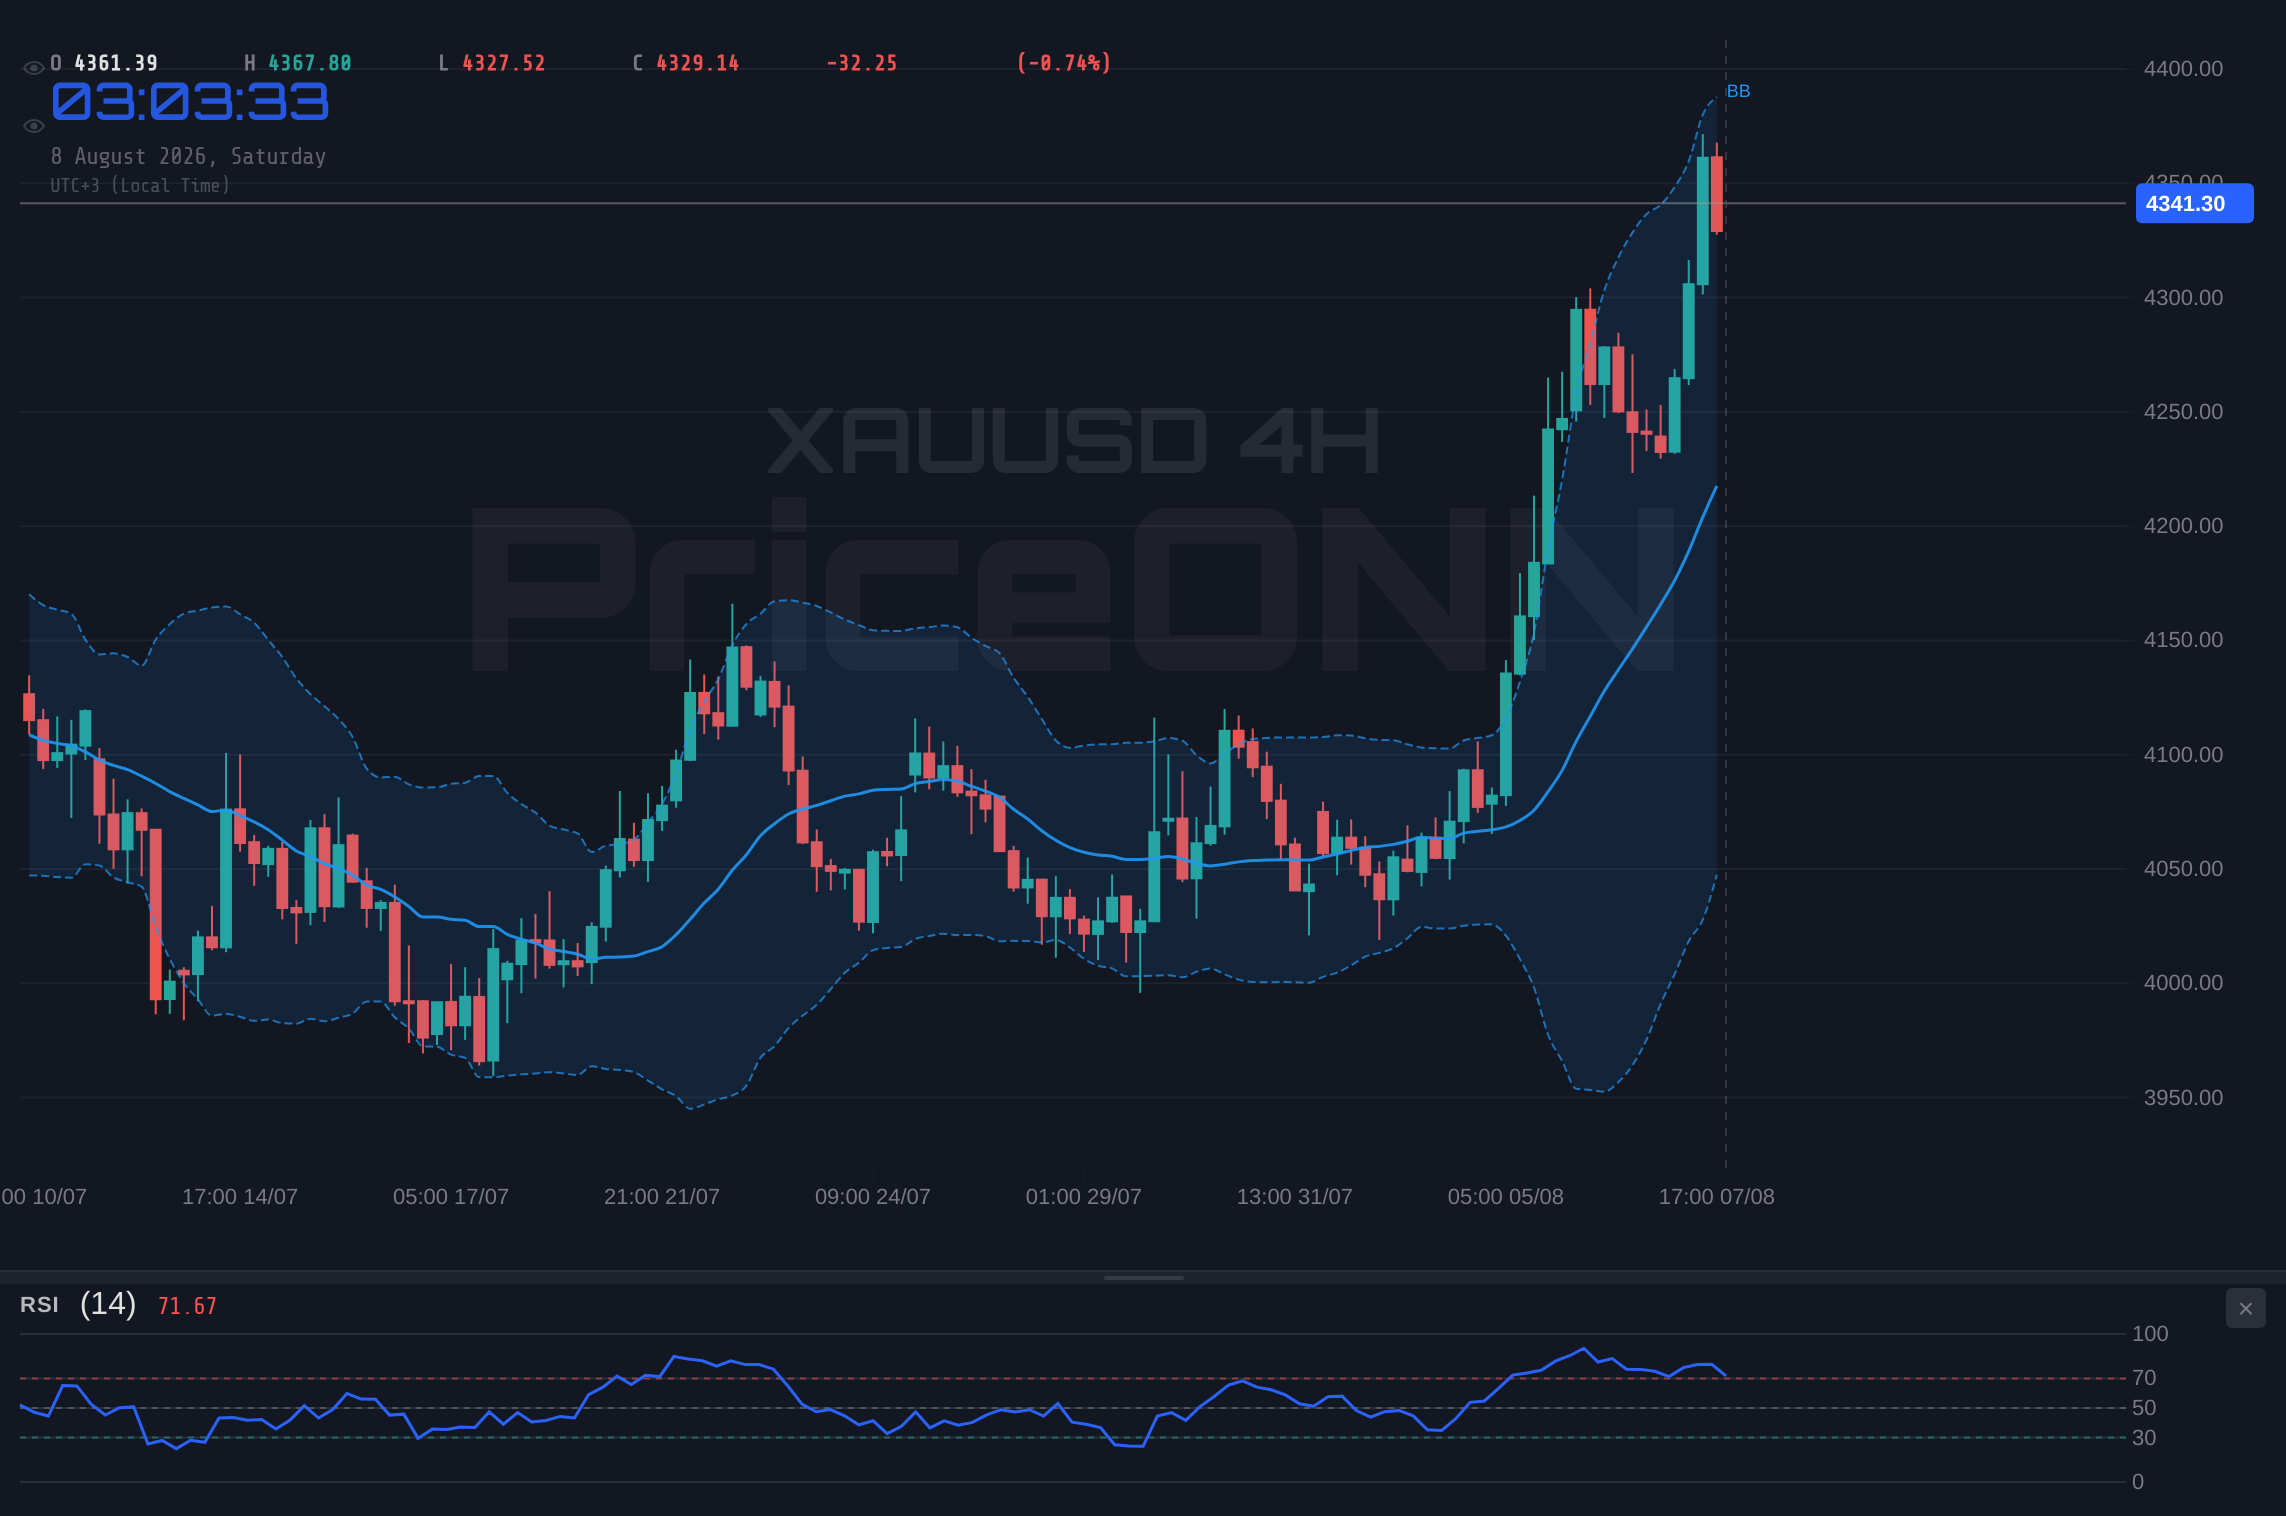
Looking at the technical indicators on the daily chart, while the trend strength (ADX at 27.02) is moderate compared to shorter timeframes, the overall signal remains 'BUY' (7 Buy, 1 Sell, 0 Neutral). The RSI at 65.51 is in the neutral zone but trending upwards, indicating room for further gains before hitting overbought territory. The Stochastic Oscillator (K=87.92, D=59.65) shows a strong upward signal, with the %K line well above the %D line and approaching overbought conditions, but not yet in extreme territory. The Bollinger Bands on the daily chart are trading above the middle band, suggesting an upward bias, and the price is pushing towards the upper band, indicating strong buying interest. This confluence of factors – easing rate hike expectations, falling inflation concerns, persistent geopolitical risks, and strong short-to-medium term technical momentum – builds a solid foundation for the bullish case. The recent rally, characterized by a significant daily price increase and a wide trading range, demonstrates that buyers are actively engaging with the market, pushing XAUUSD towards higher levels. The ability to hold above key support levels, such as $4,330.83 on the 1-hour chart, will be crucial for sustaining this upward momentum.
The immediate price action on the 1-hour chart, where XAUUSD is trading near the $4,341.60 resistance, is crucial. A decisive break and hold above this level, supported by strong volume and positive follow-through, would signal further upside potential, targeting higher resistance levels like $4,347.66 and $4,352.37. The sustained 'BUY' signals across the 1H and 4H timeframes, with an overwhelming majority of indicators pointing towards an increase, provide a strong technical basis for a bullish outlook. Even the daily chart, despite a neutral trend strength reading, leans towards a 'BUY' signal. This technical picture, combined with the fundamental shift in Fed policy expectations following the NFP report, creates a potent cocktail for gold bulls. The market appears to be pricing in a less hawkish central bank, which directly benefits gold by reducing the opportunity cost of holding the metal.
The confluence of weak US jobs data, reduced Fed rate hike odds, and strong short-term technicals provides a robust foundation for gold's upward momentum. Geopolitical risks add a layer of safe-haven demand, further supporting a bullish outlook.
The Bear Case: DXY Strength and Overbought Signals
Despite the initial euphoria following the weak NFP report, the bearish case for XAUUSD hinges on several counteracting forces. Firstly, the US Dollar Index (DXY) has shown resilience, currently trading around 99.58. While it experienced a dip after the jobs data, the index is consolidating and showing signs of stabilization. The DXY's 1-hour chart indicates a neutral trend with a 'SELL' signal (1 Buy, 7 Sell, 0 Neutral), but its 4-hour chart shows positive momentum and a 'SELL' signal (1 Buy, 7 Sell, 0 Neutral), suggesting underlying dollar strength could re-emerge. A stronger dollar typically exerts downward pressure on gold, as it becomes more expensive for holders of other currencies. This inverse correlation is a well-established market dynamic, and any sustained recovery in the DXY could quickly cap gold's upside. The fact that the dollar didn't completely collapse after the NFP data, and is showing signs of consolidation, suggests that market participants may be looking beyond the immediate jobs report and considering other factors that support the greenback, such as global economic uncertainty or a delayed reaction to the broader economic picture.
Secondly, while shorter-term charts show bullish momentum, longer-term overbought conditions are starting to emerge. On the 4-hour chart, the RSI is at 72.44, firmly in overbought territory, suggesting that the recent rally might be due for a correction or consolidation. Similarly, the Stochastic Oscillator on the 4-hour chart (K=87.15, D=65.85) and the 1-day chart (K=87.92, D=59.65) are both showing strong upward signals but are also approaching extreme overbought levels. While Stochastic can remain overbought for extended periods during strong trends, it also increases the risk of a sharp pullback if selling pressure intensifies. The ADX on the daily chart at 27.02, while indicating a strong trend, is not as robust as on the shorter timeframes, suggesting the daily trend might be less committed than the intraday momentum implies. The Bollinger Bands on the daily chart are trading above the middle band, with price pushing the upper band, which can sometimes signal an overheated market ripe for a reversal, especially if candlestick patterns suggest bearish divergence or exhaustion.
Furthermore, the market's reaction to the NFP data might have been an overreaction, or the impact of this single data point could be fading as traders look ahead to other economic indicators and geopolitical developments. The brief dip in oil prices, despite the geopolitical tensions, could also signal a temporary easing of inflation fears, which might reduce some of the safe-haven demand for gold. While geopolitical risks provide a floor, they are often volatile and can shift rapidly. Any sign of de-escalation in the Strait of Hormuz or a more positive outlook on US-China relations could quickly dissipate the 'fear premium' that is currently supporting gold prices. The fact that Brent crude and WTI futures saw declines of 1.3% and 1.17% respectively, despite ongoing tensions, hints at a possible shift in sentiment or a focus on other market drivers. The bearish argument is essentially that the market has priced in the immediate impact of the weak NFP, and that a combination of dollar resilience, potential overbought technicals, and the fading of immediate geopolitical fears could lead to a correction.
The immediate resistance level on the 1-hour chart at $4,341.60 is a critical hurdle. Failure to decisively break above this level, especially if accompanied by bearish candlestick patterns or increased selling volume, could signal the start of a pullback. The support levels at $4,330.83 and $4,326.12 become key areas to watch if the bears manage to regain control. The daily chart's overall 'BUY' signal, while present, is less convincing than the shorter timeframes, and the potential for divergence between shorter-term momentum and longer-term overbought conditions cannot be ignored. If gold fails to extend its gains and instead starts to consolidate or reverse from current levels, it would validate the bearish concerns about overextended technicals and the potential for dollar strength to reassert itself. The market's tendency to sometimes 'fade the NFP reaction' can also play a role, meaning that the initial strong move might be followed by a retracement as the market reassesses the broader economic landscape.
If gold fails to hold above $4,330.83 and the DXY shows renewed strength, the overbought technicals on the 4-hour and daily charts could lead to a significant pullback.
The Neutral Scenario: Consolidation Amidst Uncertainty
Given the conflicting signals and the current market dichotomy, a neutral scenario where XAUUSD consolidates within a defined range is a highly plausible outcome. The market is caught between the immediate relief from easing Fed rate-hike expectations, which is bullish for gold, and the persistent strength of the US dollar, geopolitical risks, and potential overbought technicals, which are bearish. This creates a perfect environment for range-bound trading, where the price oscillates between support and resistance levels without a clear directional commitment. On the 1-hour chart, the support at $4,330.83 and resistance at $4,341.60 define a narrow trading band. A failure to break decisively through either level could lead to a period of sideways movement as traders await further catalysts.
The daily chart's trend strength (ADX at 27.02) is only moderate, supporting the idea of a less directional market. While shorter timeframes exhibit strong 'BUY' signals, the daily indicators are more mixed, with RSI at 65.51 and Stochastic nearing overbought levels but not yet extreme. This suggests that while there is underlying buying pressure, the conviction for a sustained breakout might be lacking at current price levels. The DXY's consolidation around 99.58 further reinforces this neutral outlook. If the dollar remains range-bound, it will likely prevent gold from making a significant directional move in either direction. Geopolitical factors, while providing a baseline support for gold, are also inherently unpredictable and can fluctuate in intensity, leading to short-term volatility within a broader neutral trend. The market might be in a 'wait-and-see' mode, digesting the implications of the NFP report while simultaneously monitoring developments in global politics and central bank communication.
In this neutral scenario, traders would focus on identifying the boundaries of the trading range and looking for opportunities to trade within those limits. Scalpers and short-term traders might find opportunities on both sides of the range, while longer-term investors might prefer to wait for a clear breakout confirmation. The key would be the price action around the immediate support and resistance levels. If XAUUSD repeatedly tests $4,341.60 resistance without a clear break, it suggests selling pressure is building at that price point. Conversely, if it holds above $4,330.83 support, buyers might step in again. The market sentiment is likely to remain cautious, with participants wary of committing to large positions until a clearer picture emerges regarding the Fed's next move, the evolution of geopolitical tensions, and the underlying strength of the US economy beyond a single jobs report. This period of consolidation could allow technical indicators to reset, potentially setting the stage for a more decisive move once a new catalyst emerges.
Conflicting macro and technical signals suggest a period of consolidation around $4,341.51 is likely until a clearer catalyst emerges.
Navigating the Crossroads: Technical Levels and Trade Scenarios
The current technical setup for XAUUSD presents a complex picture, demanding a nuanced approach. On the 1-hour chart, the immediate price action is critical. The resistance at $4,341.60 is the first hurdle. A decisive breach and sustained hold above this level, ideally with increasing volume, would validate the bullish momentum and open the path towards $4,347.66 and potentially $4,352.37. The ADX at 35.76 on this timeframe supports a trend continuation, but the RSI at 64.58 is nearing neutral territory and could signal caution. The Stochastic Oscillator, with %K at 53.74 and %D at 61.93, is showing a bearish cross (though still in a relatively neutral zone), hinting at potential short-term weakness or consolidation immediately after a price push.
The 4-hour chart presents a stronger bullish bias, with an ADX of 40.51 indicating a robust trend. However, the RSI at 72.44 is a significant overbought warning, suggesting that any further upside might be met with profit-taking. The Stochastic Oscillator (K=87.15, D=65.85) confirms this overbought condition, signaling that a pullback is increasingly likely. The key support on this timeframe is $4,317.89. A close below this level would invalidate the immediate bullish outlook and could trigger a move towards the next support at $4,274.61. Resistance is seen at $4,387.99, $4,414.81, and $4,458.09. The daily chart, while showing a neutral trend strength of 50% (ADX 27.02), still presents a 'BUY' signal overall. The RSI at 65.51 is healthy, and the Stochastic (K=87.92, D=59.65) is strongly bullish but approaching overbought levels. The key support on the daily chart is $4,207.78, with significant resistance at $4,288.53 and $4,336.66.
The DXY's current price around 99.58 is a crucial factor. While it dipped post-NFP, its consolidation suggests it could resume its upward trend, acting as a drag on gold. The correlation between DXY and XAUUSD is generally inverse. If the DXY finds strong support and begins to rally, it would likely coincide with a correction in gold prices. Conversely, a decisive break below DXY support levels could provide further impetus for gold's rise. Geopolitical events, such as news from the Strait of Hormuz or US-China relations, remain wildcard factors that can inject sudden volatility and safe-haven demand into gold, potentially overriding technical signals in the short term. The recent news flow suggests that while the NFP report was a significant catalyst, the market is still weighing multiple opposing forces. The possibility of a 'fade the NFP reaction' rally, where the initial strong move reverses, cannot be discounted. Therefore, a cautious approach, focusing on confirmation at key levels, is warranted.
Bearish Reversal: Profit-Taking Emerges
30% ProbabilityConsolidation: Range-Bound Trading
40% ProbabilityBullish Continuation: Breakout Confirmed
30% ProbabilityThe Verdict: A Tightrope Walk
The current market environment for XAUUSD is best described as a tightrope walk. The bullish momentum ignited by the surprisingly weak US NFP report is undeniable, pushing gold prices higher and easing fears of aggressive Fed tightening. This fundamental shift, coupled with ongoing geopolitical uncertainties that historically support gold as a safe-haven asset, provides a strong foundation for continued upside. Technical indicators on the 1-hour and 4-hour charts largely confirm this bullish sentiment, with strong ADX readings and generally positive MACD and RSI signals, although the latter two are approaching overbought territory, particularly on the 4-hour timeframe.
However, the bearish counterarguments cannot be ignored. The resilience of the US Dollar Index (DXY), currently consolidating around 99.58, poses a significant headwind. A stronger dollar typically correlates inversely with gold prices, and any renewed strength in the greenback could quickly reverse gold's gains. Furthermore, the overbought readings on the 4-hour and daily Stochastic Oscillators and the RSI on the 4-hour chart (72.44) signal that the market may be due for a correction or consolidation phase. The moderate trend strength on the daily chart (ADX 27.02) also suggests that the current upward move might lack the conviction for a sustained, long-term breakout without further confirmation.
Considering the conflicting signals, the most probable scenario in the immediate short term is consolidation. The market is likely to digest the implications of the NFP data while simultaneously monitoring the DXY's reaction and any fresh geopolitical developments. A neutral trading range between the 1-hour support at $4,330.83 and resistance at $4,341.60 appears plausible. A clear breakout above $4,341.60, confirmed by strong volume and follow-through, would favor the bullish scenario, targeting higher levels. Conversely, a decisive break below $4,330.83, especially if the DXY rallies, would likely trigger a bearish correction. For now, patience and a focus on key levels are paramount. Traders should look for confirmation of a directional move before committing significant capital. The market is at a critical juncture, and while the NFP data provided a bullish catalyst, the path forward remains uncertain, requiring careful risk management and adherence to defined trading plans.
Frequently Asked Questions: XAUUSD Analysis
What happens if XAUUSD breaks above the $4,341.60 resistance level?
A sustained break above $4,341.60 on the 1-hour chart, confirmed by strong volume, would validate the bullish scenario. This could lead to price targets at $4,347.66 (R2) and $4,352.37 (R3), indicating continued upward momentum driven by easing Fed rate hike expectations.
Should I buy XAUUSD at current levels around $4,341.51 given the mixed signals?
Buying at current levels carries risk due to conflicting signals and potential overbought conditions on longer timeframes. A more prudent approach would be to wait for confirmation: either a breakout above $4,341.60 with clear follow-through, or a pullback to support levels like $4,330.83 where a test of bullish conviction could be made with defined risk.
Is the RSI at 67.36 on the 1-hour chart a sell signal for XAUUSD?
An RSI of 67.36 indicates strong upward momentum but is not yet in the overbought territory (typically considered above 70). While it suggests the bullish trend is firm, it also warns that the market is approaching levels where profit-taking could occur, especially if it reaches the 72.44 level seen on the 4-hour chart.
How will the DXY's consolidation around 99.58 affect XAUUSD's price this week?
The DXY's consolidation around 99.58 creates a neutral to slightly bearish outlook for gold due to their inverse correlation. If the DXY finds support and begins to rally, it would likely cap gold's upside potential and could even trigger a correction, especially if geopolitical risks subside.
| Indicator | Value | Signal | Interpretation |
|---|---|---|---|
| RSI (14) | 65.51 | Neutral | Approaching overbought on 4H, but still room on Daily. |
| MACD Histogram | +0.78 | Bullish | Positive momentum continues, above signal line. |
| Stochastic | K:87.92, D:59.65 | Bullish | Approaching extreme overbought on Daily, potential for pullback. |
| ADX | 27.02 | Bullish Trend | Strong trend indicated on Daily, though lower than 1H/4H. |
| Bollinger | Upper Band | Watch | Price pushing upper band, potential for overextension. |
Track markets in real-time
AI-powered analysis, technical indicators and real-time price data.
Join Our Telegram Channel
Breaking market news, AI analysis and trading signals instantly.
Join Channel