

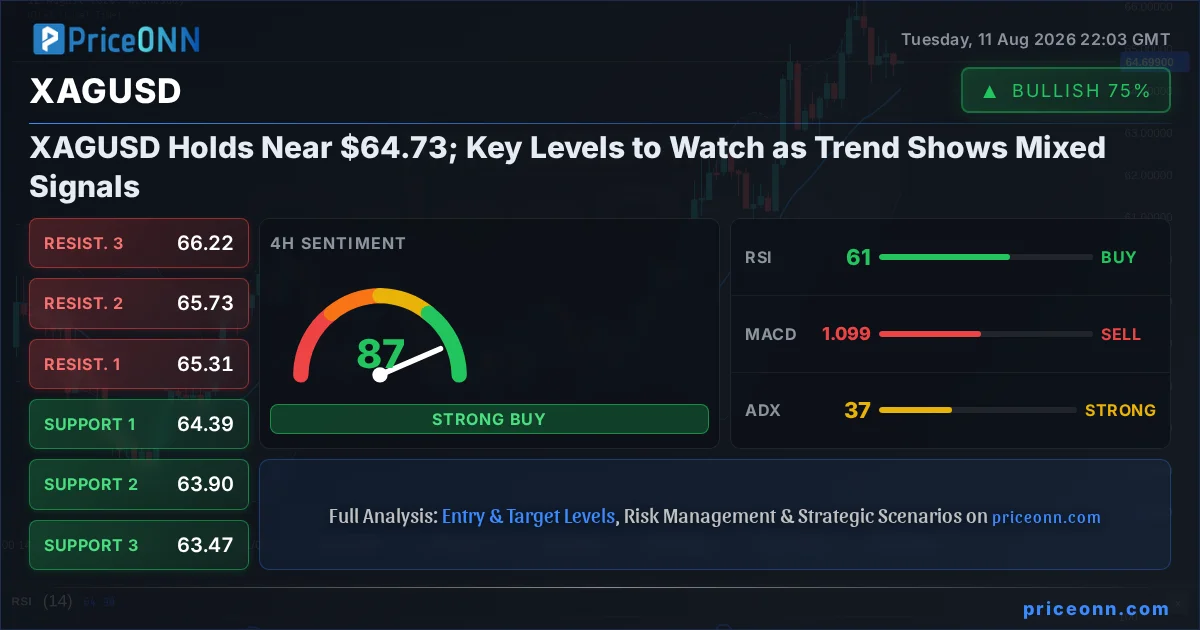
Silver prices are hovering near the critical $64.73 mark, presenting a complex picture for traders navigating a market filled with mixed technical signals and broader macroeconomic crosscurrents. While the 4-hour and daily charts suggest a bullish trend is attempting to assert dominance, the immediate 1-hour timeframe shows signs of weakness, hinting at potential consolidation or a short-term pullback. This divergence demands a closer look at the underlying drivers and specific price levels that will dictate the next significant move for XAGUSD.
- RSI at 61.2 on the daily chart signals a bullish lean, but the 1-hour RSI at 48.33 indicates short-term selling pressure.
- Critical support for XAGUSD is established at $64.45, tested multiple times this week, while resistance looms at $66.84.
- The ADX indicator shows a strong trend (48.5 on 4H, 20.85 on 1H), suggesting volatility is present but directionality is conflicting across timeframes.
- Broader market sentiment, influenced by DXY movements around 99.83 and SP500's ascent to 6572.87, plays a crucial role in silver's price action.
The immediate action in silver is currently painted by conflicting indicators across different timeframes, a common scenario when markets are at a crossroads. On the 1-hour chart, XAGUSD is showing a general 'Sell' signal, with an RSI of 48.33 leaning towards a bearish sentiment, and the Stochastic Oscillator's %K line below its %D line. This suggests that intraday traders might be booking profits or initiating short positions as the price approaches immediate resistance. However, this short-term weakness is contrasted sharply by the medium and longer-term outlooks.
The 4-hour chart paints a more optimistic picture for silver bulls, displaying a strong upward trend (ADX at 48.5) and a general 'Buy' signal. The RSI here stands at a healthy 62.63, well within the neutral-to-bullish territory, and the Bollinger Bands are showing the price comfortably above the middle band, indicating upward momentum. Similarly, the daily chart reinforces this bullish bias, with an ADX of 29.01 confirming a strong trend and an RSI at 66 suggesting further room for upside before reaching overbought conditions. The Stochastic Oscillator on the daily is also showing a bullish crossover, with %K above %D, reinforcing the idea that the larger trend remains intact despite intraday choppiness.
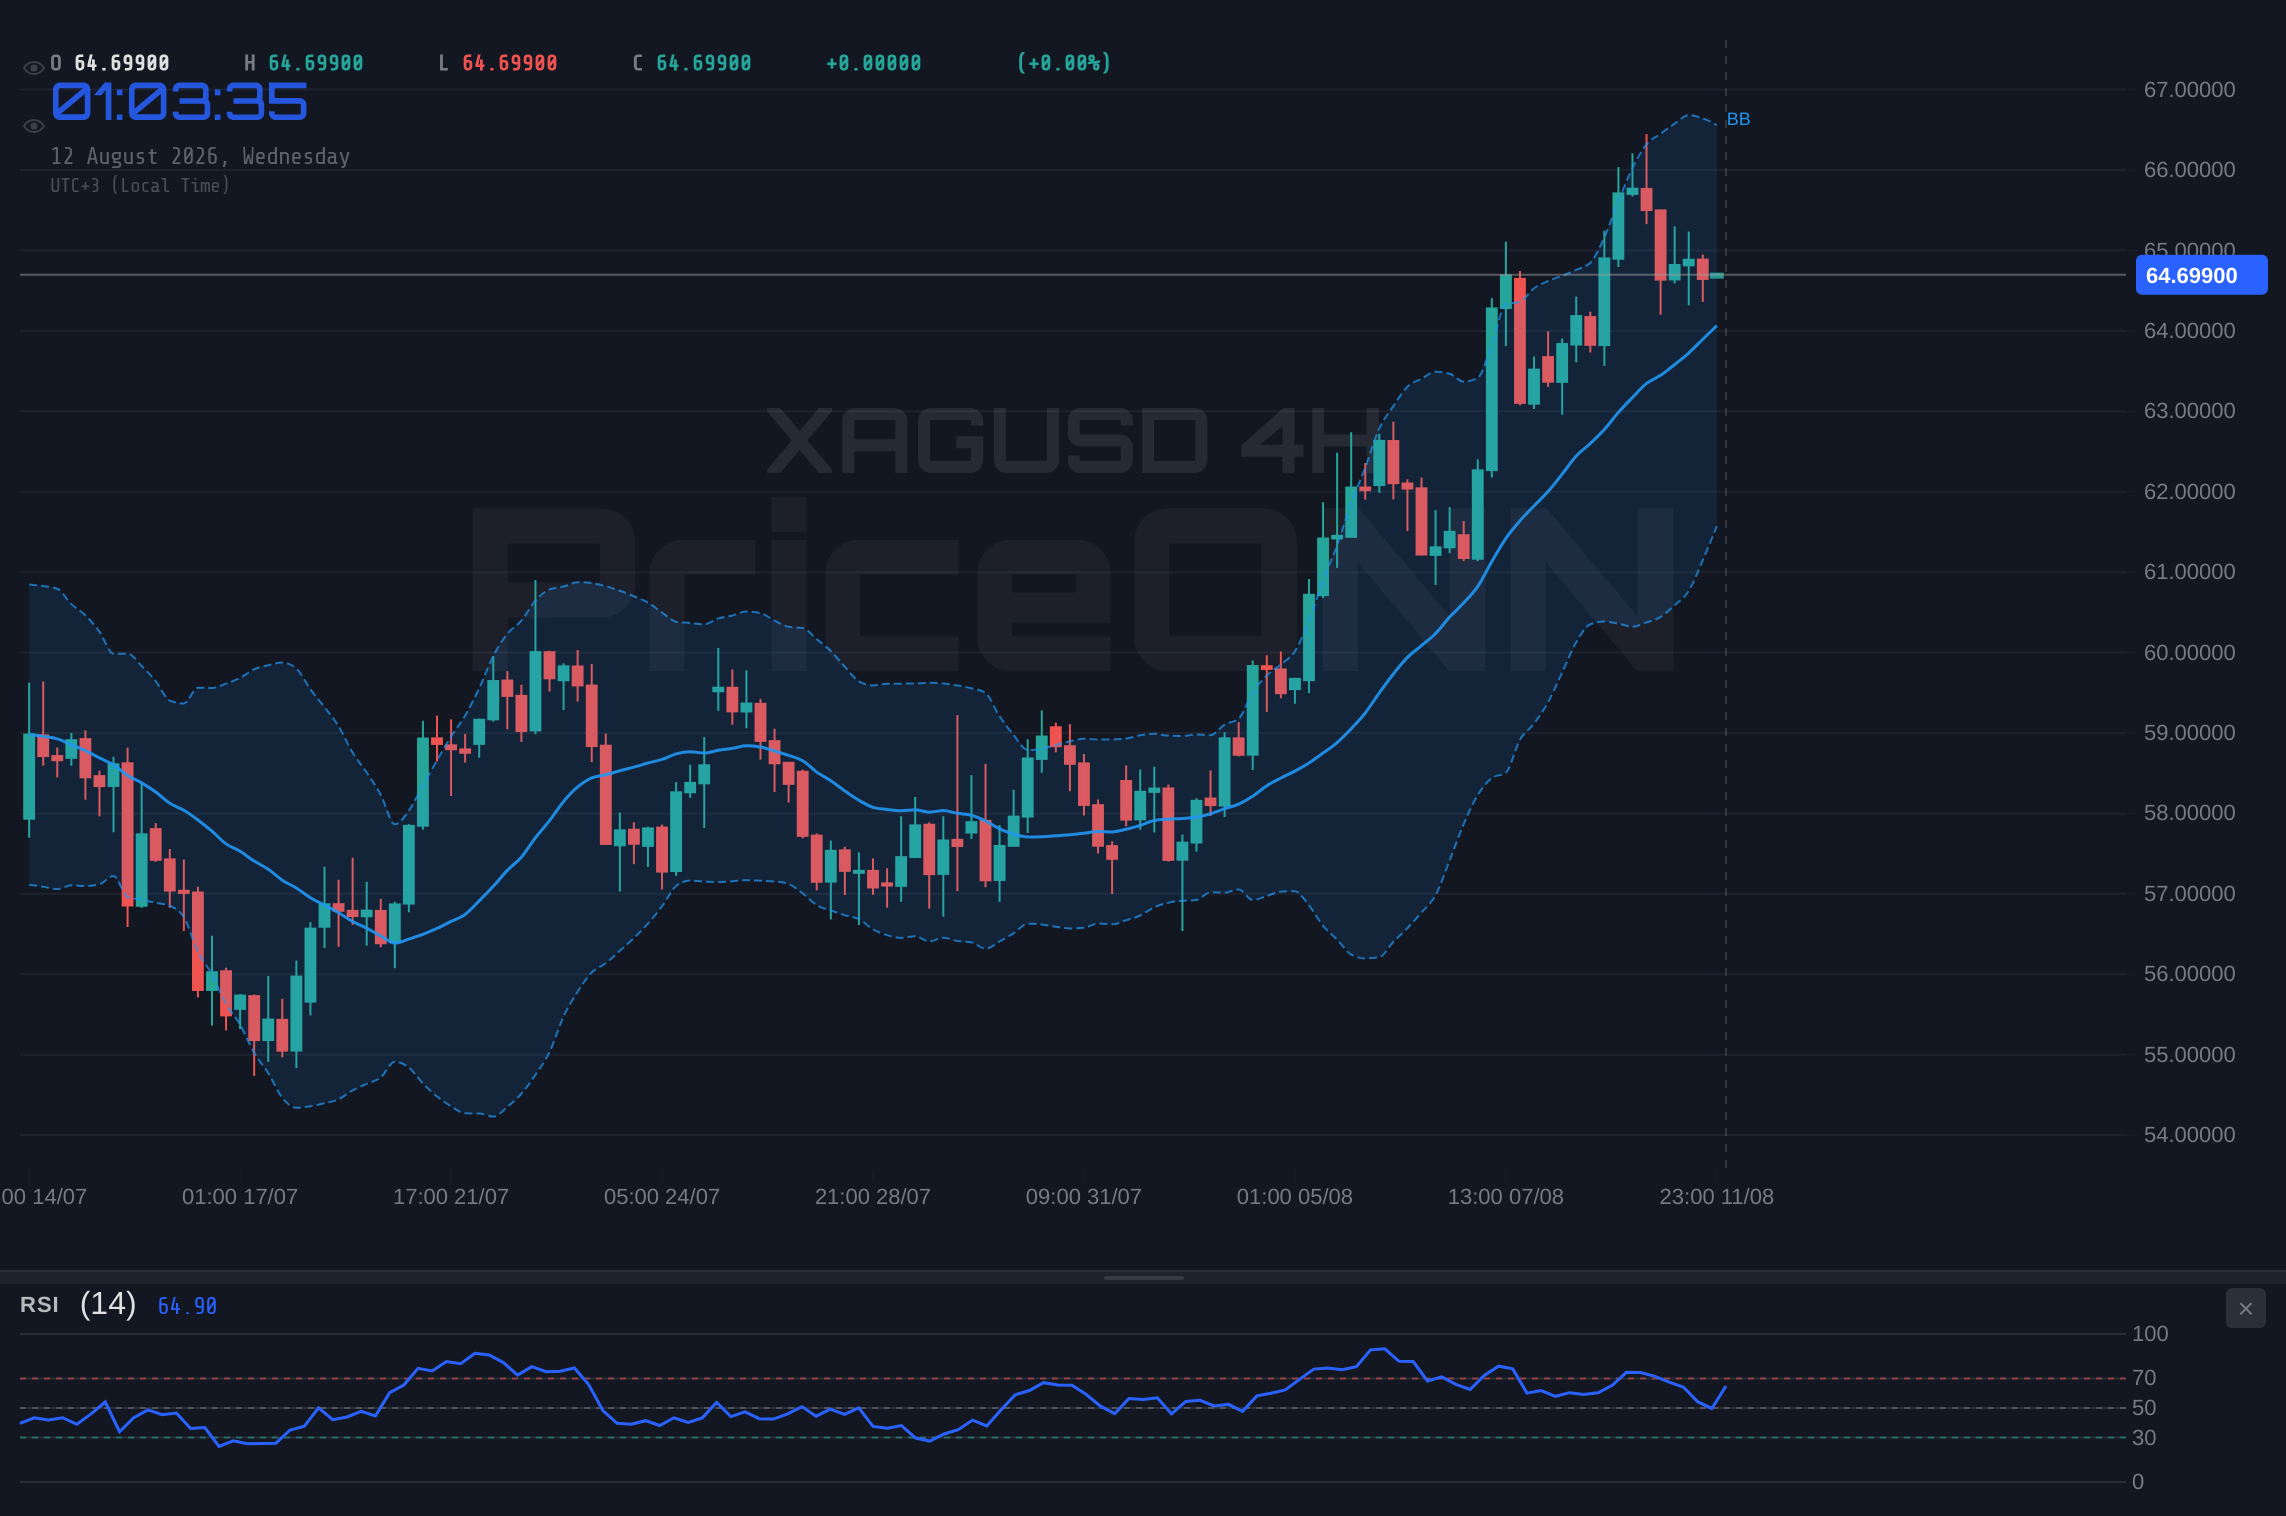
This multi-timeframe divergence is precisely what traders need to pay close attention to. The immediate $64.73 level is crucial, acting as a pivot point. A sustained break above the 1-hour resistance at $64.81 could signal a continuation of the daily bullish trend, potentially targeting the more significant resistance zone around $66.84. Conversely, a failure to hold the immediate support at $64.45, especially with increased selling volume, could lead to a deeper retracement towards the next support level at $64.22. The current market environment, characterized by a strong DXY around 99.83 and a generally positive SP500 at 6572.87, adds another layer of complexity.
The Bull's Roadmap: Targeting Higher Ground
For silver bulls, the path forward hinges on overcoming the immediate intraday selling pressure and re-establishing control. The primary trigger for a bullish continuation would be a decisive close above the 1-hour resistance at $64.81, ideally with increasing volume. This would confirm that the short-term bearish signals are being overwhelmed by the stronger daily trend. Following such a breakout, the next logical target would be the 4-hour resistance level at $65.22, a level that has historically acted as a significant barrier. A successful breach of this level would then open the door to the more substantial daily resistance at $66.84.
The confirmation of this bullish scenario would be bolstered by a sustained uptrend in the ADX across all timeframes, coupled with RSI levels remaining in the bullish territory (above 60) on the 4-hour and daily charts. If XAGUSD can maintain its position above the 4-hour support at $64.51, it would suggest strong underlying buying interest. The momentum from a strong upward move in the SP500 and a weakening DXY would further validate this outlook. The key here is patience; waiting for the confirmation of the breakout above immediate resistance, rather than chasing the price, is paramount for a favorable risk-reward setup.
Where Bears Take Control: The Downside Risk
On the flip side, the bearish scenario for XAGUSD gains traction if the price fails to sustain its current levels and breaks below the immediate intraday support. The 1-hour chart's 'Sell' signal, coupled with negative MACD momentum and a falling RSI, suggests that bears are actively defending higher prices. A decisive break below the 1-hour support at $64.45 would be the first warning sign. If this level gives way, the next significant test would be the 4-hour support at $64.19. A break below this level would strongly indicate a potential reversal, targeting the daily support at $63.77.
The invalidation of the bullish thesis would occur if XAGUSD closes below the 4-hour support at $64.19, especially if accompanied by a surge in selling volume and a strengthening DXY. In such a scenario, the ADX reading on the 1-hour chart, currently at 22.7, might start to climb, indicating a developing downtrend. A confluence of bearish signals across multiple timeframes - such as RSI falling below 50 on the daily chart or MACD crossing below its signal line on the 4-hour chart - would further solidify the bearish outlook. This scenario becomes more probable if geopolitical tensions escalate or if upcoming economic data, such as inflation reports, suggest a more hawkish stance from central banks.
The Waiting Game: Consolidation and Range-Bound Action
It's also entirely possible that XAGUSD will enter a period of consolidation, especially given the conflicting signals across timeframes. A neutral scenario would typically involve the price trading within a defined range, unable to decisively break through key support or resistance levels. In this case, the immediate resistance at $64.81 and support at $64.45 would become the boundaries of this range. The ADX readings, which are currently showing trend strength but differing directions, could potentially decline as the market struggles to find a clear direction.
During a consolidation phase, traders might see choppy price action with frequent false breakouts. The 1-hour chart's indicators might oscillate around the neutral zone, and the overall 'General Signal' across timeframes could shift between 'Buy' and 'Sell' without conviction. This indecision often occurs when markets are awaiting a significant catalyst, such as key economic data releases or major geopolitical developments. The upcoming CPI report, for instance, could be the event that finally breaks silver out of its potential range, forcing a clearer directional move. Until then, patience and adherence to strict risk management within the defined range would be the most prudent approach.
Probabilities and What to Watch
Considering the strength of the daily and 4-hour bullish trends, albeit with short-term headwinds, the most likely scenario in the medium term appears to be a continuation of the upward move, but with significant caution required. I assign a 55% probability to the bullish scenario, where XAGUSD breaks out of its immediate range and targets higher resistance levels. The neutral/consolidation scenario holds a 35% probability, reflecting the current indecision and the potential for price to remain range-bound until a catalyst emerges.
The bearish scenario, while less probable in the medium term due to the stronger daily trend, cannot be dismissed entirely and carries a 10% probability. This probability increases significantly if key support levels are breached decisively or if macroeconomic conditions shift dramatically. The key triggers to watch this week will be the closing price relative to the $64.73 pivot, the outcome of the upcoming CPI report, and the direction of the US Dollar Index (DXY). Any significant movement in these factors could rapidly alter the landscape for silver.
The Bull's Roadmap
Bullish Scenario: Breaking Free
55% ProbabilityWhere Bears Take Control
Bearish Scenario: The Reversal Threat
10% ProbabilityThe Waiting Game: Consolidation Phase
Neutral Scenario: Range-Bound Indecision
35% ProbabilityThe interplay between precious metals and broader market sentiment is always a critical factor. Gold, trading near $4371.65, has seen some upward momentum recently, partly driven by expectations that the Federal Reserve might hold interest rates steady, especially with inflation data on the horizon. This correlation means that any significant moves in gold can often spill over into silver. Currently, gold's daily RSI at 66 suggests room for upside, aligning somewhat with silver's daily bullish leanings, but its 1-hour RSI at 47.81 mirrors silver's short-term weakness. This suggests that while the larger trend for precious metals might be positive, immediate gains could be capped by profit-taking or cautious positioning ahead of key economic events.
The US Dollar Index (DXY), currently hovering around 99.83, acts as a significant counterpoint. A strengthening dollar typically puts downward pressure on dollar-denominated commodities like silver. The DXY's daily chart shows a bearish trend (ADX 28.85), with an RSI at 40.35 indicating potential for further downside. If the dollar continues to weaken, it would naturally provide a tailwind for XAGUSD. However, the 1-hour and 4-hour DXY charts show a more neutral-to-bullish stance, suggesting that the dollar might find some footing, adding to the complexity of silver's price action. Traders are closely watching the DXY's ability to break below its key daily support level of 99.65.
Equity markets, represented by the SP500 at 6572.87, are currently showing strength with a bullish 1-hour trend. A risk-on environment, where equities rally, can sometimes lead to increased demand for riskier assets, potentially drawing capital away from safe havens like silver. Conversely, if the SP500 were to falter, especially after its strong daily performance, it could signal a shift towards risk aversion, which typically benefits precious metals. The Nasdaq 100's current position near 29541.5, showing a mixed 4-hour signal and a bearish 1-hour trend, adds to this nuanced picture of market sentiment. The divergence between the SP500's bullishness and Nasdaq's mixed signals warrants attention.
Looking ahead, the most significant event on the horizon is the upcoming CPI report. Historically, inflation data has been a major catalyst for precious metals, influencing central bank policy expectations and, consequently, currency movements. If the CPI data comes in hotter than expected, it could reignite inflation concerns, potentially leading to a more hawkish stance from the Federal Reserve and strengthening the DXY. This would likely put significant pressure on XAGUSD. Conversely, cooler-than-expected inflation figures could solidify expectations of a Fed pause or even a rate cut, weakening the dollar and providing a strong bullish catalyst for silver.
The current technical setup on XAGUSD, particularly the conflicting signals between short-term and longer-term timeframes, suggests a market at a pivotal point. The battle between intraday bears and the established daily bullish trend is the primary narrative. The key levels to watch remain $64.45 for support and $64.81 for immediate resistance on the hourly chart, with more significant levels at $64.19 and $65.22 respectively on the 4-hour timeframe. A clear break above $64.81, confirmed by volume and sustained price action, would open the path towards $66.84. However, failure to hold $64.45 could lead to a test of lower supports, making risk management paramount for any trader positioning themselves in this market.
Frequently Asked Questions: XAGUSD Analysis
What happens if XAGUSD breaks above the $64.81 immediate resistance level?
If XAGUSD closes decisively above $64.81 on the 1-hour chart with strong volume, it would likely trigger further buying pressure. This could propel the price towards the next significant resistance at $65.22, aligning with the bullish trend observed on the 4-hour and daily charts.
Should I buy XAGUSD at current levels near $64.73 given the mixed RSI signals?
Buying at current levels requires caution due to conflicting RSI readings (48.33 on 1H vs. 61.2 on 1D). A more prudent approach would be to wait for a clear breakout above $64.81 or a confirmed bounce from the $64.45 support, offering a better risk-reward ratio.
Is the RSI at 61.2 on the daily chart a sell signal for XAGUSD?
An RSI of 61.2 on the daily chart is not typically considered a sell signal; it indicates a lean towards bullish momentum without being in overbought territory. However, the contrasting RSI of 48.33 on the 1-hour chart suggests short-term weakness or consolidation.
How will the upcoming CPI report affect XAGUSD this week?
The CPI report is a critical catalyst. Higher-than-expected inflation could lead to a stronger DXY and pressure XAGUSD downwards, while softer inflation might weaken the dollar and boost silver prices towards its key resistance levels.
Track markets in real-time
AI-powered analysis, technical indicators and real-time price data.
Join Our Telegram Channel
Breaking market news, AI analysis and trading signals instantly.
Join Channel