

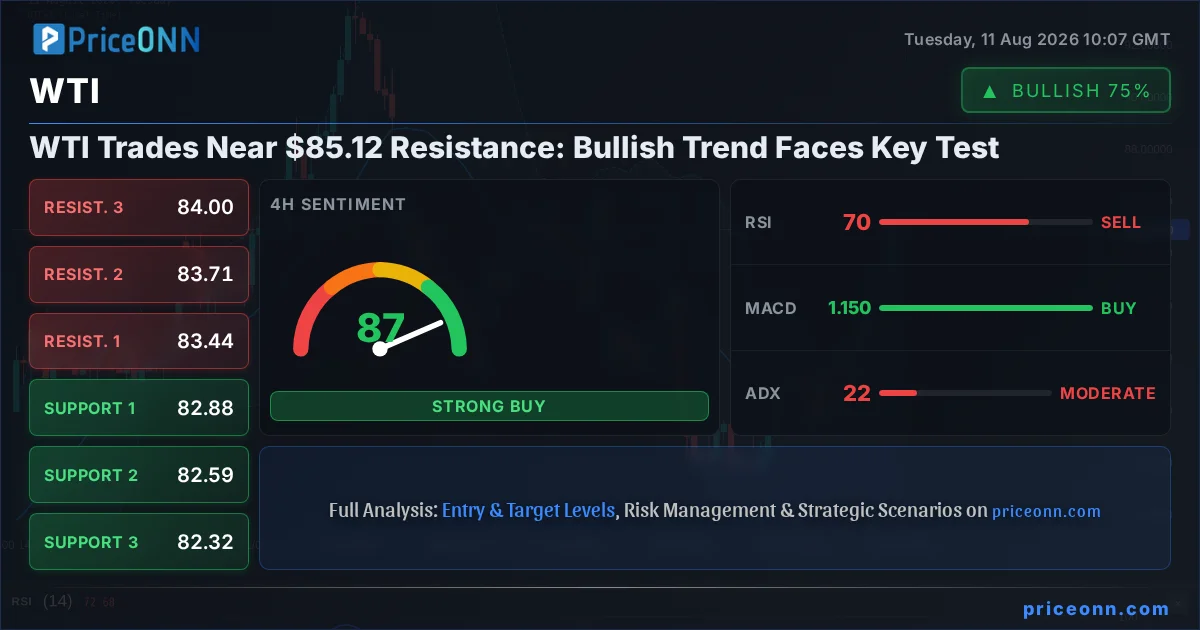
The price of WTI crude oil is currently hovering near the critical resistance level of $85.12. This juncture presents a pivotal moment for the commodity, with its recent bullish momentum facing a stern test. Understanding the interplay of technical indicators, macroeconomic factors, and geopolitical undercurrents is paramount for navigating this complex market landscape. As traders and analysts scrutinize the charts, the question isn't just about direction, but about the conviction behind any potential move. The ADX at 21.53 suggests a moderate trend is in play, but the confluence of RSI readings and MACD signals indicates a nuanced picture that demands careful interpretation. This analysis delves into the potential pathways forward, examining the bullish, bearish, and neutral scenarios that could unfold.
- WTI crude oil is trading at $85.12, testing key resistance levels.
- The ADX reading of 21.53 indicates a moderate trend, with RSI and MACD showing mixed signals.
- Critical support for WTI is observed around $84.09, while resistance looms near $85.51.
- Geopolitical tensions and broader market sentiment, particularly the DXY's movement, are key drivers influencing WTI's trajectory.
The Bull's Roadmap: Pushing Past $85.12
For the bulls to maintain control, a decisive breach above the immediate resistance at $85.51 is crucial. This level, currently acting as a ceiling, represents the immediate hurdle that needs to be cleared to validate further upside potential. If WTI can establish a firm footing above $85.51, the next psychological and technical target would be the $85.76 mark. Beyond that, the path opens up towards the $86.22 resistance level. Such a move would likely be catalyzed by a combination of factors: a weaker US Dollar Index (DXY), a surge in risk appetite reflected in the S&P 500 and Nasdaq, or significant geopolitical escalation that tightens global oil supply expectations. The 1H chart shows a strong bullish trend with RSI at 81.39, indicating aggressive buying pressure, although it signals an overbought condition that warrants caution for immediate entries. The MACD is positive and above its signal line, supporting the bullish momentum, while Stochastic oscillators are also in overbought territory, suggesting that while the trend is up, the pace might be unsustainable without a pause.
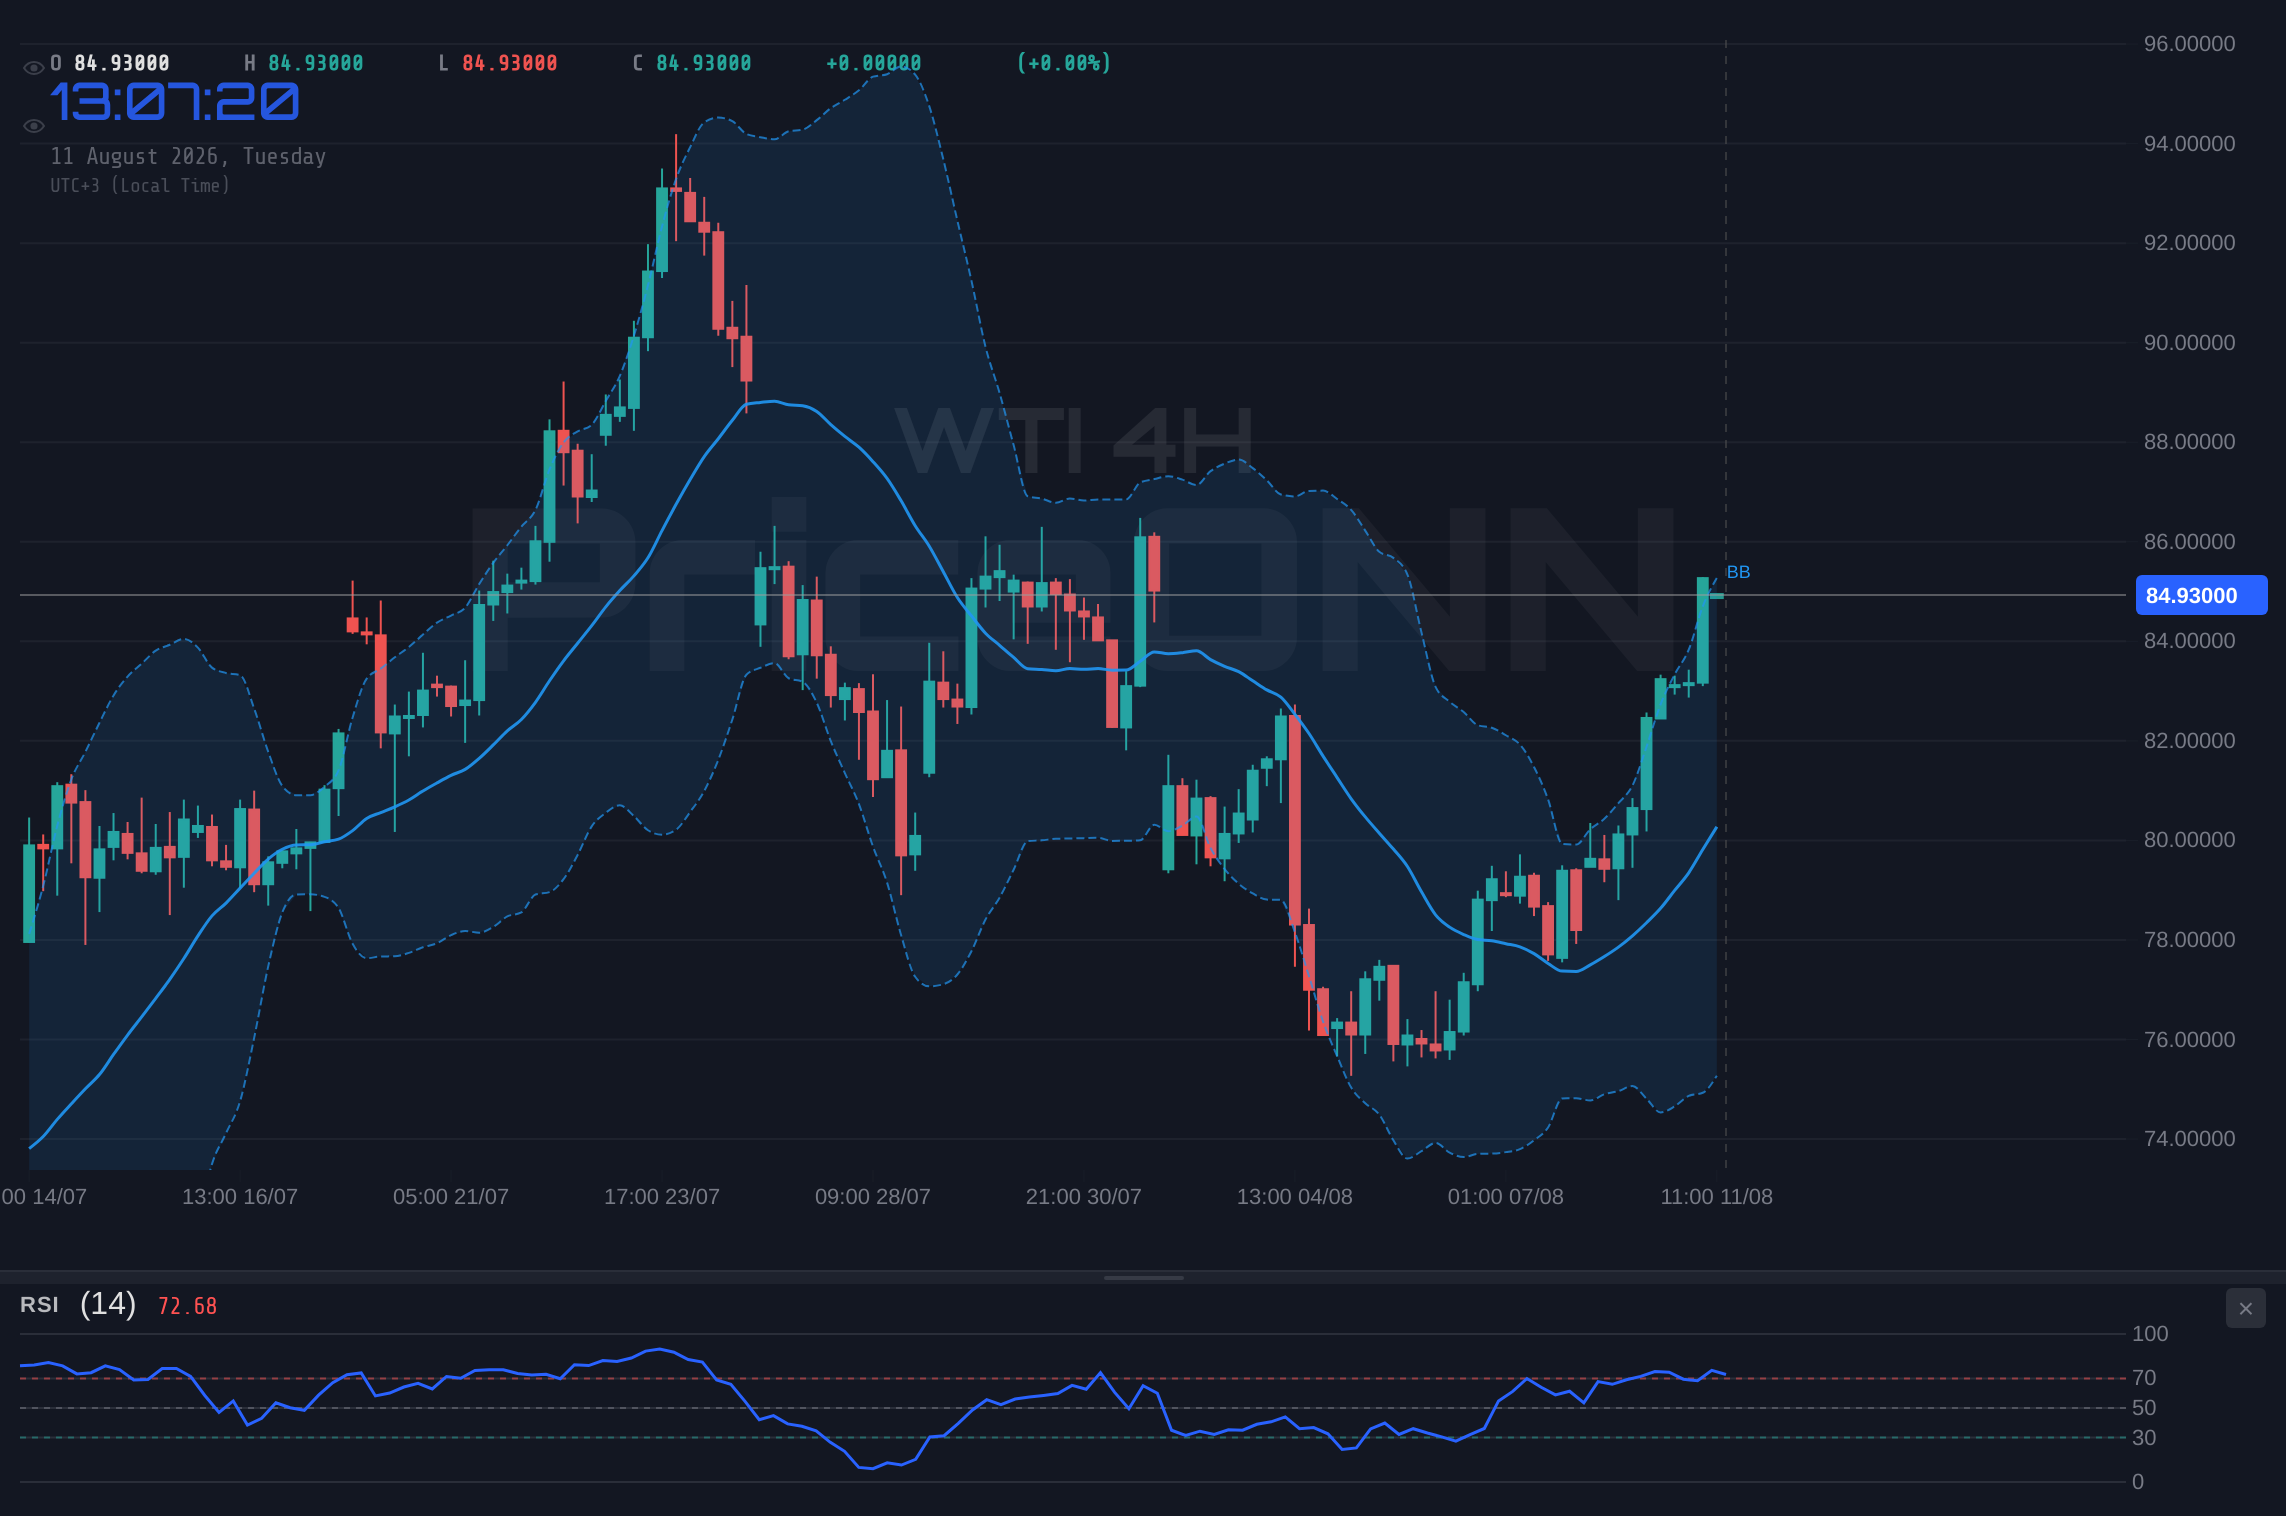
The 4H timeframe offers a slightly more tempered view, with RSI at 70.69 still in overbought territory but less extreme than the 1H. The MACD remains positive, and Bollinger Bands are pushing higher, indicating an upward bias. However, the ADX at 22.42 suggests a moderate, rather than a strong, upward trend on this timeframe. This divergence between the aggressive signals on the 1H and the more moderate stance on the 4H highlights the need for confirmation. A sustained close above $85.51, ideally accompanied by increasing trading volume, would be the most convincing signal for a continuation of the bullish trend. The daily chart, while showing a bullish trend with a strength of 90%, has an ADX of only 19.75, indicating a weaker trend despite the bullish bias. This suggests that the current rally might lack the sustained conviction needed for a major breakout without further fundamental catalysts.
Where Bears Take Control: Testing Support Levels
Conversely, if WTI fails to sustain its upward momentum and breaks below the immediate support at $84.80, the bears could seize control. The first significant level to watch on the downside is $84.34, followed by the more robust support at $84.09. A decisive break below $84.09 would signal a potential shift in sentiment and could trigger further selling pressure, targeting lower levels such as $83.71 and potentially $83.44. Such a bearish development could be driven by a strengthening US Dollar (DXY is currently at 99.89, but a move higher could pressure oil), easing geopolitical tensions in the Middle East, or news of increased oil production or strategic reserve releases. The technical indicators on the 1H chart, despite showing strong upward momentum, are flashing overbought warnings. A reversal here could be sharp. The RSI at 81.39 and Stochastic at 95.73 suggest that the market is ripe for a pullback if resistance holds. The MACD, while positive, could see a bearish crossover if selling pressure intensifies.
On the 4H chart, the ADX at 21.53 points to a moderate trend, meaning a breakdown from current levels is plausible if key support gives way. The daily chart's ADX of 19.83 further supports the idea that the current upward trend might be fragile. If WTI falls below $84.09, it would likely indicate that the market is reassessing the fundamental drivers, perhaps pricing in a de-escalation of geopolitical risks or a slowdown in global demand. The daily RSI at 55.34 is in neutral territory, offering room for decline, and the MACD is currently showing negative momentum, which could accelerate on a breakdown. Traders will be watching the interplay between the dollar's strength and any supply-side news very closely in this scenario.
The Waiting Game: Consolidation Around $85.12
A neutral scenario, where WTI trades within a defined range, is also a strong possibility given the mixed signals across different timeframes. Price action around the $85.12 mark, caught between the immediate resistance at $85.51 and support at $84.80, could lead to a period of consolidation. This phase might occur if the market awaits clearer fundamental direction, such as crucial economic data releases or definitive geopolitical updates. During consolidation, indicators often become less directional. On the 1H chart, while the trend is strong, the overbought RSI and Stochastic readings suggest a potential pause. The ADX at 51.01 on the 1H indicates a very strong trend, which usually argues against consolidation, but this could be a temporary plateau before the next move. However, the daily ADX of 19.75, signaling a weak trend, lends more credence to the possibility of a range-bound market in the medium term.
If WTI remains range-bound, we might see the price oscillate between the $84.09 support and the $86.22 resistance. This sideways movement could be characterized by lower trading volumes and indecisive indicator signals. The MACD might hover around its signal line, and RSI could fluctuate within the 40-70 range. Such consolidation phases are often characterized by 'stop hunts' on either side of the range before a decisive breakout occurs. The market sentiment, currently influenced by both bullish drivers (geopolitics, supply concerns) and bearish counterweights (potential inflation cooling, DXY strength), is likely to remain divided, leading to this indecisive price action. Investors might adopt a 'wait-and-see' approach, anticipating a clearer catalyst to drive the price decisively in one direction.
Most Likely Scenario: A Cautious Bullish Outlook
Considering the current technical and fundamental landscape, the most likely scenario appears to be a continuation of the cautious bullish trend, albeit with significant potential for volatility and pullbacks. The 1-hour and 4-hour charts exhibit strong bullish momentum, with positive MACD readings and RSI above 65, suggesting underlying buying interest. The daily chart's bullish trend signal further supports this outlook. However, the overbought conditions on the 1H and 4H Stochastic oscillators, coupled with the moderate ADX readings on the 4H and daily charts (22.42 and 19.75, respectively), indicate that the rally may not be sustainable without consolidation or minor corrections. The key will be how WTI reacts to the $85.12 price point and the immediate resistance at $85.51.
A probable path forward involves WTI consolidating or experiencing a minor pullback towards the $84.09 support level in the short term, allowing indicators to reset from overbought conditions. Following this, if the bullish fundamental drivers (geopolitical tensions, strong demand signals, or supply constraints) persist, WTI could then attempt to break through the $85.51 resistance and target higher levels. The probability of this scenario playing out is estimated at around 60%. The bearish scenario, while possible, requires a significant shift in market sentiment or a clear de-escalation of geopolitical risks, estimated at 30%. The neutral, range-bound scenario occupies the remaining 10%, likely serving as a precursor to a more decisive move.
Bullish Scenario: Sustained Momentum
60% ProbabilityBearish Scenario: Resistance Holds Firm
30% ProbabilityNeutral Scenario: Range-Bound Consolidation
10% ProbabilityWhat I'm Watching This Week
This week, the market's attention will be sharply focused on several key catalysts that could dictate WTI's path. Firstly, the US Dollar Index (DXY) movement will be critical. With the DXY currently at 99.89, any significant shift, particularly a move towards the 100 mark or higher, could exert downward pressure on oil prices. Conversely, weakness in the dollar, perhaps triggered by dovish commentary from the Fed or disappointing US economic data, would likely provide a tailwind for WTI. Secondly, geopolitical developments in the Middle East remain a constant wildcard. Any news suggesting de-escalation could lead to a price correction, while escalating tensions would almost certainly drive prices higher, potentially breaking through current resistance levels. Finally, upcoming economic data, particularly any indicators related to global demand or inflation, will be closely watched. While no specific high-impact events are listed for the immediate week, the general economic outlook and central bank rhetoric will play a significant role in shaping market sentiment.
The technical picture on WTI adds another layer of complexity. The 1H chart shows strong bullish signals but is overbought, suggesting a potential for a short-term pullback. The failure to decisively break above $85.51 could lead to a test of the $84.09 support. Therefore, traders should closely monitor price action around these key levels. A confirmed break above resistance, supported by volume and positive macro cues, would signal a continuation of the bullish trend. Conversely, a breakdown below support, especially if accompanied by dollar strength or easing geopolitical fears, could signal a more significant correction. Patience and risk management remain paramount as the market navigates these competing forces.
Frequently Asked Questions: WTI Analysis
What happens if WTI breaks above the $85.51 resistance level?
If WTI breaks decisively above $85.51, it would likely trigger further buying, targeting the $85.76 level and potentially extending towards $86.22. This scenario is more probable if the US Dollar weakens and geopolitical risks remain elevated.
Should I buy WTI at current levels around $85.12 given the RSI at 81.39?
Buying at current levels with the 1H RSI at 81.39 is risky due to overbought conditions. A pullback to $84.09 support is possible. A more prudent approach might be to wait for a pullback and confirmation, or a clear break above $85.51.
Is the ADX at 21.53 a sell signal for WTI right now?
An ADX of 21.53 on the daily chart indicates a moderate trend, not necessarily a sell signal. While it suggests the trend lacks strong conviction, it doesn't negate the bullish bias. It highlights that the market could be consolidating or preparing for a move in either direction.
How will DXY's movement affect WTI this week?
The DXY is currently at 99.89. A strengthening DXY typically pressures oil prices like WTI, as dollar-denominated commodities become more expensive for holders of other currencies. Conversely, a weaker dollar would likely support WTI's price, especially if geopolitical tensions remain.
Technical Outlook Summary
| Indicator | Value | Signal | Interpretation |
|---|---|---|---|
| RSI (14) | 81.39 | Overbought | Potential for pullback or consolidation on 1H chart. |
| MACD Histogram | Positive | Bullish Momentum | Supports upward trend on 1H and 4H. |
| Stochastic | 95.73 / 81.77 | Extreme Overbought | Suggests a short-term reversal or consolidation is due. |
| ADX | 51.01 | Very Strong Trend | Indicates strong momentum on 1H, but daily ADX is weaker. |
| Bollinger | Upper Band | Breakout/Overbought | Price above upper band on 4H indicates strong upward pressure. |
Track markets in real-time
AI-powered analysis, technical indicators and real-time price data.
Join Our Telegram Channel
Breaking market news, AI analysis and trading signals instantly.
Join Channel