

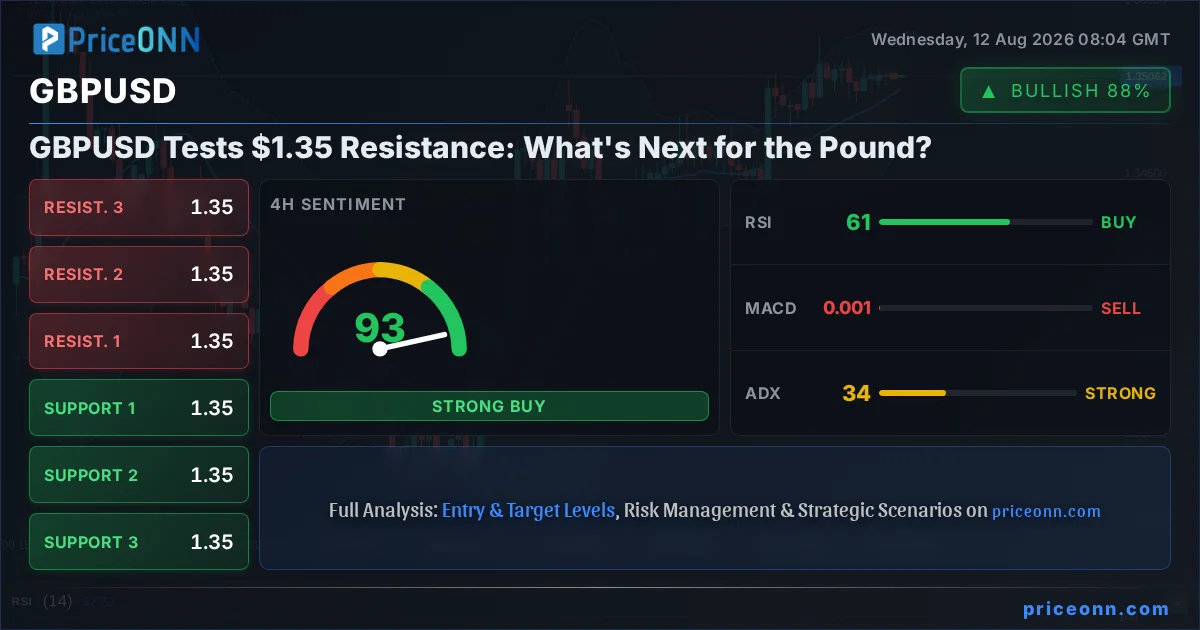
Having navigated a complex landscape of shifting central bank expectations and geopolitical undercurrents, the GBPUSD pair is currently hovering around the critical $1.35 mark. This isn't just another trading session; it's a pivotal moment where the narrative surrounding the pound's next move is being written by cautious traders and the ever-present specter of upcoming economic data. For those watching the pound's dance with the dollar, the question isn't *if* a significant move will happen, but *when* and in which direction. The current price action suggests a market holding its breath, with multiple indicators painting a nuanced, albeit intriguing, picture. This analysis dives deep into the technicals, the broader market correlations, and the crucial data points that will likely dictate the trajectory of GBPUSD in the near future.
- RSI at 60.5 signals a neutral-to-bullish leaning, but not yet overbought territory for GBPUSD.
- Critical resistance sits at $1.35214, a level tested multiple times this week.
- ADX at 33.69 indicates a strong trend is building, suggesting a potential breakout is imminent.
- Market sentiment is cautiously optimistic, with correlations to DXY and broader risk appetite playing a key role.
The recent uptick in GBPUSD, pushing it towards the $1.35 level, is a testament to a market that's trying to find its footing amidst a sea of competing forces. While the daily chart suggests a bullish trend with an ADX reading of 33.69, indicating a strong trend is indeed in play, the intraday indicators offer a more tempered view. The 1-hour RSI at 53.77 sits squarely in neutral territory, showing no immediate signs of overheating, while the Stochastic Oscillator's %K line crossing below the %D line at 58.55/59.27 hints at potential short-term pullback or consolidation. This divergence between the longer-term trend strength and the intraday signals is precisely where the opportunity lies for astute traders. It suggests that while the underlying momentum might be bullish, the immediate path forward could involve some choppy price action as the market digests current levels and awaits clearer direction from upcoming economic releases.
Understanding the broader market context is paramount here. The Dollar Index (DXY) is currently trading at 99.89, showing a slight uptick. Historically, a strengthening DXY tends to put pressure on major currency pairs like GBPUSD. However, the current dynamic isn't a simple inverse correlation. While the DXY is showing a bullish trend on the 1-hour and 4-hour charts, its daily trend is bearish, suggesting underlying weakness that could prevent it from significantly derailing the pound's progress. This nuanced relationship means that while a strong dollar could cap upside for GBPUSD, it might not be the dominant force it often is, especially if the market is pricing in other factors more heavily.
Furthermore, the recent market news highlights a growing divergence in asset performance. Gold, for instance, has been rallying towards $4,406.93, signaling a potential increase in safe-haven demand or inflation hedging. This rally in gold, even as oil prices like Brent crude edge higher towards $87.81, suggests that market participants are anticipating certain economic outcomes, possibly a Fed pause or a cooling inflation trend, that would support precious metals. The fact that GBPUSD is also showing resilience, if not outright strength, implies that the market might be differentiating between currency plays and commodity plays, or perhaps anticipating a scenario where a strong dollar doesn't necessarily derail other asset classes. The news about EUR/USD and GBP/USD awaiting inflation data underscores the sensitivity of these pairs to upcoming economic reports, making August 12th a crucial date on the calendar.
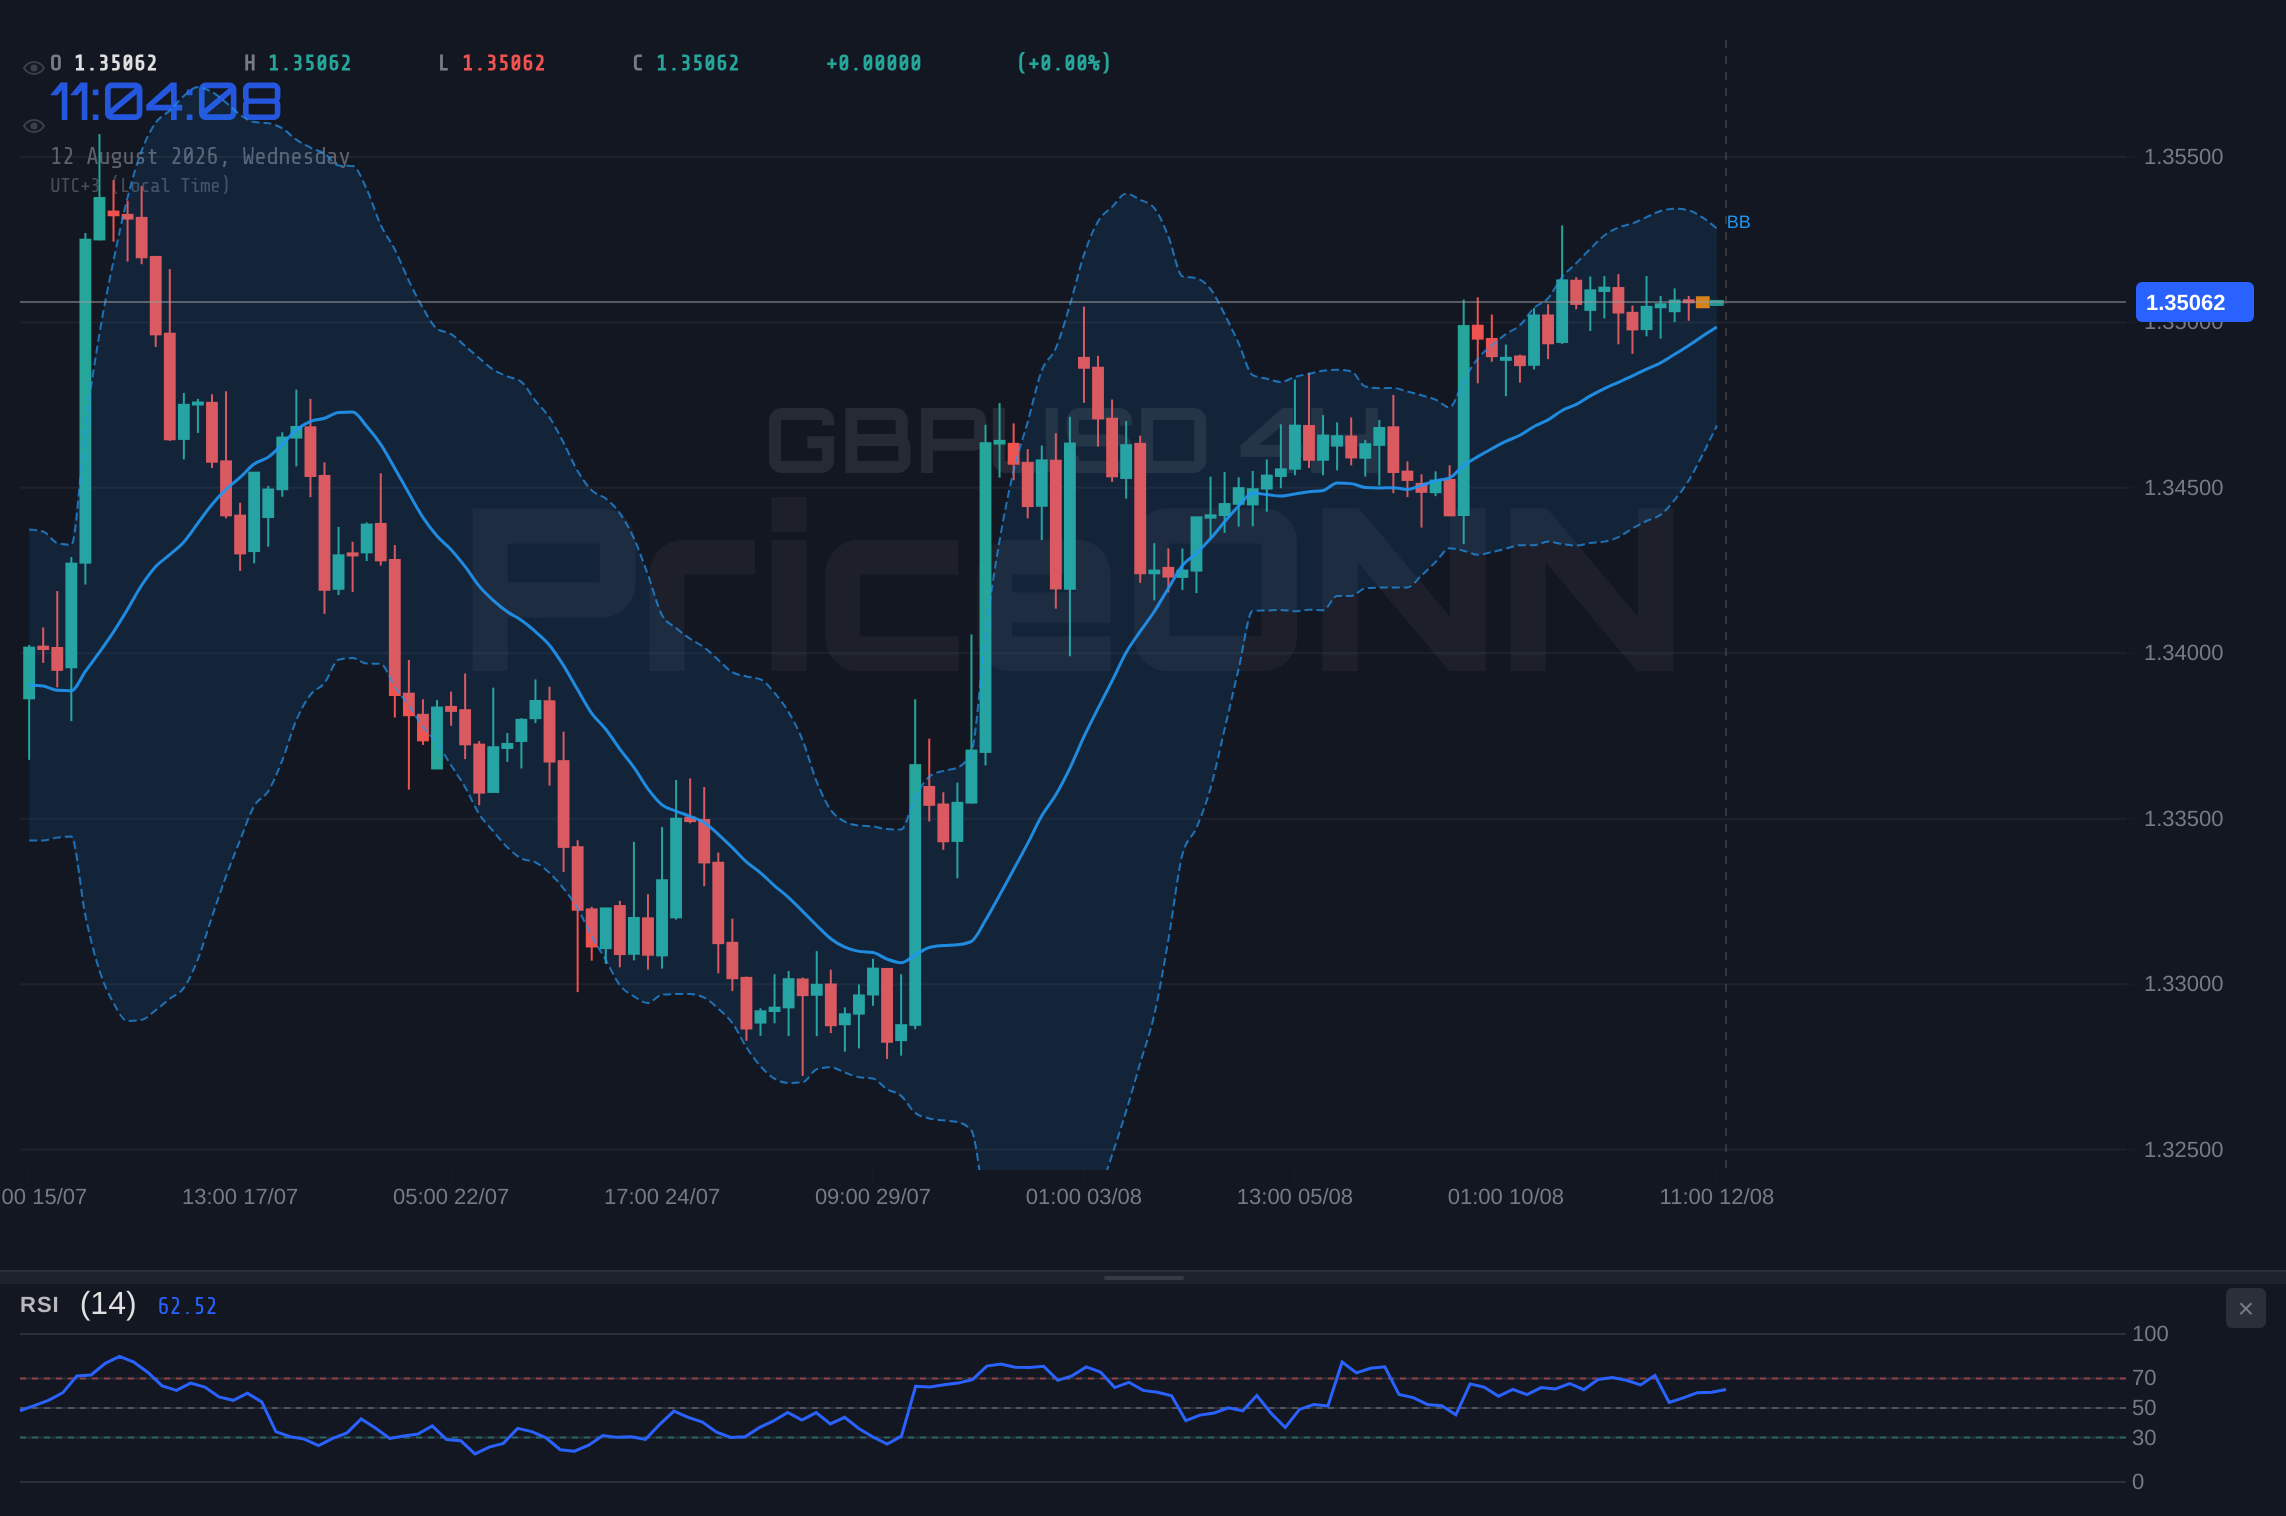
Looking at the technicals on the 4-hour chart for GBPUSD, the picture becomes slightly more bullish. The trend is marked as 'Yükseliş' (Uplift) with a power rating of 92%, and the ADX at 33.69 confirms a strong upward trend. The RSI at 60.95 is in the neutral zone, leaning towards bullish, and the Stochastic Oscillator, despite a brief dip, shows %K (49.1) moving above %D (46.63), hinting at renewed upward momentum. The Bollinger Bands are also showing the price trading above the middle band, reinforcing the bullish sentiment. However, the resistance level at $1.35214 remains a significant hurdle. A sustained break and hold above this level would be a strong signal for further upside, potentially targeting the next resistance at $1.35473. Conversely, failure to breach this level could lead to a pullback towards the support at $1.3501, a level that has shown resilience in recent trading sessions.
The daily timeframe for GBPUSD presents a strong bullish case, with the trend classified as 'Yükseliş' (Uplift) and an ADX of 23.46 indicating a moderately strong trend. The RSI at 60.51 is comfortably in neutral territory, suggesting room for further appreciation without immediate overbought conditions. The MACD is showing positive momentum, and the Stochastic Oscillator, with %K at 87.13 and %D at 83.8, is entering the overbought zone. This Stochastic reading is a key point of caution; while the overall trend is bullish, the overbought condition suggests that a period of consolidation or a minor pullback could occur before the next leg of the rally, if it materializes. The key is to watch how the price reacts around the daily resistance of $1.35166. A decisive break above this level, coupled with sustained momentum, could pave the way for further gains, but the overbought Stochastic warrants vigilance against potential profit-taking.
When we dissect the price action on the 1-hour chart, the narrative shifts slightly towards caution. The trend is neutral, the RSI is at 45.32, indicating a bearish inclination in the very short term, and the MACD momentum is described as 'balancing'. The Stochastic Oscillator is firmly in oversold territory with %K at 26.34 and %D at 32.84, suggesting a potential bounce is due, but the overall trend strength (ADX 17.21) is weak. This suggests that any short-term upward movement might be a corrective bounce rather than the start of a sustained trend. The immediate resistance is at $1.3535, and a break above it would be needed to challenge the higher levels. However, with the daily and 4-hour charts showing bullish potential, this 1-hour bearish lean might just be a temporary pause before the larger trend reasserts itself. It highlights the importance of using multi-timeframe analysis to avoid getting caught on the wrong side of a short-term fluctuation.
The interplay between GBPUSD and other major currency pairs also offers valuable insights. EURUSD, for instance, is trading at 1.15368, showing a slight daily decline. Its 1-hour and 4-hour charts indicate a bearish bias, while the daily chart is bullish. This mixed picture in the Eurozone's flagship pair mirrors some of the ambiguity seen in GBPUSD. The fact that both pairs are awaiting inflation data from their respective regions means that any surprise in the upcoming economic reports could trigger significant volatility. If the data points towards cooling inflation, it could embolden central banks to consider rate cuts sooner, potentially weakening both the Euro and the Pound against a dollar that might still be perceived as relatively strong due to its own economic outlook. Conversely, hotter-than-expected inflation would likely reinforce a higher-for-longer interest rate narrative, supporting these currencies.
USDJPY, currently at 159.363, presents a fascinating contrast. The daily trend is neutral with a bearish ADX, yet the 1- and 4-hour charts show bullish trends. This suggests a battleground scenario where short-term momentum is fighting against longer-term indecision. The fact that USDJPY is trading near its daily resistance levels while its RSI is in bearish territory hints at potential exhaustion. This divergence is important because significant moves in USDJPY can sometimes spill over into other currency pairs through broader risk sentiment shifts. If USDJPY were to falter significantly, it might signal a broader risk-off sentiment that could pressure GBPUSD, despite its own bullish technical signals.
The commodity markets offer another layer of context. Brent crude oil is trading around $87.81, and WTI at $84.49, both showing upward momentum. Rising oil prices often correlate with increased inflation expectations, which can influence central bank policy and, by extension, currency valuations. If oil prices continue to climb, it could fuel concerns about inflation, potentially leading to expectations of higher-for-longer interest rates. This scenario could benefit currencies like GBP and EUR, provided their respective economies don't show signs of severe slowdown. However, the current correlation between gold's rally and oil's rise suggests a broader commodity strength narrative, which might be driven by supply-side concerns or geopolitical risks rather than purely demand-driven inflation. The news that gold is betting $90 oil won't force the Fed back to tightening is particularly telling; it implies that market participants believe the Fed has sufficient policy room to manage inflation even if energy prices remain elevated, a view that could support GBPUSD if it translates into a less hawkish stance from the Bank of England.
Considering the technical signals across different timeframes, the overall picture for GBPUSD is one of cautious optimism with a strong underlying trend. The daily and 4-hour charts present a bullish bias, supported by robust ADX readings that indicate trending conditions. The key resistance at $1.35214 is the immediate hurdle. A successful breach of this level, sustained by positive economic data or a shift in global risk sentiment, could propel the pair higher. However, the overbought Stochastic on the daily chart and the mixed signals on the 1-hour timeframe necessitate a degree of prudence. Traders should be prepared for potential consolidation or minor pullbacks before the next significant move. The market is clearly waiting for a catalyst, and the upcoming inflation reports are poised to provide it.
The strength indicated by the ADX across multiple timeframes is a significant factor. On the 4-hour chart, it stands at 33.69, and on the daily at 23.46, both pointing towards established trends. This isn't a market stuck in a tight range; it's one that's building momentum. The question is whether the bullish momentum can overcome the psychological resistance at $1.35 and the potential for profit-taking as indicated by the daily Stochastic. If the upcoming economic data surprises to the upside for the UK or downside for the US, we could see a clear breakout. Conversely, weak UK data or strong US inflation could trigger a reversal, testing the support levels around $1.3501 and potentially lower.
The current market sentiment seems to be leaning towards a 'risk-on' environment, albeit a cautious one. The rally in equities like the S&P 500 and Nasdaq, despite some intraday fluctuations, suggests that investors are not yet fleeing to safe-haven assets en masse, which generally supports riskier currencies like the pound. However, the rising gold prices and the cautious approach to GBPUSD's resistance suggest that this risk appetite is fragile. Any geopolitical escalation or a surprisingly hawkish turn from the Federal Reserve or the Bank of England could quickly shift sentiment, leading to a 'risk-off' move that would likely see GBPUSD retreating from current levels, potentially testing support at $1.34908.
The convergence of technical signals and fundamental drivers creates a compelling scenario for GBPUSD. The strong underlying trend suggested by the ADX, coupled with the bullish setups on the daily and 4-hour charts, points towards potential upside. However, the immediate resistance at $1.35214, the overbought conditions on the daily Stochastic, and the uncertainty surrounding upcoming inflation data introduce significant risk. The market is at a crossroads, and the direction will likely be determined by how price action behaves around these key levels in response to economic news. For traders, this environment calls for disciplined risk management and a clear strategy for entering and exiting positions based on confirmed breakouts or breakdowns.
The relationship between GBPUSD and the DXY is always a key consideration. With the DXY showing a bearish trend on the daily chart despite some intraday strength, it suggests that the dollar's broader weakening trend might continue. If this holds true, it would provide a tailwind for GBPUSD. However, the immediate resistance levels for GBPUSD are significant, and a strong dollar could still act as a headwind. The market is essentially weighing the potential for continued dollar weakness against the possibility of sticky inflation forcing central banks to maintain tighter policies, which could support the dollar. This balancing act is creating the current consolidation around $1.35.
Ultimately, the narrative for GBPUSD is one of anticipation. The pair is poised near a resistance level, with technical indicators offering mixed signals across different timeframes. The strong trend identified by the ADX suggests that once a direction is confirmed, the move could be substantial. The crucial factor will be the upcoming economic data. A print that suggests inflation is cooling could embolden the Bank of England to consider policy easing sooner, potentially capping GBP gains. Conversely, persistent inflation or signs of economic resilience could support the pound. Traders must remain vigilant, focusing on price action around the $1.35214 resistance and the $1.34908 support levels.
Bearish Scenario: Consolidation or Reversal?
40% ProbabilityNeutral Scenario: Range-Bound Trading
30% ProbabilityBullish Scenario: Breakout Confirmation
30% ProbabilityFrequently Asked Questions: GBPUSD Analysis
What happens if GBPUSD breaks above the $1.35214 resistance level?
A confirmed break above $1.35214, especially with strong volume and positive economic data, could target the next resistance levels at $1.35473 and potentially $1.35582. This would signal a continuation of the bullish trend.
Should I buy GBPUSD at current levels near $1.35 given the mixed signals?
Entering at current levels requires caution. While daily and 4-hour charts show bullish potential, the 1-hour chart and daily Stochastic are showing overbought conditions or bearish leanings. A more prudent approach might be to wait for a confirmed breakout above $1.35214 or a pullback to support around $1.34908, with a probability estimate of 30% for a bullish continuation from current levels.
Is the RSI at 60.5 a buy signal for GBPUSD right now?
An RSI of 60.5 is in the neutral-to-bullish zone, indicating upward momentum but not yet overbought conditions. It suggests that the trend has strength but doesn't signal an immediate buy. Confirmation from other indicators and price action, particularly a breakout above resistance, would be needed for a stronger conviction.
How will upcoming inflation data affect GBPUSD this week?
Upcoming inflation data is a critical catalyst. Hotter-than-expected inflation could support GBPUSD by implying higher interest rates, while cooler-than-expected data might lead to profit-taking or a bearish reversal. Market participants will be closely watching the actual figures against forecasts to gauge central bank policy implications.
Track markets in real-time
AI-powered analysis, technical indicators and real-time price data.
Join Our Telegram Channel
Breaking market news, AI analysis and trading signals instantly.
Join Channel