
EURUSD Tests Key Support Near $1.15307 Amid Shifting Fed Expectations
EURUSD hovers around $1.15307 as traders digest mixed signals and await crucial US CPI data. The dollar's recent pullback offers some respite, but the pair faces a critical test.
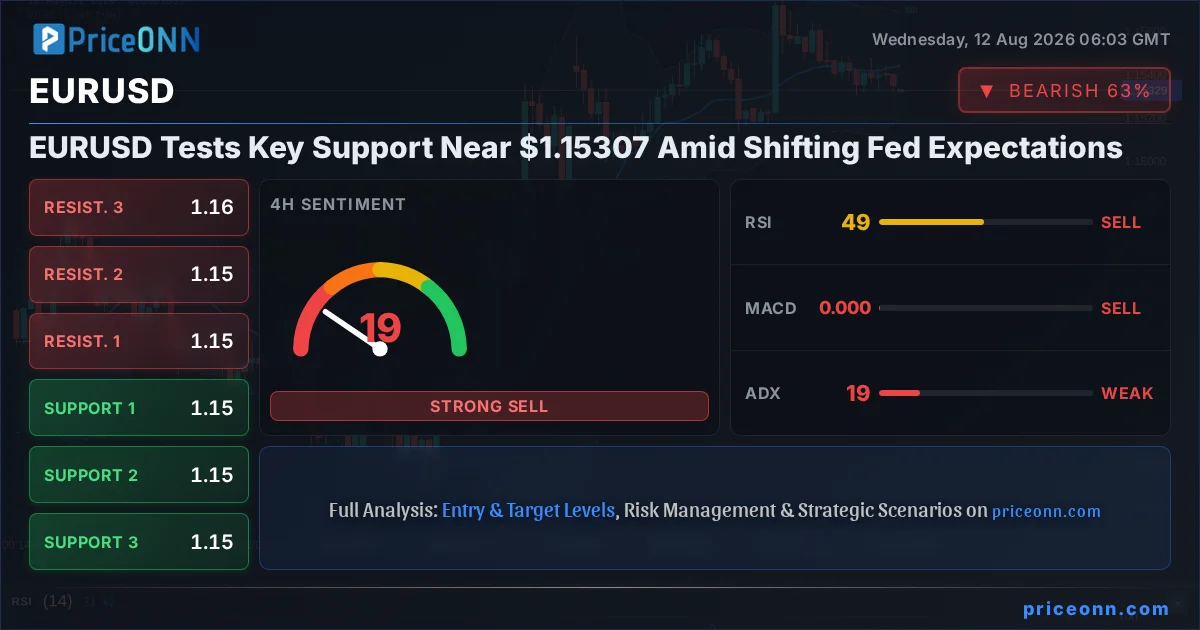
The EURUSD pair is currently navigating a critical juncture, hovering precariously close to the $1.15307 support level. This price point represents more than just a number on the chart; it's a battleground where shifting Federal Reserve expectations, ongoing geopolitical tensions, and the broader macroeconomic landscape are clashing. With the US Dollar Index (DXY) showing signs of a pullback after a significant rally, the euro finds a sliver of breathing room, but the prevailing uncertainty suggests that the current price action is far from settled. Traders are keenly observing every tick, anticipating the catalyst that could break the stalemate and define the next significant move for this major currency pair.
- EURUSD is testing critical support near $1.15307, with the 1-day RSI at 57.84 indicating a neutral but slightly bullish leaning.
- The DXY is currently at 99.9, showing potential weakness that could support EURUSD if sustained.
- Mixed signals from 1-hour and 4-hour charts suggest consolidation, with the 1-day chart showing a stronger bullish trend.
- Upcoming US CPI data is the key event to watch, potentially influencing Fed policy expectations and EURUSD direction.
Navigating the Dollar's Dance
The US Dollar Index (DXY), a key barometer for the greenback's strength against a basket of major currencies, is currently trading around 99.9. While this level still suggests underlying strength, the recent upward momentum appears to be faltering. The 1-hour chart for DXY shows a positive momentum signal with RSI at 64.49, but the Stochastic indicator is flashing a potential pullback signal with %K below %D. On the 4-hour chart, the trend is neutral, and while MACD shows positive momentum, the Stochastic is again leaning towards a potential dip. This indecision in the dollar's immediate trajectory creates a complex environment for EURUSD. A sustained decline in the DXY from these elevated levels could provide a much-needed tailwind for the euro, potentially allowing EURUSD to reclaim higher ground. However, the daily chart still shows a dominant downtrend for the DXY (ADX at 29.33), suggesting that any dollar weakness might be temporary rather than a full reversal.
EURUSD: A Tale of Two Timeframes
When examining EURUSD, the technical picture across different timeframes presents a somewhat divided narrative, reflecting the current market indecision. On the 1-hour chart, the trend is decisively bearish (93% strength), with RSI at 38.77 and Stochastic showing a clear sell signal. This suggests short-term selling pressure is dominant. However, as we zoom out to the 4-hour timeframe, the trend becomes neutral (50% strength). Here, the RSI sits at 48.65, hovering around the midpoint, and the Stochastic is actually giving a buy signal (%K above %D), indicating a potential shift or consolidation. The most compelling signal comes from the daily chart, where the trend is classified as bullish (89% strength). The daily RSI at 57.84, while in neutral territory, shows an upward inclination. MACD is positive and above the signal line, and the ADX at 27.44 confirms a strong uptrend. This divergence between short-term bearish pressures and a more robust daily bullish outlook creates a key decision point for traders: will the short-term weakness lead to a deeper correction, or will the daily trend prevail?
The Crucial Role of Support at $1.15307
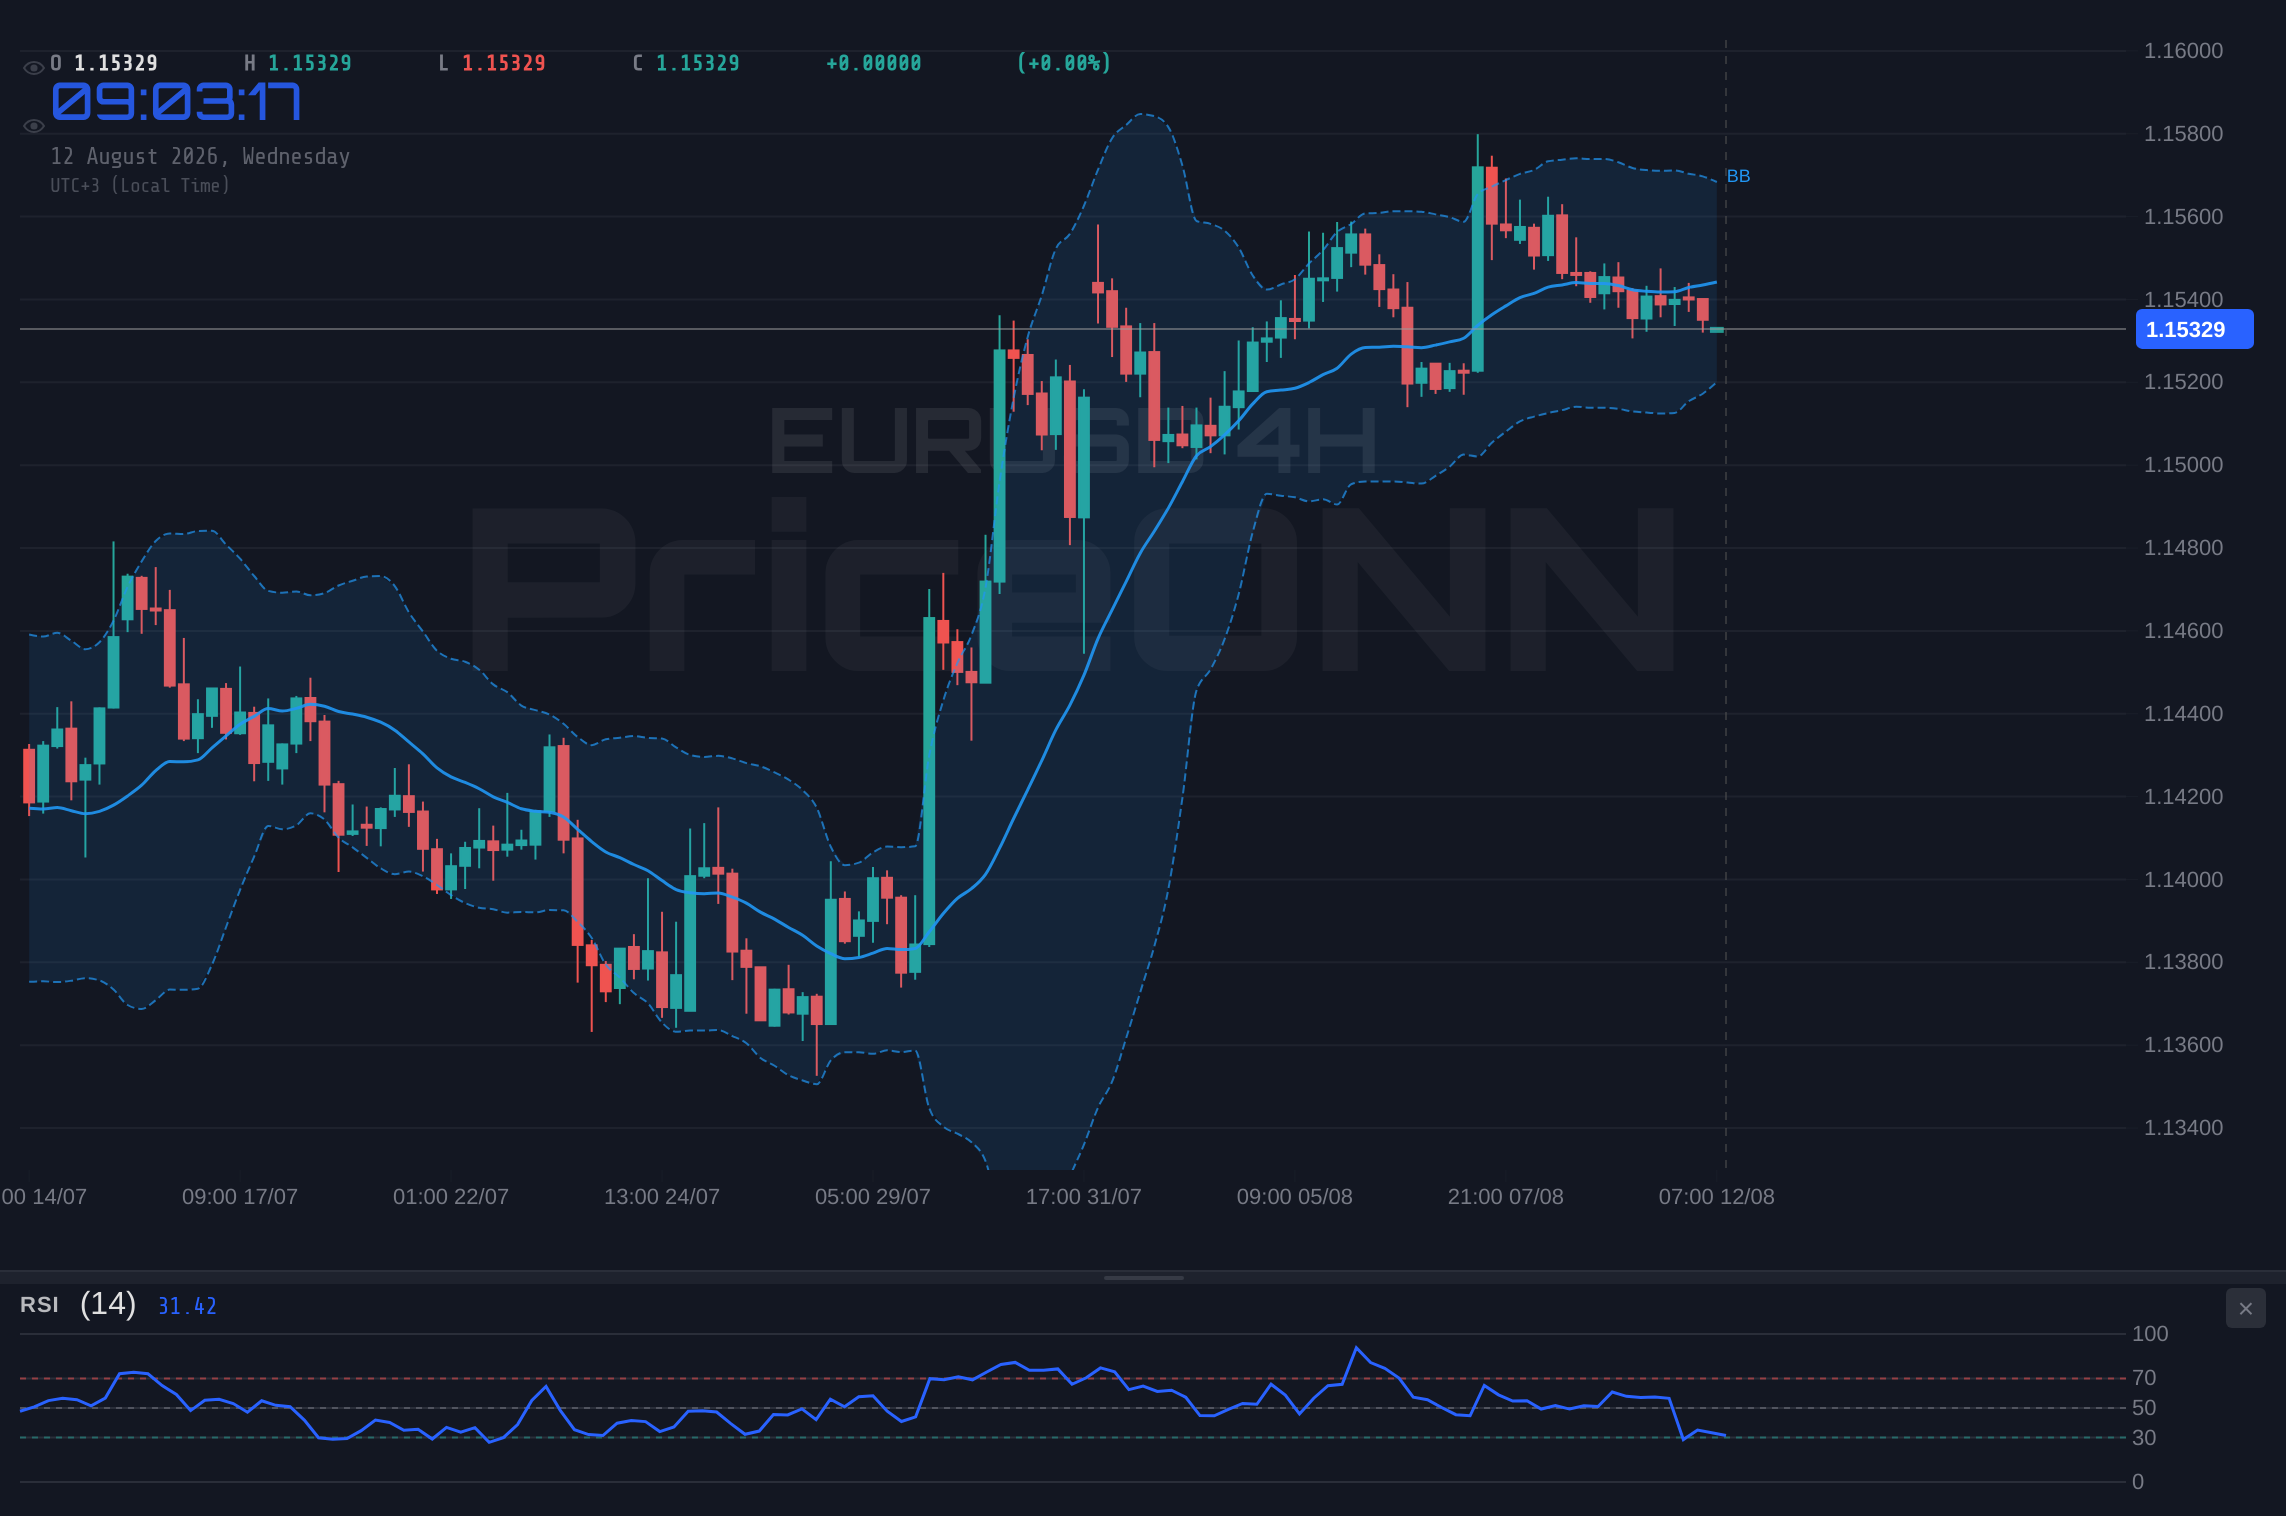
The immediate focus for EURUSD traders is undoubtedly the support level currently residing around $1.15307. This level has been a point of contention, and its resilience will be a major determinant of the pair's short-term direction. On the 1-hour chart, the immediate support is seen at 1.15329, followed by 1.15306 and 1.15293. A break below these levels, particularly the 1.15306 mark, could trigger further selling pressure, potentially accelerating towards the next support at 1.15293. The 1-hour ADX reading of 16.67 signifies a weak trend, meaning that a breakdown might not immediately gain significant momentum, but it opens the door for further downside exploration. The 4-hour chart reinforces this with support identified at 1.15367, 1.15333, and 1.15297. A decisive close below the 1.15333 level on the 4-hour chart could signal a deeper correction, targeting the 1.15297 area.
Conversely, if the $1.15307 area holds firm, it could provide the foundation for a bounce. The 1-hour resistance levels are clearly defined at 1.15365, 1.15378, and 1.15401. A successful push above these immediate barriers, especially clearing 1.15401, would suggest that the short-term bearish sentiment is waning. Confirmation would come from breaking through the 4-hour resistance levels, starting with 1.15437 and then 1.15473. The daily chart provides a higher ceiling, with resistance at 1.15491, 1.15582, and crucially, 1.15675. A sustained move above this daily resistance zone would validate the bullish trend indicated by the daily indicators and open up the possibility of further upside towards the 1.16 handle and beyond.
Economic Calendar: The CPI Wildcard
The macroeconomic calendar is currently dominated by anticipation for the upcoming US Consumer Price Index (CPI) report. This data release is paramount, as it will offer critical insights into the current state of inflation and, by extension, influence the Federal Reserve's monetary policy decisions. Recent labor market data, such as the non-farm payrolls (NFP) report released on August 10th, showed a mixed picture. While the dollar initially plummeted on a decline in US employment, as reported by Forex news outlets, the market's reaction was somewhat muted, suggesting that expectations might have already priced in a certain level of labor market softness. This has reinforced the narrative of a potential Fed pause or at least a reluctance to embark on further aggressive tightening. However, inflation remains the Fed's primary concern. If the upcoming CPI data comes in higher than expected, it could reignite fears of persistent inflation, pushing the Fed back towards a more hawkish stance. Conversely, a cooler-than-expected inflation reading would solidify the case for a pause and potentially weaken the dollar further, offering a significant boost to EURUSD.
The correlation between inflation data, Fed policy, and currency movements is exceptionally strong. Gold prices, for instance, have been rallying towards two-month highs near $4,450, partly driven by expectations that the Fed will not raise rates further, as noted by various commodity news sources. This suggests that markets are betting on inflation cooling sufficiently to allow for a Fed pivot. The divergence between gold's rally and oil prices, which are also firming up, highlights this sentiment. Brent crude has rebounded towards $90, yet gold continues to climb, indicating that the market is prioritizing the Fed's reaction function over inflationary pressures from energy prices alone. For EURUSD, a softer CPI print would likely lead to a break above immediate resistance levels, while a hotter-than-expected number could see the pair retest its recent lows. The market's interpretation of the CPI report – whether it reinforces the 'Fed pause' narrative or signals renewed inflationary concerns – will be the critical driver in the coming days.
Correlation Dynamics: DXY, Equities, and the Euro
The interplay between the US Dollar Index (DXY), major equity indices like the S&P 500 and Nasdaq 100, and the EURUSD pair is a fundamental aspect of understanding market sentiment. Currently, the DXY is trading around 99.9, showing some indecision but maintaining a generally strong posture. The S&P 500 is trading at 6572.87, showing a modest daily gain of 0.74%, while the Nasdaq 100 is at 29608.4, up 0.25%. On the daily charts, both the S&P 500 and Nasdaq are showing signs of a potential downturn (ADX values of 47.51 and 12.28 respectively, though the S&P 500's daily trend is classified as 'Down' with 100% strength, indicating a strong downward move despite the current day's price action). This juxtaposition - a relatively strong dollar and rising equities, yet with underlying concerns on daily equity charts - creates a complex correlation picture.
Historically, a strong dollar often correlates inversely with EURUSD. The current DXY level of 99.9 suggests that any further dollar strength could indeed pressure the euro. However, the mixed signals from the DXY's shorter timeframes, coupled with the bearish undertones in the daily equity charts, hint at potential volatility. If risk appetite deteriorates further, evidenced by a significant decline in the S&P 500 and Nasdaq, we could see a flight to safety. While the dollar often benefits from risk-off sentiment, the euro might also find some safe-haven appeal, or its correlation with risk assets could lead to further declines. The key takeaway is that the DXY's next move is crucial. A decisive break above 100.08 would likely exacerbate weakness in EURUSD, while a fall back below 99.72 could offer significant relief and support a rally in the pair, especially if coupled with cooling inflation data that tempers Fed rate hike expectations.
Technical Indicators: A Nuanced View
Diving deeper into the technical indicators provides a more granular perspective on EURUSD's current positioning. On the 1-hour chart, the RSI stands at 38.77, clearly in the neutral zone but trending downwards, suggesting some selling momentum is building. The MACD is showing momentum that is 'balancing', indicating a potential pause in the short-term trend. Stochastic, with %K at 14.79 and %D at 41.74, is firmly in oversold territory and showing a clear bearish signal (%K
Moving to the 4-hour chart, the RSI is at 48.65, very close to the midpoint, reflecting the neutral trend. MACD here is in negative momentum, below the signal line, suggesting bears are slightly more in control on this timeframe. The Stochastic, however, presents a contrasting view with %K at 30.56 and %D at 24.44, showing a bullish signal (%K > %D) and potentially indicating an oversold bounce is due. The ADX at 19.17 still signals a weak trend. The Bollinger Bands are above the middle band, aligning with a potential for upward movement. Finally, the daily chart paints a more bullish picture. The RSI is at 57.84, comfortably in neutral territory with an upward bias. MACD is positive and above its signal line, indicating bullish momentum. The Stochastic, while in the upper half of its range at K=72.04 and D=83.71, is showing a bearish crossover (%K
What If the Support Breaks?
Should the critical support zone around $1.15307 fail to hold, the implications could be significant for EURUSD. The immediate downside target, based on the 1-hour timeframe, would be the 1.15306 and 1.15293 levels. A decisive break below 1.15300 would likely trigger a cascade of sell orders, attracting more sellers and accelerating the descent. The 4-hour chart identifies the next significant support at 1.15297. If this level is breached, the focus would shift lower, potentially targeting the 1.15214 mark on the daily chart. A break below 1.15200 would invalidate the recent bullish structure on the daily timeframe and could lead to a more pronounced sell-off, possibly retesting levels closer to 1.15000 or even lower, depending on the severity of the catalyst. This scenario would be amplified if the upcoming CPI data comes in significantly hotter than expected, forcing a reassessment of the Fed's policy path and boosting the dollar across the board. The strong daily ADX of 27.44, while confirming an uptrend, also indicates that trend continuations can be powerful once established; therefore, a breakdown below key support could signal a sharp trend reversal.
The Bullish Case: Holding the Line
On the flip side, if EURUSD manages to hold the $1.15307 support and begins to move higher, the path of least resistance could lead to a recovery. The immediate upside target on the 1-hour chart is 1.15365, followed by 1.15378 and 1.15401. A decisive close above 1.15400 would signal a short-term bullish reversal. The 4-hour chart presents the next resistance at 1.15437, then 1.15473. Breaking these levels would strengthen the bullish argument, paving the way for a test of the daily resistance at 1.15491. Beyond that, the psychological level of 1.15500 becomes a key hurdle, followed by the more significant daily resistance at 1.15675. A sustained move above 1.15700 would strongly suggest that the daily bullish trend is reasserting itself, potentially targeting the 1.16000 handle. This scenario would be favored by a cooler-than-expected CPI report, reinforcing the Fed pause narrative and leading to broader dollar weakness. The current 'AL' signals on the 1-hour and 4-hour charts, despite some conflicting indicators, suggest that buyers are still present in the market, looking for an opportunity to step in if conditions become favorable.
Scenario Analysis: Charting the Possibilities
Bearish Scenario: Breakdown Below $1.15307
65% ProbabilityNeutral Scenario: Consolidation Around $1.15307
25% ProbabilityBullish Scenario: Holding Support and Reversing
10% ProbabilityThe Road Ahead: What to Watch
The immediate future for EURUSD hinges significantly on two primary factors: the strength of the US dollar and the outcome of the upcoming US CPI report. The DXY's current trading range near 99.9 presents a critical test; a failure to break higher could initiate a broader dollar correction, offering support to the euro. Conversely, any renewed dollar strength, perhaps fueled by hawkish whispers from the Fed or geopolitical escalations, would likely push EURUSD lower. The CPI data, scheduled for release soon, is the most anticipated event. A print that suggests inflation is cooling faster than expected could embolden the Fed to maintain its current policy stance, leading to dollar weakness and a potential rally in EURUSD towards the 1.15500-1.15700 resistance zone. However, a hotter-than-expected inflation reading would throw a wrench into these expectations, potentially forcing the Fed back to the tightening table and sending EURUSD tumbling towards the 1.15100-1.15200 support area.
Traders should also remain vigilant regarding the broader market sentiment. While equities have shown some resilience, the underlying bearish signals on daily charts for indices like the S&P 500 cannot be ignored. A significant shift towards risk aversion could see both the dollar and potentially the euro benefit, albeit through different channels – the dollar as a safe haven, and the euro if it decouples from risk assets or if European economic data shows unexpected strength. For now, the technical picture suggests caution. The daily trend remains bullish, but the immediate pressure around the $1.15307 support level, coupled with conflicting signals across shorter timeframes, indicates that the market is in a holding pattern. Patience and a data-driven approach will be key. Waiting for confirmation, whether it's a decisive break of support or resistance, or a clear reaction to the CPI data, will be crucial for navigating this uncertain period.
Frequently Asked Questions: EURUSD Analysis
What happens if EURUSD breaks below the $1.15307 support level?
A break below $1.15307 would invalidate the immediate bullish outlook. The 1-hour chart suggests targets at 1.15306 and 1.15293, with the 4-hour chart pointing towards 1.15297. This scenario would likely be driven by a stronger-than-expected US CPI report, increasing dollar demand.
Should I consider buying EURUSD at current levels around $1.15307 given the daily bullish trend?
While the daily chart shows a bullish trend (RSI 57.84, ADX 27.44), the short-term charts present conflicting signals and immediate support is being tested. A more prudent approach would be to wait for confirmation, such as holding above $1.15307 with clear upward momentum, or a decisive break above the 1.15491 daily resistance level.
Is the RSI at 57.84 on the daily chart a buy signal for EURUSD?
An RSI of 57.84 is considered neutral territory, leaning slightly bullish. It indicates moderate buying pressure but is not yet in overbought territory. While it supports the existing bullish trend, it does not by itself constitute a strong buy signal without further confirmation from other indicators or price action.
How will the upcoming US CPI data impact EURUSD this week?
A cooler-than-expected CPI reading would likely weaken the dollar and support a rally in EURUSD towards 1.15500-1.15700, reinforcing Fed pause expectations. Conversely, a hotter print could trigger dollar strength and push EURUSD lower, potentially retesting 1.15100-1.15200.
| Indicator | Value | Signal | Interpretation |
|---|---|---|---|
| RSI (14) - 1H | 38.77 | Bearish | Downward trend, nearing oversold |
| MACD - 1H | Balancing | Neutral | Momentum indecisive |
| Stochastic - 1H | K=14.79, D=41.74 | Bearish | Oversold, bearish crossover |
| ADX - 1H | 16.67 | Weak Trend | Lack of strong directional conviction |
| RSI (14) - 4H | 48.65 | Neutral | Near midpoint, consolidating |
| Stochastic - 4H | K=30.56, D=24.44 | Bullish | Oversold, bullish crossover |
| ADX - 4H | 19.17 | Weak Trend | Low trend strength |
| RSI (14) - 1D | 57.84 | Bullish | Neutral zone, upward bias |
| MACD - 1D | Positive | Bullish | Above signal line, positive momentum |
| ADX - 1D | 27.44 | Strong Trend | Confirms uptrend |
Track markets in real-time
AI-powered analysis, technical indicators and real-time price data.
Join Our Telegram Channel
Breaking market news, AI analysis and trading signals instantly.
Join Channel