
Gold Nears $4,412.83 Resistance: RSI Signals Caution Amidst Mixed Signals
Gold hovers near $4,412.83 resistance, with RSI at 67 showing caution. Mixed indicators suggest a crucial juncture for the precious metal.
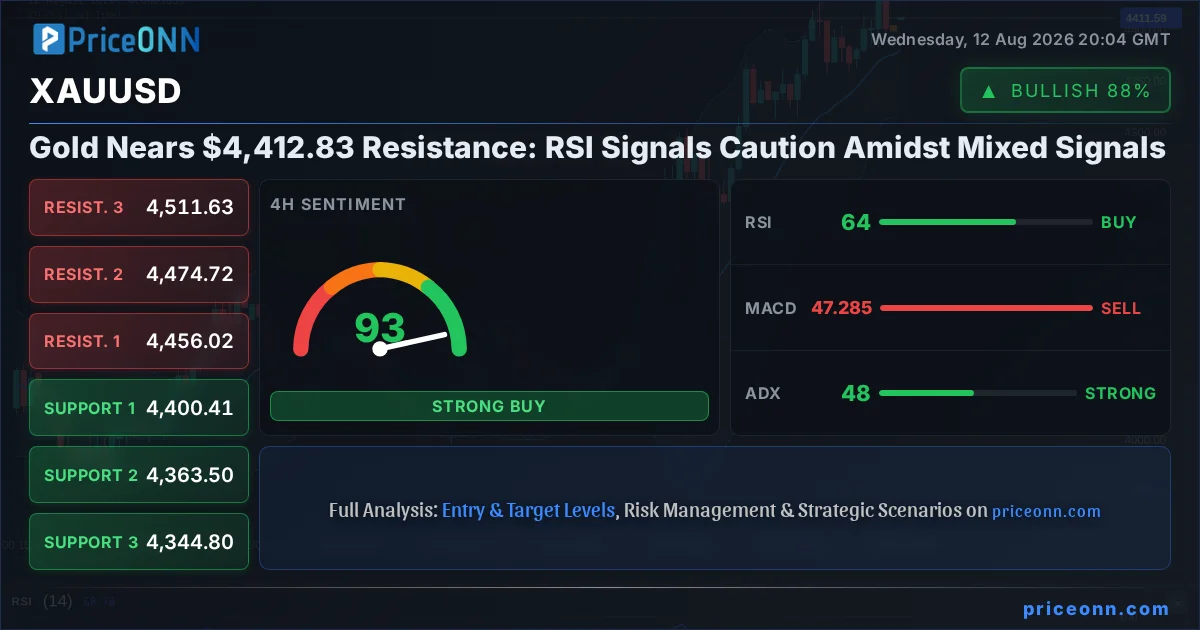
Gold is currently testing the upper bounds of its recent trading range, currently hovering around the critical $4,412.83 mark. This ascent, while impressive, brings the precious metal face-to-face with significant resistance levels, prompting a closer look at the underlying technical signals. The Relative Strength Index (RSI) at 67.36 is flashing a warning light, suggesting that while bullish momentum is present, it might be approaching exhaustion. This creates a fascinating dichotomy: a market pushing higher, yet with indicators hinting at potential headwinds. Understanding this interplay is key for any trader looking to navigate the gold market in the coming sessions. The question on everyone's mind is whether gold can break through this barrier or if a pullback is on the cards. This analysis delves into the multi-timeframe technical picture, correlating indicators, and the fundamental backdrop that could shape gold's next move.
- The Relative Strength Index (RSI) at 67.36 signals growing overbought pressure, suggesting caution is warranted as gold approaches resistance.
- Critical resistance for XAUUSD stands at $4,421.61 on the 1-hour chart, with a decisive break above this level needed for further upside.
- The MACD histogram shows negative momentum on the 1-hour and 4-hour charts, indicating that while price is rising, the underlying momentum may be waning.
- The Dollar Index (DXY) is showing strength at 100.01, which typically puts downward pressure on gold prices, adding a layer of complexity to the bullish case.
Navigating the $4,412.83 Gold Price: A Multi-Timeframe Technical Perspective
The 1-Hour Chart: A Battle for Momentum
On the 1-hour chart, gold is exhibiting a neutral trend, with its strength indicator at 50%. This signifies a market in flux, where short-term traders might find opportunities but a clear directional conviction is absent. The current price of $4,412.83 is finding immediate resistance at $4,421.61. This level is not just a random number; it represents a price point where selling pressure has historically emerged, potentially leading to a pause or reversal in the upward momentum. Support is identified at $4,400.08, a level that, if tested and held, could provide a springboard for another attempt at resistance. However, the technical indicators paint a mixed picture. The RSI at 55.04 is in neutral territory but shows an upward lean, suggesting some underlying buying interest. Conversely, the MACD is displaying negative momentum, with the MACD line hovering below its signal line. This divergence between price action and MACD is a classic sign of weakening buying conviction. Furthermore, the Stochastic oscillator is signaling a potential pullback, with the %K line at 44.47 dipping below the %D line at 55.31. The ADX reading of 15.63 confirms what the neutral trend strength suggests: the current trend lacks significant power, making any breakout tentative. The overall signal on the 1-hour chart leans towards 'SELL' (6 Sell, 2 Buy, 0 Neutral), reflecting the caution warranted by these conflicting signals.
The 4-Hour Chart: The Bullish Undercurrent
Shifting to the 4-hour timeframe, the narrative becomes more bullish, with the trend identified as 'Uptrend' and carrying a significant strength of 94%. This timeframe suggests that the longer-term sentiment is leaning towards higher prices. The current price of $4,412.83 is navigating within a range where immediate support is seen at $4,400.41, followed by $4,363.50. On the resistance side, the levels to watch are $4,456.02, $4,474.72, and $4,511.63. These higher resistance points indicate the potential upside if the current bullish sentiment continues to dominate. The RSI here is at 64.42, still comfortably within the neutral zone but with a clear upward trajectory, reinforcing the bullish lean. The MACD, however, continues to show negative momentum, with the MACD line below its signal line. This is a point of concern and suggests that while the price is moving up, the underlying forces driving that move might be losing steam. The Stochastic oscillator provides a more optimistic signal on this timeframe, with %K at 74.47 above %D at 60.16, indicating strong buying pressure and potentially heading into overbought territory. Crucially, the ADX stands at a robust 48.08, confirming a strong uptrend. This strong ADX reading on the 4-hour chart is a significant bullish indicator, suggesting that the current price action is part of a well-established trend. The overall signal for the 4-hour timeframe is a strong 'BUY' (7 Buy, 1 Sell, 0 Neutral), primarily driven by the trend strength and ADX reading, despite the lingering MACD weakness.
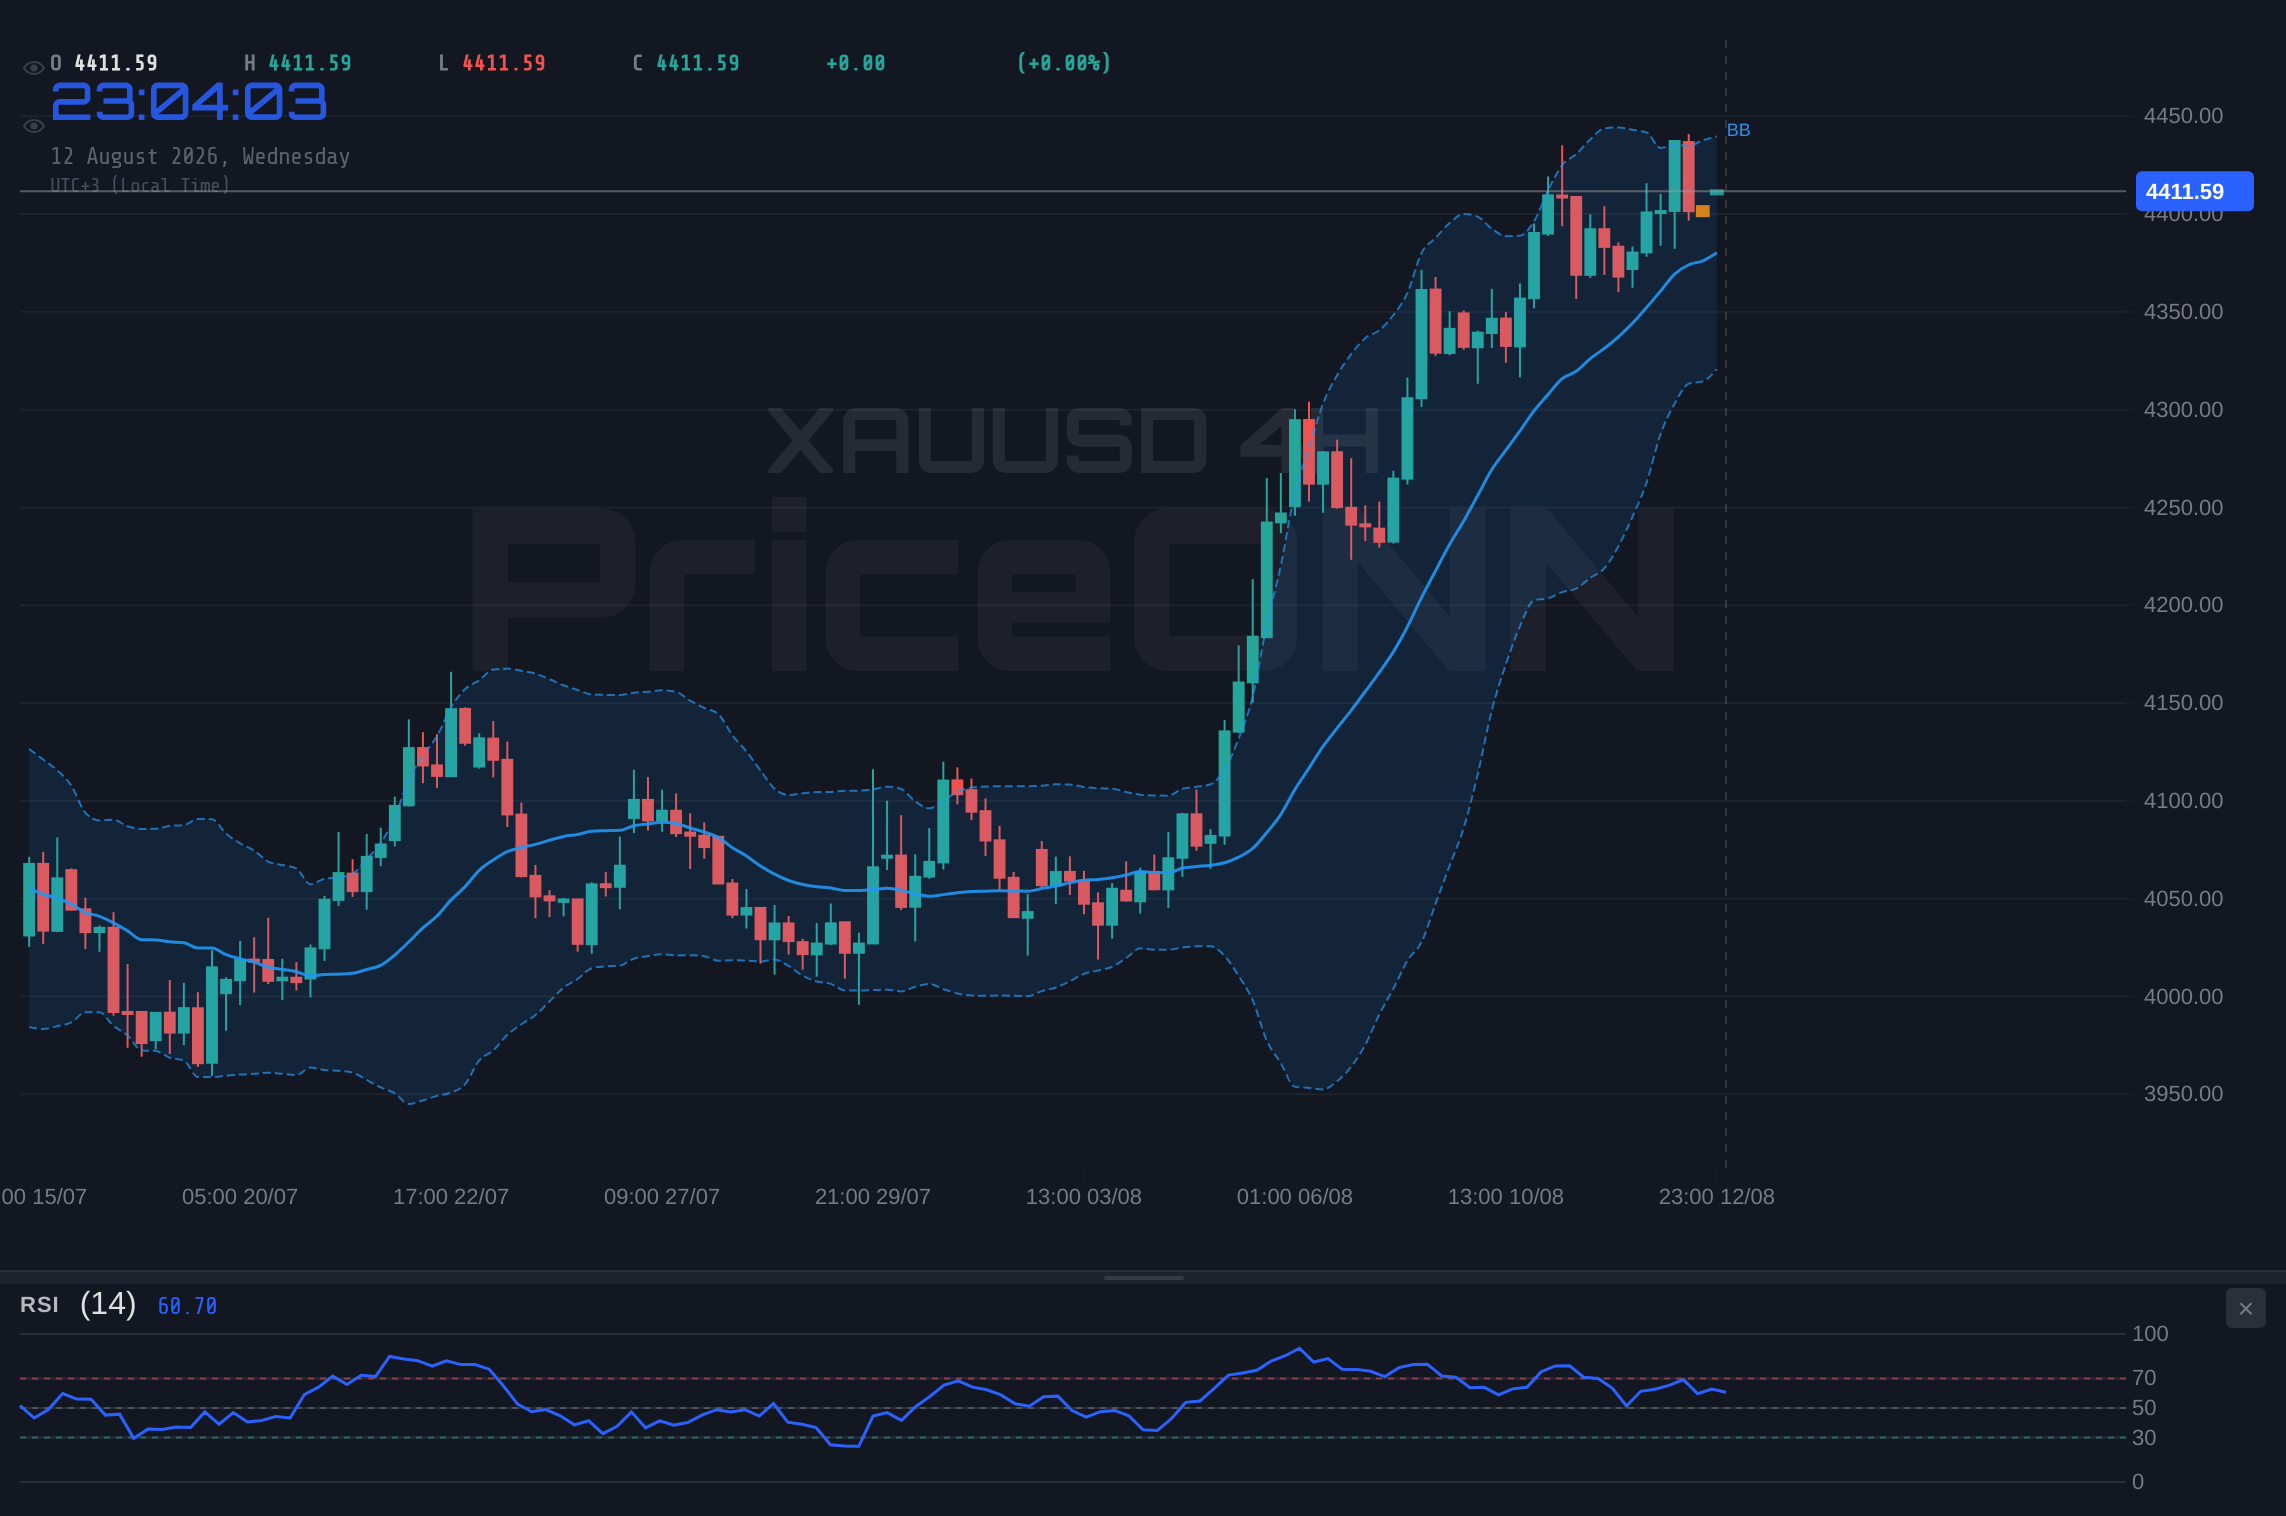
The Daily Chart: Long-Term Perspective and Overbought Warnings
Looking at the daily chart, the trend reverts to neutral, with a strength of 50%. This suggests that while the 4-hour chart indicates a robust uptrend, the longer-term daily picture is less decisive, implying that the current rally might be facing significant hurdles. The immediate support on the daily chart is located at $4,338.04, with further levels at $4,308.07 and $4,359.55. Resistance is eyed at $4,416.53, $4,465.05, and $4,495.02. The price of $4,412.83 is currently sitting just below the first daily resistance level, making this a pivotal point. The RSI here is at 67.89, nearing the overbought threshold of 70. While not yet in extreme overbought territory, this reading suggests that the market is becoming increasingly stretched to the upside, and a period of consolidation or a pullback could be imminent. The MACD on the daily chart is more encouraging, showing positive momentum with the MACD line above its signal line, aligning with the recent price appreciation. However, the Stochastic oscillator presents a stark warning: %K is at a very high 92.01, and %D is at 83.1. This indicates extreme overbought conditions, a strong signal for potential profit-taking or a reversal. The ADX at 30.09 still points to a strong uptrend, but when combined with the extreme Stochastic readings, it paints a picture of a trend that is becoming overextended. The general signal on the daily chart is 'BUY' (6 Buy, 2 Sell, 0 Neutral), but this is heavily qualified by the overbought signals from the Stochastic and the approaching RSI resistance.
The divergence between the strong uptrend indicated by the 4-hour ADX (48.08) and the overbought Stochastic on the daily chart (92.01/83.1) creates a critical juncture for XAUUSD. Traders must weigh the trend continuation potential against the risk of a significant pullback.
The Dollar's Influence and Inflationary Undercurrents
The broader market context is crucial for understanding gold's current position. The Dollar Index (DXY) is currently trading at 100.01, showing a noticeable increase of 0.21% on the day. Historically, a strengthening dollar often exerts downward pressure on gold prices, as they are typically inversely correlated. When the dollar gains strength, it becomes more expensive for holders of other currencies to buy dollar-denominated assets like gold, potentially dampening demand. The DXY's move above 100.00 is a psychological level that often signals renewed dollar strength, which could act as a headwind for gold's rally. Adding to this complexity are the recent inflation figures. The July CPI report showed a 0.1% month-on-month increase, which was in line with expectations and indicated that inflationary pressures remain subdued. This is significant because lower-than-expected inflation can reduce the urgency for central banks, particularly the Federal Reserve, to maintain aggressive interest rate hikes. A less hawkish Fed stance can be supportive of gold prices, as it lowers the opportunity cost of holding non-yielding assets like gold. However, the subdued inflation data, while potentially supporting gold indirectly, is juxtaposed against the dollar's current strength. This creates a tug-of-war effect, where the positive implications of controlled inflation for gold are being partially offset by a stronger dollar. The market's reaction to upcoming economic data, particularly any hints about future Fed policy, will be paramount in determining which factor ultimately dominates gold's price action.
The Role of Equities and Risk Appetite
The performance of major stock indices like the S&P 500 and Nasdaq 100 also provides vital clues about gold's price trajectory. The S&P 500 is currently trading at 6572.87, up 0.74% for the day, suggesting a generally positive risk appetite in the equity markets. Similarly, the Nasdaq 100 is also showing gains, trading at 29764.22, up 0.77%. This overall positive sentiment in equities often correlates with a decreased demand for safe-haven assets like gold. When investors feel confident about economic prospects and are willing to take on more risk, they tend to move capital away from assets perceived as safer, such as gold, and into growth-oriented assets like stocks. However, the technical picture on the daily charts for both the S&P 500 and Nasdaq presents a more cautious outlook. The S&P 500's daily trend is identified as 'Downtrend' with 100% strength, and its RSI is at 45.35, indicating bearish momentum. The Nasdaq 100's daily trend is neutral, but its RSI is also in the lower half of the neutral zone. This suggests that while the intraday and 4-hour charts show positive movement, the longer-term daily trend for equities might be under pressure. If this underlying weakness in the broader equity market were to materialize, it could shift investor sentiment back towards safe-haven assets, potentially boosting demand for gold despite the dollar's strength. The upcoming economic data releases, especially inflation reports, will be critical in shaping this broader risk sentiment and, consequently, gold's safe-haven appeal.
Geopolitical Tensions and Supply Dynamics
Geopolitical factors continue to play a subtle but significant role in the gold market. Recent news indicates that a potential deal to reopen U.S.-Iran relations has stalled. While the immediate impact on oil prices might be muted due to current supply dynamics, any escalation or prolonged uncertainty in the Middle East can increase global risk aversion. Gold typically benefits from such geopolitical instability as it is perceived as a safe-haven asset. Investors often flock to gold during times of geopolitical turmoil, seeking a store of value that is less susceptible to the immediate shocks of international conflicts or political instability. Furthermore, the price of Brent crude oil, currently trading around $87.19, is a key factor influencing inflation expectations. While Brent has rebounded from lower levels, its current price point is elevated enough to keep inflation concerns simmering. Persistent high oil prices can contribute to inflationary pressures, which in turn can support gold as an inflation hedge. The market is essentially betting that current oil prices, even if they keep inflation elevated, won't force central banks back into aggressive tightening cycles. This delicate balance between geopolitical risks, oil prices, and central bank policy expectations creates a complex environment where gold's role as a safe-haven and inflation hedge remains highly relevant, even as other factors like dollar strength and overbought technicals attempt to cap its upside.
The combination of a strong dollar (DXY at 100.01) and overbought daily Stochastic readings (92.01/83.1) presents a significant risk of a pullback for XAUUSD. Traders should be wary of chasing price higher without clear confirmation of a breakout.
The Tug-of-War: Bullish Trend vs. Overbought Signals
The current technical setup for XAUUSD presents a classic scenario of a strong uptrend encountering signs of exhaustion. The 4-hour chart, with its robust ADX of 48.08, clearly indicates that the prevailing trend is upward. This suggests that buyers have been in control for some time and are likely to defend their positions. However, the daily chart throws a spanner in the works. The Stochastic oscillator hitting extreme overbought levels (92.01/83.1) is a loud warning sign. Historically, such extreme readings often precede significant pullbacks or consolidations, as the market seeks to rebalance. The RSI at 67.89 on the daily chart is also approaching the overbought threshold, further supporting the notion that the rally is becoming stretched. The conflict between the strong trend on the 4-hour and the overbought conditions on the daily chart creates a high degree of uncertainty. This is precisely the situation where the market can become volatile, as buyers and sellers battle for control. The immediate resistance at $4,421.61 is therefore a critical level to monitor. A failure to break through this level, especially with the daily indicators flashing red, could lead to a swift move back towards the daily support at $4,338.04.
The Importance of the $4,400.08 Support Level
On the 1-hour chart, the support level at $4,400.08 emerges as a key battleground. If gold prices were to pull back from the current resistance, this level would be the first significant test. A hold at $4,400.08 could signal that the bullish sentiment remains intact, and the market is merely consolidating before another attempt at the highs. However, a decisive break below this level, especially accompanied by increasing volume and negative momentum across timeframes, would likely trigger further selling. The next support levels at $4,387.34 and $4,378.55 would then come into play. The fact that the 1-hour chart shows a neutral trend with mixed signals means that price action around $4,400.08 could be particularly volatile. Traders looking to enter long positions might wait for a clear confirmation of support here, perhaps with a bullish candlestick pattern or a bounce in short-term oscillators. Conversely, sellers might look for a break below this level to initiate short positions, targeting the higher support levels on the 4-hour chart. The interplay between price action and these key support levels will be crucial in determining the short-term direction of gold.
Correlation Analysis: DXY and Equities
The correlation between gold, the US Dollar Index (DXY), and major equity indices like the S&P 500 remains a central theme. With the DXY at 100.01 and showing a strengthening bias, it continues to exert a gravitational pull on gold. A stronger dollar typically makes gold less attractive for international buyers, potentially capping upside moves. The S&P 500, currently at 6572.87, is showing intraday strength but faces longer-term bearish signals on its daily chart. This divergence between short-term optimism and long-term caution in equities adds another layer of complexity. If equity markets were to falter significantly, gold could see increased safe-haven demand, potentially overriding the negative pressure from a strong dollar. The current data suggests a delicate balance: the dollar's strength is a headwind, but underlying geopolitical concerns and the potential for a shift in risk sentiment in equities provide a supportive backdrop for gold. Traders need to monitor these correlations closely. A sustained break above the DXY's immediate resistance could signal further headwinds for gold, while a dip in the S&P 500 might provide the catalyst for gold to overcome its current technical overbought warnings.
The current market conditions present a classic 'trend vs. exhaustion' scenario. The 4-hour chart's strong ADX (48.08) suggests the trend is dominant, but the daily Stochastic at 92.01 cannot be ignored. A prudent approach involves waiting for confirmation: either a decisive breakout above $4,421.61 with sustained buying volume, or a clear break below $4,400.08 to signal a potential reversal.
Forward-Looking Outlook: What's Next for Gold?
The path forward for gold hinges on several key factors. Technically, the immediate resistance at $4,421.61 and support at $4,400.08 are the levels to watch. A confirmed break above resistance, sustained by positive volume and ideally accompanied by a cooling RSI, could open the door for a move towards $4,456.02. However, the overbought daily Stochastic remains a significant concern, suggesting that any upward move might be met with profit-taking. Conversely, a break below $4,400.08 could signal the start of a deeper correction, potentially targeting the $4,338.04 support on the daily chart. Fundamentally, upcoming economic data, particularly any further clues on inflation and Federal Reserve policy, will be critical. If inflation continues to show signs of cooling, it might reduce the pressure on the Fed to hike rates further, which would be supportive for gold. However, a stronger-than-expected dollar could counteract these positive effects. Geopolitical developments also remain a wildcard; any increase in global tensions could trigger safe-haven flows into gold. The current market sentiment in equities, while positive intraday, shows underlying weakness on daily charts, which could shift towards risk aversion, benefiting gold. The interplay between these technical levels, inflationary pressures, central bank expectations, and geopolitical stability will dictate gold's trajectory in the short to medium term.
The Case for Patience and Risk Management
Given the conflicting signals – a strong uptrend on the 4-hour chart versus overbought conditions on the daily and a strengthening dollar – patience appears to be the most prudent strategy. Chasing price at current levels, just shy of significant resistance and with warning signs from oscillators, carries substantial risk. Waiting for a clear breakout above $4,421.61 with confirming volume and momentum, or a confirmed hold and bounce from the $4,400.08 support, offers a more defined risk-reward setup. Risk management remains paramount. Traders should consider their position sizing carefully and employ stop-losses to protect against adverse price movements. The market is currently at a critical juncture, and volatility is likely to remain elevated as these competing forces play out. While the allure of a continued rally is strong, the technical indicators and macroeconomic backdrop suggest that caution is warranted. The market always provides opportunities, but they are best seized when the risk-reward profile is clearly in your favor.
Bearish Scenario: Resistance Holds Firm
65% ProbabilityConsolidation Scenario: Range-Bound Trading
25% ProbabilityBullish Scenario: Breakout Above Resistance
10% ProbabilityFrequently Asked Questions: XAUUSD Analysis
What happens if XAUUSD breaks above the $4,421.61 resistance level?
A decisive close above $4,421.61 on the 1-hour chart, confirmed by increasing volume and a cooling RSI, could open the door for a move towards $4,443.14. However, the overbought daily Stochastic suggests this breakout might face profit-taking.
Should I buy XAUUSD at current levels around $4,412.83 given the RSI at 67.36?
Buying at current levels around $4,412.83 is risky due to the RSI at 67.36 signaling overbought pressure and the proximity to resistance. A more prudent approach is to wait for a confirmed breakout above $4,421.61 or a clear hold of support at $4,400.08.
Is the MACD negative momentum on the 1-hour chart a sell signal for XAUUSD?
The negative MACD momentum on the 1-hour chart, while the price is near resistance, suggests waning buying conviction. It's not a standalone sell signal but adds to the caution, indicating that the current upward move might be losing steam despite the overall bullish trend on the 4-hour chart.
How will the subdued July CPI data affect XAUUSD this week?
Subdued July CPI data (0.1% m/m) suggests inflation is cooling, which could lead to a less hawkish Fed stance. This is generally supportive for gold as it lowers the opportunity cost of holding non-yielding assets. However, this effect might be counteracted by a strengthening US Dollar (DXY at 100.01).
Track markets in real-time
AI-powered analysis, technical indicators and real-time price data.
Join Our Telegram Channel
Breaking market news, AI analysis and trading signals instantly.
Join Channel