

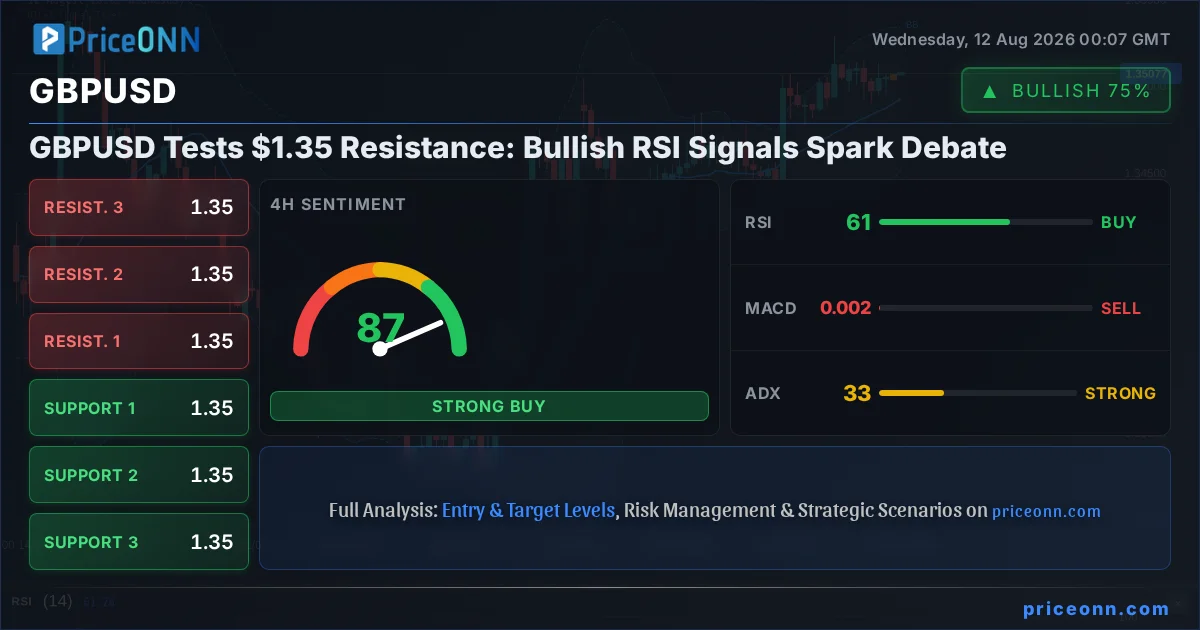
The currency pair GBPUSD is currently trading right at the critical $1.35 level, a price point that has historically acted as a significant battleground for market participants. As this key resistance looms, the Relative Strength Index (RSI) is flashing a mixed signal, sitting at 67.33 on the 1-day chart, suggesting potential overbought conditions and a possible shift in momentum. This divergence between price action and the oscillator is creating a palpable tension in the market, leaving traders and analysts to ponder the next significant move. Will the bulls manage to break through this formidable barrier, or are we on the cusp of a bearish reversal? This analysis delves into the intricate dance of technical indicators, fundamental drivers, and market sentiment to unravel the potential path forward for GBPUSD.
- GBPUSD is currently trading at $1.35107, testing a significant resistance level.
- The 1-day RSI at 60.37 indicates a strong uptrend but approaches overbought territory, signaling caution.
- Key support for GBPUSD is identified at $1.34791, while resistance is eyed at $1.35307.
- The DXY is at 99.82, showing a mixed trend, which typically correlates inversely with GBPUSD.
The Tug-of-War at $1.35: What the Charts Are Saying
The GBPUSD pair finds itself at a pivotal juncture, hovering precariously near the $1.35 psychological barrier. On the 1-day timeframe, the price action has been constructive, with the daily close showing a bullish trend strength of 91% and the RSI standing at 60.37. This suggests underlying buying pressure has been dominant. However, the Stochastic Oscillator on the same timeframe presents a conflicting picture: with %K at 90.32 and %D at 82.64, it's firmly in overbought territory, hinting at a potential pullback. This divergence is precisely what makes the $1.35 level so crucial. A sustained break above it could signal a continuation of the bullish trend, targeting higher resistance levels, while a failure to do so might invite profit-taking and a retracement towards key support.
Delving deeper into the intraday charts, the 1-hour timeframe paints a picture of a developing bullish trend, with a trend strength of 86% and the ADX at 12.2, indicating a nascent but present upward momentum. The MACD histogram is showing positive momentum, supporting a move higher. However, the Bollinger Bands are expanding and the price is hugging the upper band, a classic sign of a strong uptrend that could be susceptible to a sharp reversal if buying conviction falters. The current price of $1.35107 is just above the 1-hour resistance of $1.35121, making this immediate area a focal point for short-term traders. The interplay between the longer-term bullish undertones and the short-term overbought signals creates a complex trading environment.
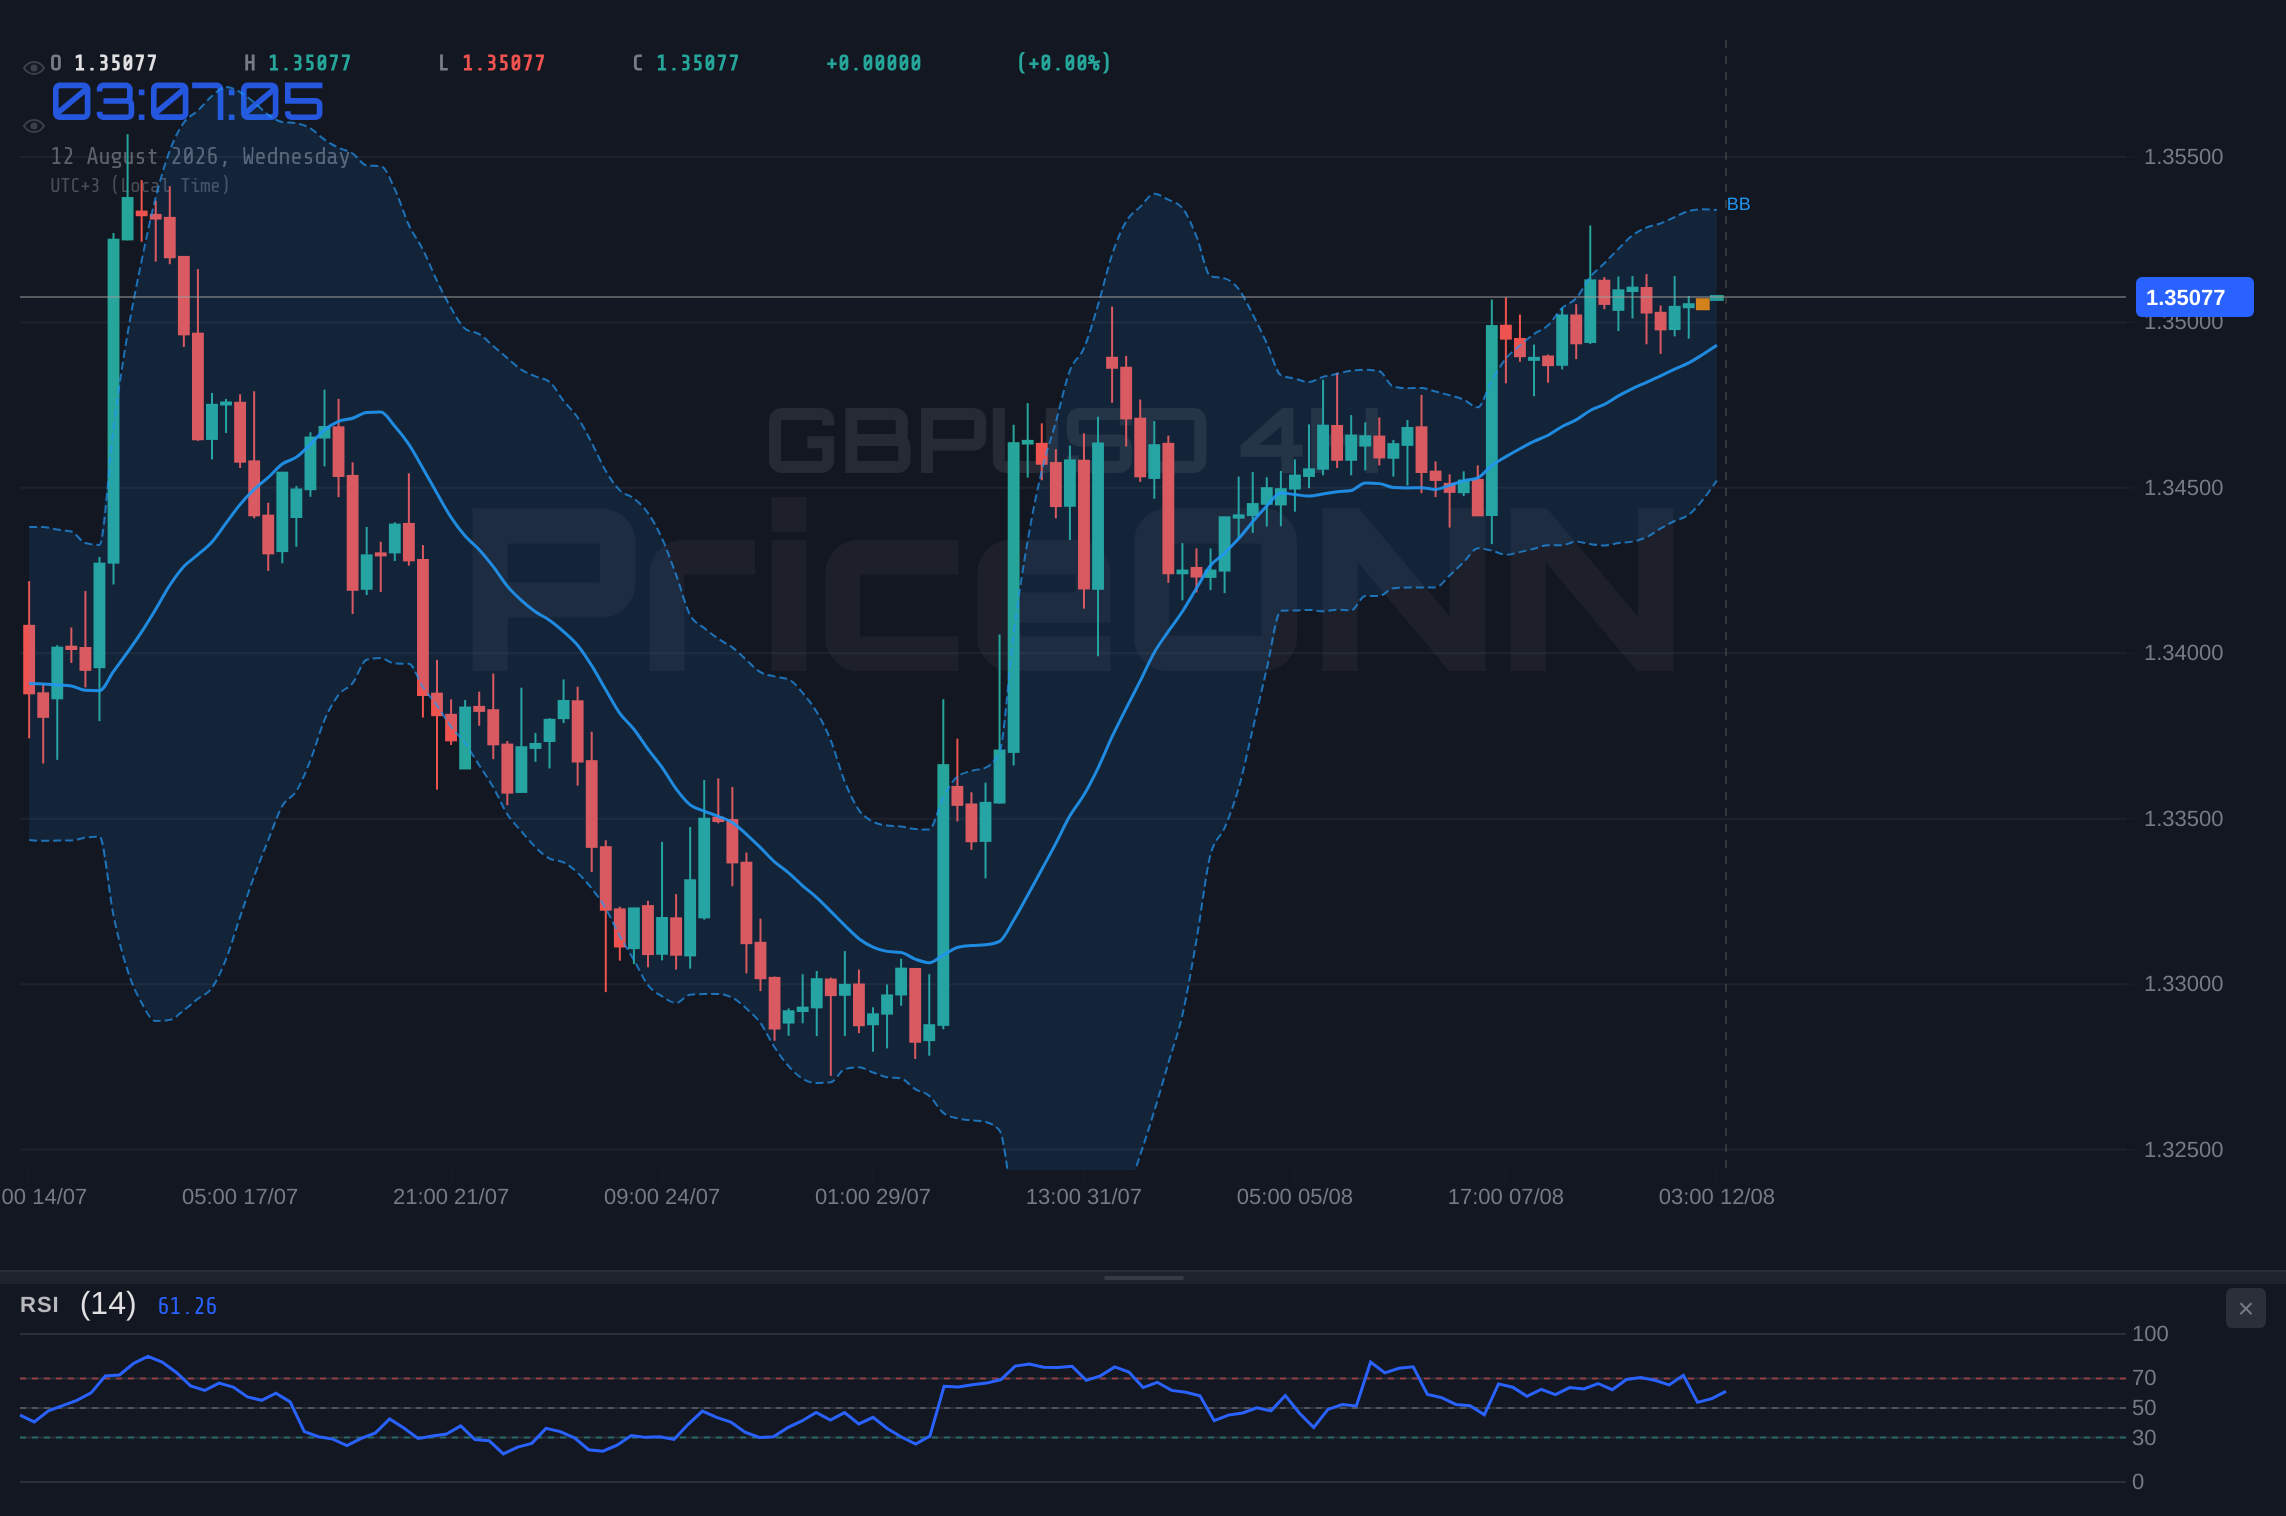
On the 4-hour chart, the picture becomes even more nuanced. The trend strength remains robust at 97%, and the RSI at 60.85 continues to suggest upward potential. Yet, the Stochastic Oscillator (%K=39.48, %D=54.84) is signaling a potential downward move, and the MACD histogram is showing negative momentum, lying below its signal line. This multi-timeframe conflict highlights the importance of patience and confirmation. A move above the immediate resistance at $1.35121 could open the door for further gains, but the overbought conditions on shorter timeframes and the potential for a reversal on the 4-hour chart mean that any upward push needs to be robust and supported by increasing volume to be considered sustainable.
Fundamental Underpinnings: The Macro Forces at Play
The movement in GBPUSD is not happening in a vacuum. Several fundamental factors are likely influencing its trajectory. The Dollar Index (DXY), currently at 99.82, presents a complex correlation. While the 1-day trend for DXY is bearish (strength 89%), the 1-hour and 4-hour charts show a more neutral to slightly bullish picture. Historically, a strengthening DXY tends to weigh on GBPUSD, and vice versa. Currently, the DXY's mixed signals suggest it's not providing a strong directional bias, allowing other fundamental drivers to take center stage.
The recent news flow provides some context. While much of the breaking news focuses on Gold and its reaction to upcoming CPI reports, and the USD/JPY pair's reaction to intervention fears, the underlying sentiment regarding central bank policies remains a key driver for major currency pairs like GBPUSD. The market is keenly awaiting any hints from the Bank of England (BoE) and the Federal Reserve (Fed) regarding future interest rate paths. Any indication of a more hawkish stance from the BoE, perhaps due to persistent inflation concerns in the UK, could provide a strong tailwind for GBPUSD. Conversely, any dovish signals from the Fed, especially if inflation data continues to cool, could weaken the dollar and, by extension, support the pair.
The UK's economic data releases, such as PMI figures, inflation reports (CPI), and employment data, will be crucial in shaping BoE policy expectations. Similarly, upcoming US data, particularly the CPI report mentioned in the news, will heavily influence Fed rate decisions. If UK inflation proves more stubborn than anticipated, it could force the BoE into further tightening, thereby boosting the Pound. On the flip side, if US inflation shows a significant cooling trend, it might solidify expectations for a Fed rate cut sooner rather than later, weakening the US Dollar and potentially pushing GBPUSD higher.
The Bullish Case: Breaking the Ceiling at $1.35
For the bulls to truly take control, a decisive and sustained break above the $1.35121 resistance on the 1-hour chart is paramount. This initial hurdle needs to be cleared with conviction, ideally accompanied by strong trading volume. If this level gives way, the next significant resistance to watch is $1.35153, followed by $1.35211. A successful breach of these levels would likely trigger further buying pressure, as traders who were on the sidelines might jump in to chase the momentum. The 1-day chart's bullish trend strength of 91% and the RSI at 60.37 provide a solid foundation for such a move, suggesting that the underlying trend remains intact.
The bullish scenario hinges on confirmation from fundamental data. If upcoming UK economic indicators, such as employment figures or inflation data, come in stronger than expected, it could embolden the Bank of England to maintain a hawkish tone, thereby supporting the Pound. Simultaneously, if US inflation data, particularly the awaited CPI report, shows a continued deceleration, it might reinforce the market's expectation of a Fed pause or even a future rate cut. This combination of a strong domestic outlook for the UK and a potentially weakening US Dollar could provide the perfect catalyst for GBPUSD to break out of its current range and establish new highs.
From a technical perspective, a bullish breakout would ideally see the price decisively close above the $1.35307 daily resistance level. Should this occur, the path could be cleared towards the next significant resistance levels, potentially targeting $1.35558 and even $1.35828 in the medium term. The ADX on the 4-hour chart at 33.34 suggests a strong trend is in place, which could accelerate if the $1.35 barrier is overcome. The Stochastic Oscillator on the 1-day chart, while currently in overbought territory, could potentially remain elevated in a strong uptrend, especially if momentum continues to build. This scenario requires a clear break of immediate resistance and positive fundamental news flow.
The Bearish Scenario: Reclaiming Control Below $1.35
Conversely, the bears have a clear line in the sand: the $1.35 level. A failure to decisively break and hold above the immediate resistance at $1.35121 could signal a rejection of higher prices. If the price fails to break through and instead starts to pull back, the first level of support to watch is $1.35031 on the 1-hour chart, followed by $1.34973 and $1.34941. A break below these levels would increase the probability of a deeper retracement, potentially targeting the 4-hour support at $1.34957 and further down to $1.34866.
The conflicting signals on the oscillators are key here. The overbought Stochastic on the 1-day chart (K=90.32, D=82.64) is a significant warning sign. If this leads to a downward turn, coupled with negative MACD momentum on the 4-hour chart, it could initiate a significant sell-off. Fundamentally, this scenario would be supported by stronger-than-expected UK inflation or employment data that causes the market to price in a more aggressive BoE stance, potentially leading to fears of a UK recession, or conversely, by surprisingly strong US inflation data that bolsters the dollar. A hawkish BoE reaction to stubborn inflation could paradoxically strengthen the pound initially but then lead to recession fears, creating a bearish outlook.
If the bears manage to regain control, the price could fall back towards the daily support levels, starting with $1.34791. A decisive break below this level would invalidate the current bullish structure and open the door for a test of the $1.34526 support. Further down, $1.34275 represents a more significant floor. The ADX on the 1-day chart at 22.3 suggests a trend is developing, which could accelerate if key support levels are breached. The RSI on the 1-day chart, currently at 60.37, would need to fall significantly, ideally below 50, to confirm a bearish shift in momentum.
The Neutral Ground: Waiting for Clarity
In the absence of a clear breakout or breakdown, GBPUSD could enter a period of consolidation. This neutral scenario typically occurs when market participants are waiting for definitive fundamental catalysts or when technical signals are mixed and indecisive. The current situation, with conflicting indicators across different timeframes and a key resistance level at $1.35, lends itself to such a scenario. Price could oscillate between the immediate support and resistance levels, creating a range-bound environment.
During this phase, traders might look for confirmation from other correlated assets or broader market sentiment. For instance, if the DXY enters a strong trending phase, it could provide a clearer direction for GBPUSD. Similarly, if major equity indices like the SP500 or Nasdaq show significant directional moves, it might spill over into currency markets. The ADX readings across different timeframes (1H: 12.2, 4H: 33.34, 1D: 22.3) also suggest a lack of a strong, consistent trend, further supporting the possibility of a neutral period. This consolidation could be a precursor to a larger move, but it requires patience and careful observation of the key levels.
A neutral stance implies that neither the bulls nor the bears have established firm control. Price might consolidate between the 1-hour support at $1.34941 and resistance at $1.35211. The 4-hour indicators, particularly the MACD showing negative momentum and the Stochastic signaling a potential drop, might suggest that the path of least resistance is slightly to the downside within this range, but without a clear break of support, a move back towards the upper range boundaries remains possible. This waiting game is often characterized by lower trading volumes and a lack of strong directional conviction.
The Most Likely Path: A Probabilistic Outlook
Considering the confluence of factors, the current technical setup for GBPUSD presents a complex picture. The 1-day chart shows a strong bullish trend (91% strength) with an RSI at 60.37, suggesting underlying strength. However, the overbought Stochastic (K=90.32) on the same timeframe, combined with the immediate resistance at $1.35107 and the mixed signals on the 1-hour and 4-hour charts, introduces significant caution. The ADX readings are also somewhat conflicting, with a strong trend on the 4-hour (33.34) but weaker trends on the 1-hour (12.2) and 1-day (22.3) charts.
Given the proximity to a major resistance level and the overbought signals on the daily Stochastic, the probability of a significant breakout without a prior consolidation or pullback seems somewhat diminished in the immediate short term. Therefore, a scenario of consolidation or a mild pullback before any potential sustained upward move appears more likely in the very near term. I would assign a 55% probability to a neutral to slightly bearish short-term outlook (consolidation or minor pullback), followed by a 35% probability for a bullish continuation IF key resistance is decisively broken, and a 10% probability for a sharp bearish reversal.
This probabilistic outlook is heavily dependent on upcoming fundamental data. A stronger-than-expected CPI report from the US, for instance, could quickly shift sentiment and boost the dollar, leading to a bearish outcome for GBPUSD. Conversely, positive news from the UK economy or a dovish surprise from the Fed could fuel the bullish scenario. The current price action near $1.35 suggests indecision, and it's often prudent to wait for clearer signals rather than forcing a trade in such an environment. The market is essentially waiting for a catalyst to break the current equilibrium.
What I'm Watching This Week: Key Triggers for GBPUSD
To navigate this complex landscape, traders must keep a close eye on several key triggers. Firstly, the immediate price action around the $1.35107 mark is critical. A sustained break above $1.35307 on the daily chart, confirmed by strong volume and positive follow-through, would be a significant bullish signal. Conversely, a decisive close below the 1-hour support at $1.34941 could invalidate the immediate bullish setup and open the door for further downside.
Secondly, upcoming economic data releases from both the UK and the US will be paramount. The US CPI report, due soon, is a major event that could significantly influence the DXY and, consequently, GBPUSD. Stronger-than-expected inflation could lead to a dollar rally, while cooler figures might weaken it. Similarly, UK employment and inflation data will provide crucial insights into the BoE's potential policy path. Any surprises in these releases could quickly shift market sentiment and provide the catalyst needed for a directional move.
Finally, keep an eye on the broader market sentiment and risk appetite. If global equity markets, such as the SP500 (currently at 6572.87) and Nasdaq (at 29537.53), continue to show signs of weakness or enter a consolidation phase, it could increase demand for safe-haven assets, potentially impacting GBPUSD. The correlation with the DXY also needs careful monitoring; any clear directional move in the dollar index could provide a strong indication of the likely direction for GBPUSD.
Bearish Scenario: Resistance Holds Firm
10% ProbabilityNeutral Scenario: Sideways Consolidation
55% ProbabilityBullish Scenario: Breakout Above $1.35
35% ProbabilityFrequently Asked Questions: GBPUSD Analysis
What happens if GBPUSD breaks above the $1.35307 resistance level?
A sustained break above $1.35307, especially with strong volume, would signal a bullish continuation. This could trigger further buying, potentially targeting $1.35558 and then $1.35828, supported by positive UK economic news or dovish Fed policy expectations.
Is the RSI at 60.37 a sell signal for GBPUSD right now?
An RSI of 60.37 on the daily chart indicates a strong uptrend but is approaching overbought territory. While not an immediate sell signal, it suggests caution and a potential for a pullback or consolidation before any further significant upward moves. Confirmation from other indicators like the Stochastic Oscillator is needed.
How will the upcoming US CPI report affect GBPUSD this week?
A stronger-than-expected US CPI report could boost the Dollar Index (DXY) and put downward pressure on GBPUSD, potentially invalidating bullish scenarios. Conversely, cooler inflation figures might weaken the dollar, supporting a move higher for GBPUSD, especially if UK data remains robust.
Should traders consider buying GBPUSD at current levels near $1.35?
Given the resistance at $1.35 and conflicting signals on shorter timeframes, entering at current levels carries risk. A more prudent approach might be to wait for a confirmed breakout above $1.35307 or a pullback to a key support level like $1.34791, offering a better risk-reward ratio.
The market is at a critical juncture for GBPUSD, with the $1.35 level acting as a significant psychological and technical barrier. While the longer-term trend shows underlying strength, the overbought conditions on shorter timeframes and conflicting oscillator signals warrant caution. The upcoming economic data releases from both the US and the UK will be the key catalysts to watch, potentially providing the clarity needed to break the current indecision. Patience and a data-driven approach will be crucial for navigating this period of uncertainty.
Technical Outlook Summary
| Indicator | Value | Signal | Interpretation |
|---|---|---|---|
| RSI (14) | 60.37 | Neutral | Approaching overbought, suggests caution. |
| MACD Histogram | Positive | Bullish | Momentum building on longer timeframes. |
| Stochastic | K=90.32, D=82.64 | Bearish | Daily chart is overbought, potential pullback. |
| ADX | 22.3 | Neutral | Trend strength is moderate, lacks strong conviction. |
| Bollinger | Upper Band | Watch | Price near upper band, potential for reversal or breakout. |
Key Levels
Track markets in real-time
AI-powered analysis, technical indicators and real-time price data.
Join Our Telegram Channel
Breaking market news, AI analysis and trading signals instantly.
Join Channel