

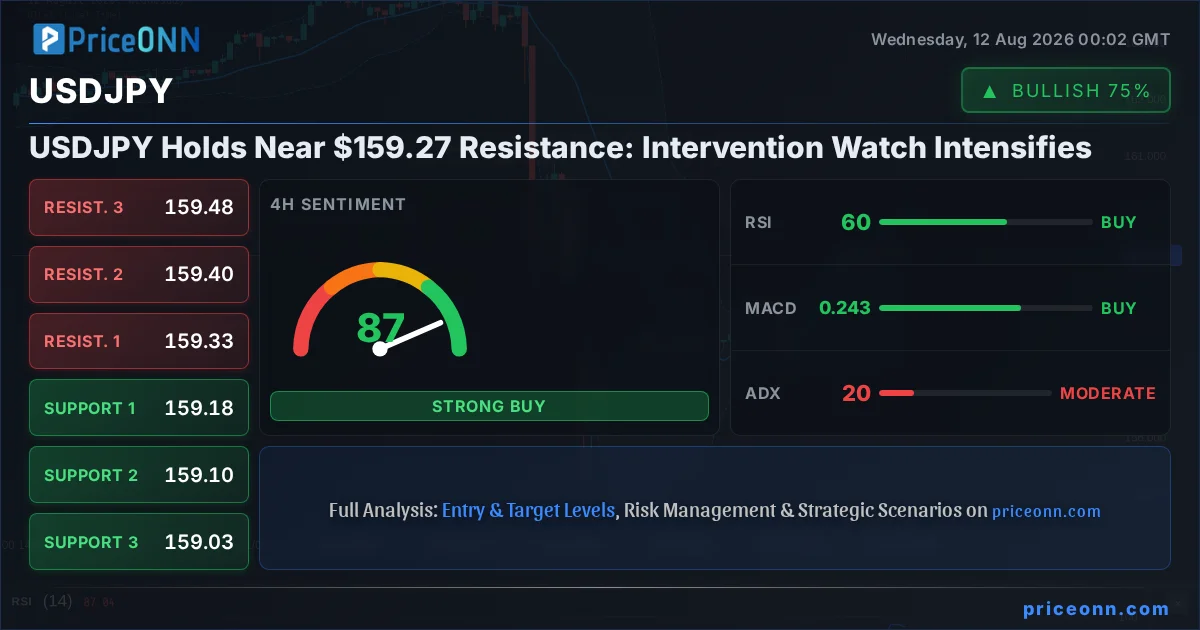
This is where it gets interesting. The USDJPY pair is teetering precariously near the significant psychological resistance level of $159.27. For weeks, we’ve watched this currency pair dance around this critical juncture, and now, with the Dollar Index (DXY) showing tentative strength and Japanese authorities hinting at potential action, the tension is palpable. The question on every trader's mind isn't just *if* intervention will happen, but *when* and *how* it will play out. Having tracked USDJPY through numerous cycles, I can tell you that these moments of indecision often precede the most explosive moves. The current price action suggests a market holding its breath, waiting for a catalyst to break the stalemate.
- USDJPY is currently trading at $159.27, testing a key resistance level.
- The DXY is showing tentative strength, currently at 99.83, influencing USDJPY dynamics.
- Technical indicators like RSI at 59.41 (1H) suggest upward momentum, but ADX at 13.72 points to a weak trend, indicating potential for a breakout or reversal.
- Japanese officials have signaled concern over rapid yen depreciation, raising the possibility of intervention.
- The 4-hour chart shows a strong uptrend with ADX at 20.47, while the daily chart presents a bearish outlook with RSI at 42.63 and a strong downtrend signal.
The 1-hour chart paints a picture of a market caught between short-term bullish momentum and a lack of conviction. With the RSI at 59.41, buyers are still in the game, but the ADX at a mere 13.72 tells a different story. This weak trend strength signifies that the recent upward push might be more of a grind than a committed rally. It’s a classic scenario where a lack of strong directional conviction can lead to sharp reversals if sentiment shifts. The Stochastic Oscillator, with %K at 45.71 and %D at 60.52, is also signaling a potential drop, indicating that the current upward momentum might be losing steam. This divergence between RSI suggesting some strength and Stochastic pointing downwards creates a 'wait-and-see' atmosphere.
Navigating the Short-Term Chop
On the 1-hour timeframe, the immediate price action around $159.27 is critical. The Bollinger Bands are hugging the middle band, indicating consolidation, but the slight upward tilt suggests bulls are trying to push higher. The MACD histogram is negative, which, while indicating recent downward momentum, can also signal that a reversal might be brewing if the price continues to climb. The immediate resistance is clearly defined at $159.289, with further levels at $159.314 and $159.333. Conversely, immediate support lies at $159.245, followed by $159.226 and $159.201. A break above the $159.333 resistance could trigger a short-term rally, but given the weak ADX, this breakout might lack follow-through. Traders looking for short-term opportunities will be watching for a clear break of either these immediate support or resistance levels, with a preference for positions that align with a more sustained trend, which the current 1-hour chart does not strongly provide.
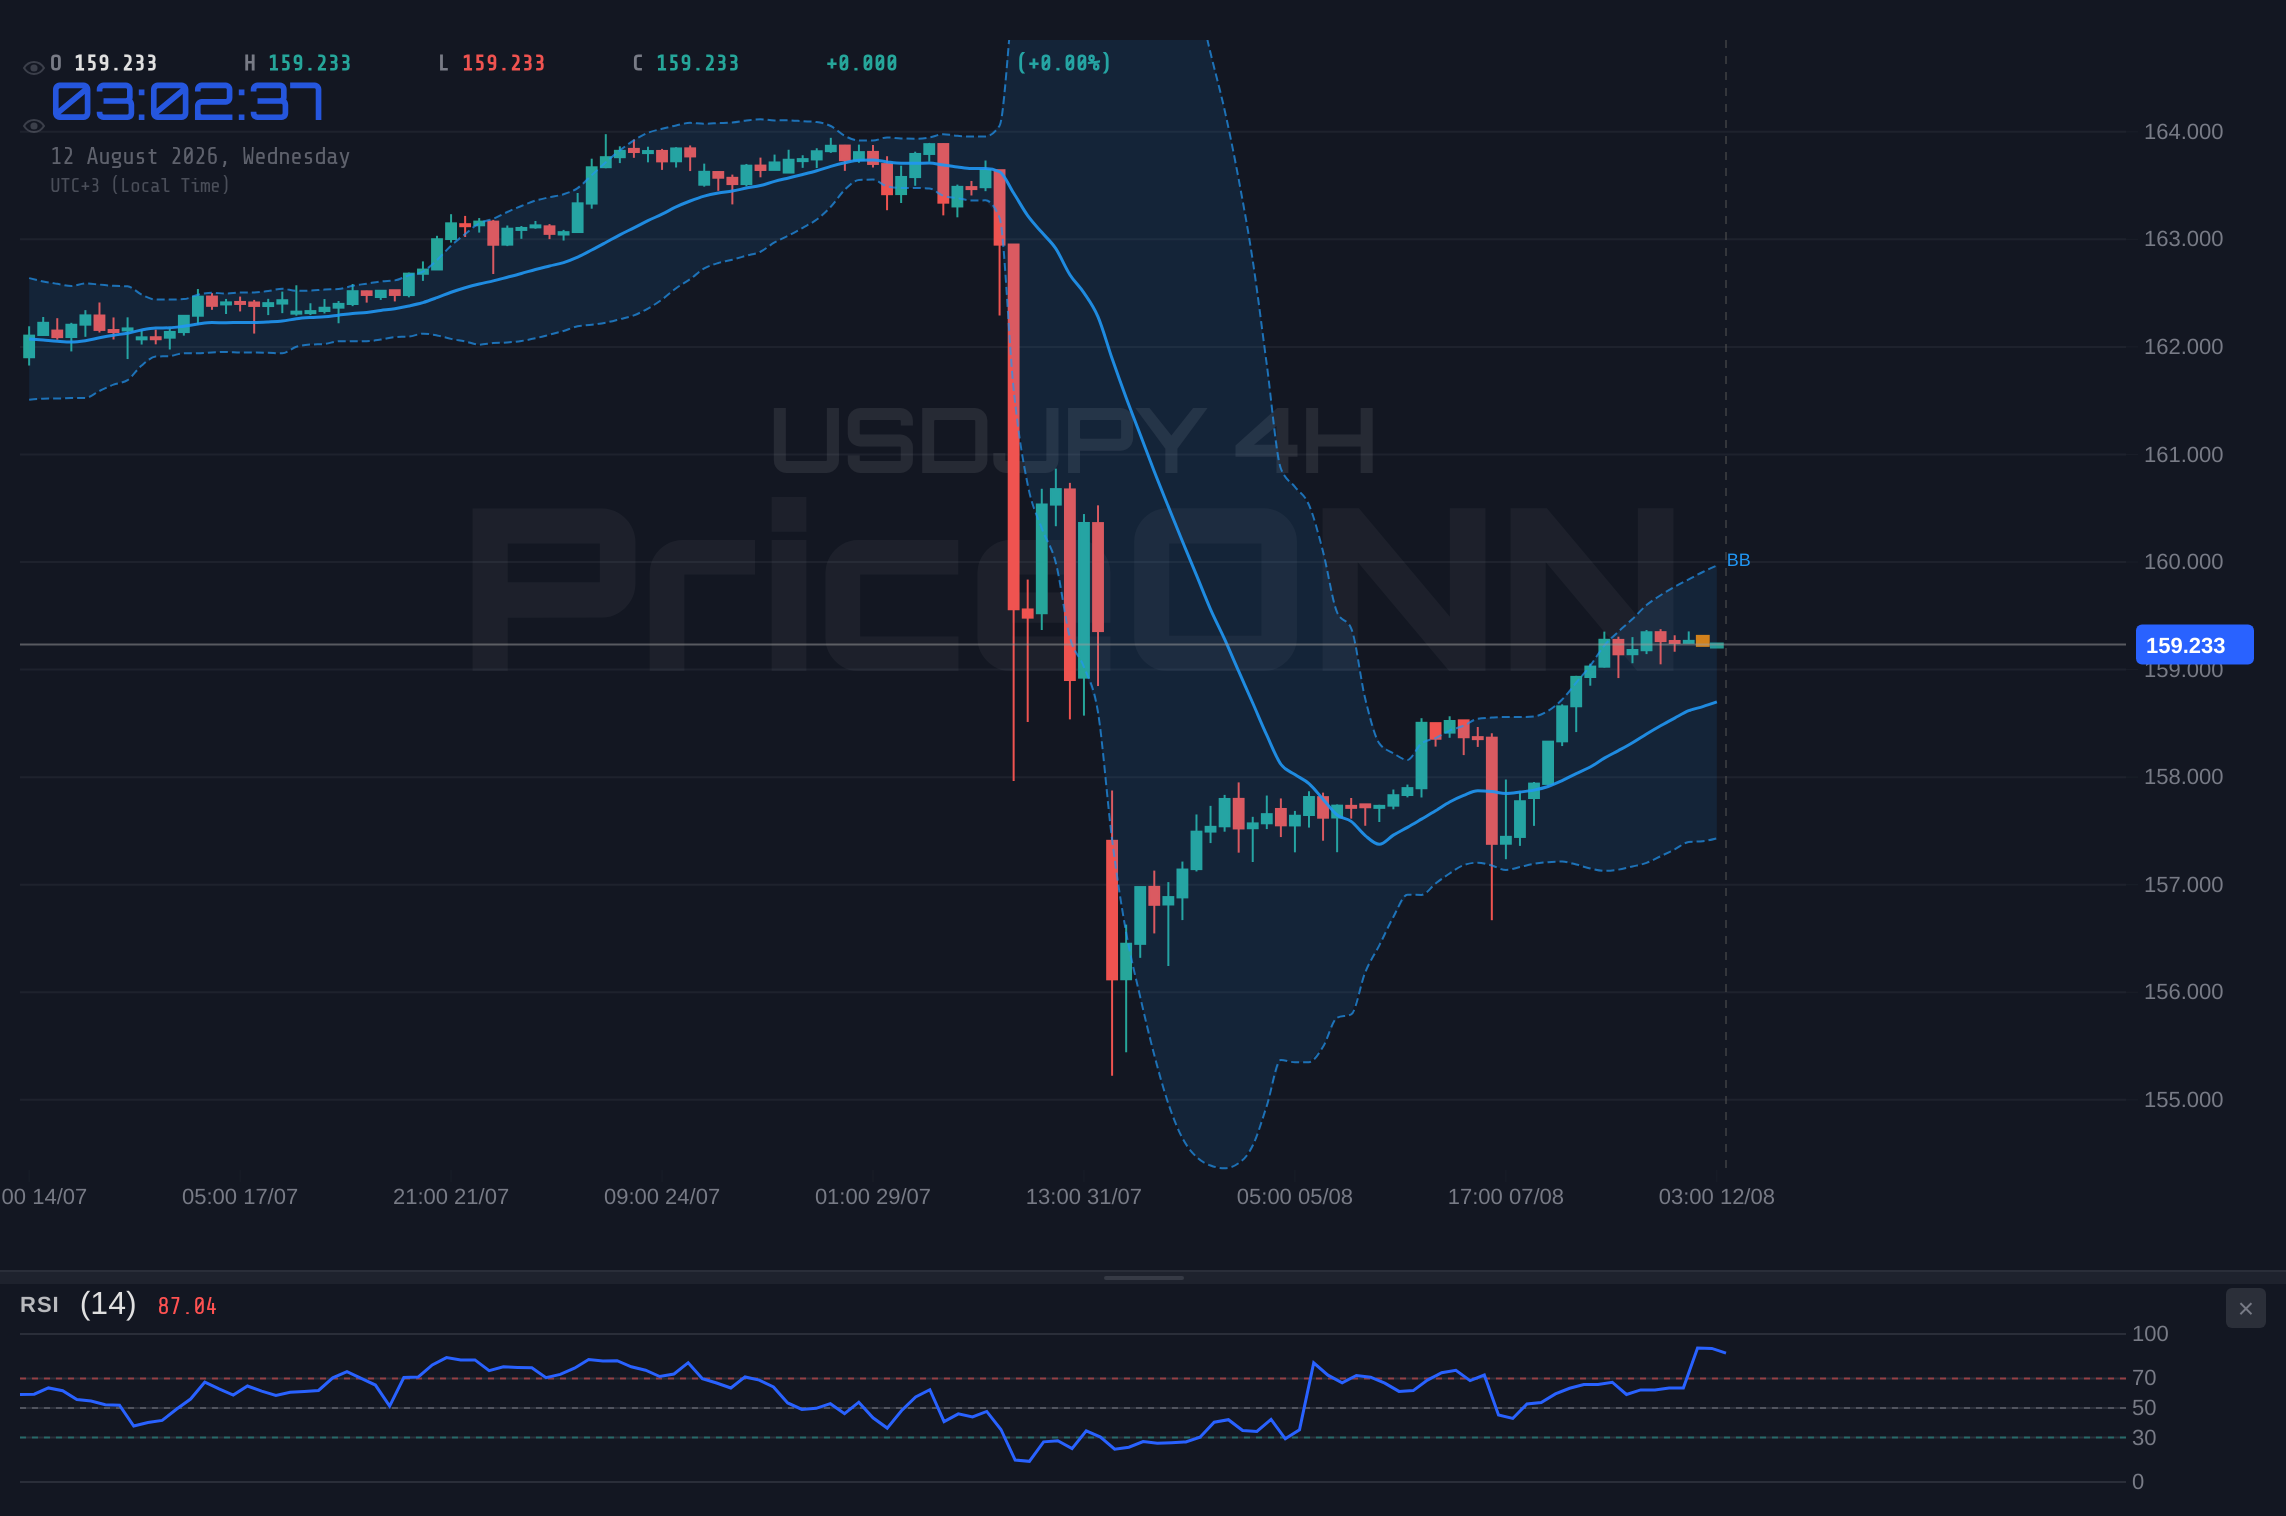
The recent news flow adds another layer of complexity. Reports from August 10th highlighted concerns over the USD/JPY pair following U.S.-Japan intervention discussions. While the Dow Jones Index reached new record highs last week, driven by strong earnings, the focus for USD/JPY has been on monetary policy divergence and potential FX intervention. This is a crucial element; when central banks begin to signal or enact intervention, it can override technical patterns. The Japanese Ministry of Finance has been vocal about the rapid depreciation of the yen, and while they haven't explicitly stated intervention is imminent, the language used has become increasingly firm. This 'jawboning' itself can put pressure on the pair, creating a risk for any aggressive bullish bets.
The Daily Chart's Divergent Signal
Shifting our gaze to the daily chart, the picture becomes more complex, revealing a potential bearish divergence. While the 1-hour and 4-hour charts show some signs of upward momentum or consolidation, the daily timeframe presents a strong downtrend signal. The RSI(14) is sitting at 42.63, well within the neutral territory but clearly trending downwards, suggesting that the bears are gaining ground over a longer period. The MACD is also negative, with the histogram below the signal line, reinforcing this bearish sentiment. Furthermore, the price is trading below the middle Bollinger Band, indicating a bearish bias on the daily close. The ADX at 37.1 confirms a strong downtrend, a stark contrast to the weak trend strength seen on the 1-hour chart. This creates a significant conflict: short-term indicators might hint at a bounce, but the overarching daily trend suggests that any upward moves are likely to be met with selling pressure.
The Stochastic Oscillator on the daily chart, with %K at 41.18 and %D at 30.65, is showing a bullish signal as %K crosses above %D. However, this occurs within a broader bearish context. Such signals often represent temporary oversold bounces within a larger downtrend, rather than a sustained reversal. The fact that these 'bullish' Stochastic signals are appearing while the RSI and ADX are firmly bearish highlights the potential for a bear market rally that ultimately fails. The key daily support levels to watch are $158.098, $156.92, and $156.292. A decisive break below $158.098 would confirm the bearish outlook and likely accelerate the downward move, potentially targeting the $156.92 support. The resistance levels on the daily chart, $159.904, $160.532, and $161.71, appear increasingly formidable given the prevailing downtrend.
This divergence between timeframes is precisely where skilled traders find their edge. The short-term charts might offer fleeting opportunities for scalpers or day traders who can capitalize on minor fluctuations. However, for swing and position traders, the daily chart's narrative is paramount. The risk of a bear flag or pennant formation on the daily chart, poised to break lower, is significant. The recent news about the weak US dollar, which plummeted amid a decline in US employment on August 10th, could typically support USD/JPY. However, the yen's own weakening against the dollar, driven by interest rate differentials and the Bank of Japan's ultra-loose monetary policy, seems to be the dominant factor. The market is currently grappling with whether the 'carry trade' (borrowing low-interest yen to invest in higher-yielding assets) will prevail over safe-haven flows or intervention fears.
Correlation Analysis: DXY and Equities
Understanding the correlation with other major markets is crucial for a holistic view. The Dollar Index (DXY), currently trading at 99.83, is a key driver for USD/JPY. When the DXY strengthens, it typically puts pressure on USD/JPY, as the dollar gains value against a basket of major currencies. Conversely, a weakening DXY can support USD/JPY. Currently, the DXY is showing tentative strength on the 1-hour and 4-hour charts, which aligns somewhat with the short-term bullish leanings in USD/JPY. However, the daily DXY chart presents a bearish trend with RSI at 40.29 and ADX at 28.85, indicating that the dollar's broader weakness might persist. This creates a conflicting signal: short-term dollar strength could provide tailwinds for USD/JPY, but the longer-term dollar downtrend poses a risk.
Equity markets, particularly the S&P 500 and Nasdaq, serve as a barometer for risk appetite. The S&P 500 is currently at 6572.87, showing a strong daily uptrend (ADX 47.51), though its 1-hour RSI at 70.95 suggests it's in overbought territory, potentially due for a pullback. The Nasdaq, at 29548.38, shows a mixed picture, with a strong daily uptrend signal (ADX 19.38) but a weaker 1-hour trend. Generally, a strong risk-on sentiment (rising equities) can sometimes coincide with USD/JPY strength, as investors seek higher yields. Conversely, a 'risk-off' environment (falling equities) might see a flight to safety, potentially benefiting the Japanese Yen and pressuring USD/JPY. The current mixed signals from equities add another layer of uncertainty, suggesting that correlations might not provide a clear directional bias in the immediate term.
The correlation between USD/JPY and gold prices is also worth noting. Gold, currently near $4,400, has been rallying, driven by expectations of a Fed pause and safe-haven demand. Historically, a strong yen (which would mean a lower USD/JPY) often correlates with higher gold prices as both act as safe havens. However, the current situation is complex. If intervention successfully weakens the yen significantly, it could decouple from gold's broader safe-haven appeal. The news on August 11th, stating gold rallies due to 'long-awaited rise and growing safe-haven demand,' highlights this dichotomy. If the yen weakens due to intervention, it might move counter to gold's safe-haven trend, creating an interesting divergence for traders to monitor.
The Intervention Specter
The most significant wildcard remains the possibility of direct intervention by Japanese authorities. The consistent warnings about the yen's rapid depreciation, coupled with the price approaching the $159.30-159.50 area, have kept intervention fears alive. The Ministry of Finance has repeatedly stated they are monitoring currency markets with a 'high sense of urgency.' While they haven't acted yet, the historical precedent suggests that intervention typically occurs when the yen weakens rapidly past certain psychological levels, or when the pace of depreciation becomes unsustainable. The $160 level is often cited as a potential trigger point, but intervention could occur sooner if the depreciation accelerates.
What does intervention look like? It typically involves the Bank of Japan selling dollars and buying yen in the foreign exchange market. This action directly increases demand for the yen, theoretically pushing its value up and USD/JPY down. However, the effectiveness of intervention is debated. Large-scale, coordinated intervention can be effective in the short term, but sustained moves usually require fundamental shifts in monetary policy or economic outlook. Unilateral intervention, especially by a single country like Japan, often has a temporary impact, with the underlying economic fundamentals eventually reasserting themselves. Nevertheless, the *threat* of intervention is often enough to cause significant volatility and force traders to cover their short yen positions, leading to sharp, albeit potentially short-lived, yen rallies.
For traders, the intervention risk means that any upward move in USD/JPY could be abruptly halted. A sudden, sharp drop in USD/JPY would be the clearest sign of intervention. This is why managing risk is paramount. Holding a long position above $159.50 without considering the intervention risk would be akin to gambling. Instead, traders should look for confirmation signals that intervention is either unlikely or has already occurred and failed. For instance, if USD/JPY breaks decisively above $160 despite the warnings, it might suggest that authorities are either unwilling or unable to intervene effectively at that level, or that the underlying bullish momentum is too strong to be countered by FX operations alone. Conversely, a sharp drop from current levels would confirm intervention fears.
Bearish Scenario: Intervention Takes Hold
65% ProbabilityNeutral Scenario: Consolidation Near Resistance
25% ProbabilityBullish Scenario: Breakout Above Resistance
10% ProbabilityFrequently Asked Questions: USDJPY Analysis
What happens if USDJPY breaks above the $159.333 resistance level?
A sustained break above $159.333 on the 1-hour chart, especially with increasing volume, could signal a short-term bullish move. However, given the weak ADX of 13.72, such a breakout might lack follow-through. The key is to see if it can hold above $159.500, which would then invalidate the immediate intervention fears and potentially target $160.000.
Should I consider selling USDJPY at the current $159.27 levels given the daily downtrend signal?
Selling at current levels carries risk due to the short-term consolidation and potential for a bounce. The daily chart's bearish signals (RSI 42.63, ADX 37.1) suggest selling rallies is a more prudent strategy. A confirmed break below the 1-hour support at $159.201 would provide a better entry point for a bearish trade, targeting $158.921, aligning with the daily trend.
Is the RSI at 59.41 on the 1H chart a buy signal for USDJPY, despite the weak trend?
An RSI of 59.41 indicates some upward momentum but is not yet in overbought territory. However, the extremely weak ADX of 13.72 on the 1-hour chart suggests that this momentum is not supported by a strong trend. This combination makes it a weak buy signal, implying that any upward move might be short-lived and susceptible to reversal, especially if intervention fears escalate.
How will the possibility of Japanese intervention affect USDJPY trading this week?
The threat of intervention significantly increases volatility and the risk of sharp, sudden moves, particularly to the downside for USD/JPY. Traders should be cautious of chasing rallies above $159.500. A confirmed intervention would likely lead to a rapid depreciation of the dollar against the yen, pushing USD/JPY lower, potentially targeting levels below $159.000 as traders cover their positions.
The market is at a critical juncture for USD/JPY. While short-term technicals show some signs of life, the overarching daily trend and the looming specter of Japanese intervention create a high-risk environment. The key levels around $159.27 and $159.50 are where the battle lines are drawn. Traders must remain vigilant, manage their risk meticulously, and wait for clear confirmation before committing to a significant position. Patience, as always, will be rewarded.
Track markets in real-time
AI-powered analysis, technical indicators and real-time price data.
Join Our Telegram Channel
Breaking market news, AI analysis and trading signals instantly.
Join Channel