

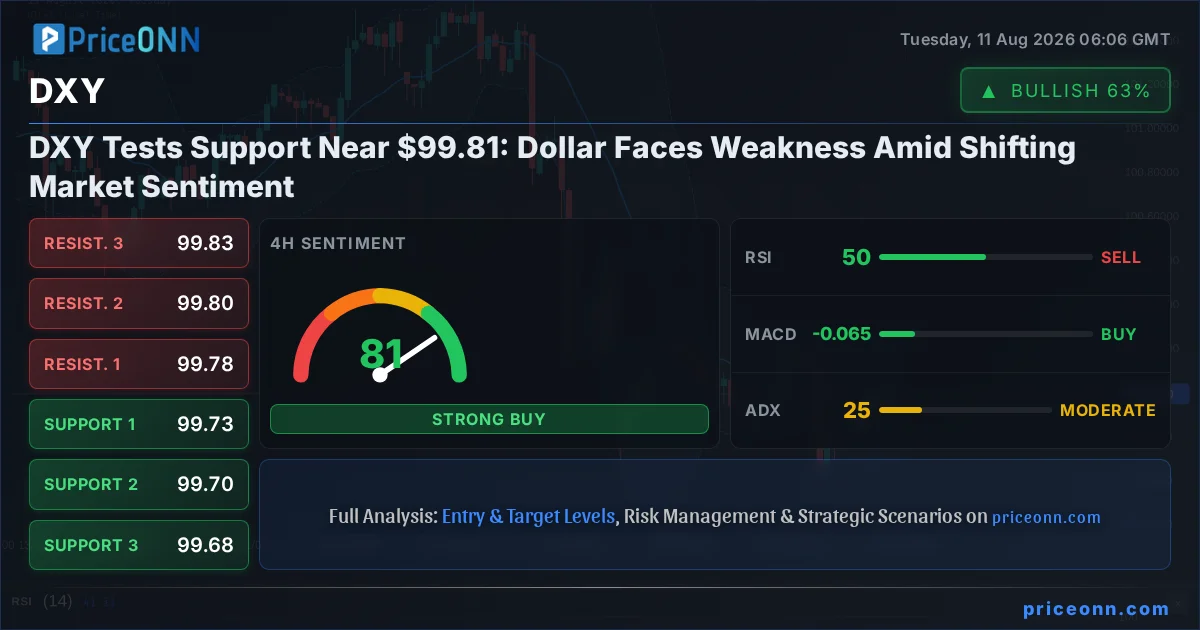
The U.S. Dollar Index (DXY) is currently hovering around the critical $99.81 mark, a level that technical analysts are watching with bated breath. After a period of strength, the greenback appears to be faltering, a shift that could have significant ripple effects across global markets. This isn't just another daily fluctuation; the confluence of technical signals and underlying market sentiment suggests we might be at an inflection point for the dollar's trajectory. The question on many traders' minds is whether this current support will hold, or if we're about to witness a more substantial dollar pullback.
- The DXY is currently trading at $99.81, testing key support levels.
- Daily RSI at 39.92 indicates waning bearish momentum, potentially signaling a shift.
- A break below $99.72 support could accelerate dollar weakness towards $99.50.
- Conversely, reclaiming levels above $99.90 might reignite bullish sentiment.
The dollar's recent performance has been a dominant narrative in financial markets, influencing everything from major currency pairs to the price of gold. However, the data from the past 24 hours paints a slightly different picture. While the DXY is still technically in a downtrend on the daily chart with an ADX reading of 29.13, the intraday momentum is showing signs of stabilization around these lower levels. The 1-hour chart, for instance, shows a relatively neutral trend with an ADX of 14.55, indicating a pause in the immediate selling pressure. This divergence across timeframes is precisely what makes the $99.81 level so crucial right now. It's a battleground where the short-term technicals are attempting to counter the longer-term bearish trend.
Let's dive into the technicals. On the daily timeframe, the RSI is sitting at 39.92. While this is still in neutral territory, it's moving away from the oversold boundary, suggesting that the sellers might be losing some of their conviction. More importantly, the MACD histogram is negative, but its slope has been flattening, hinting that the bearish momentum could be waning. The Stochastic Oscillator, with K at 17.18 and D at 16.86, is showing a bullish crossover signal from deeply oversold conditions. This is a classic sign that a short-term bounce could be on the cards, provided other market conditions align. The Bollinger Bands on the daily chart are also showing the price hugging the lower band, but the band itself is beginning to widen slightly, which can precede a move back towards the middle band.
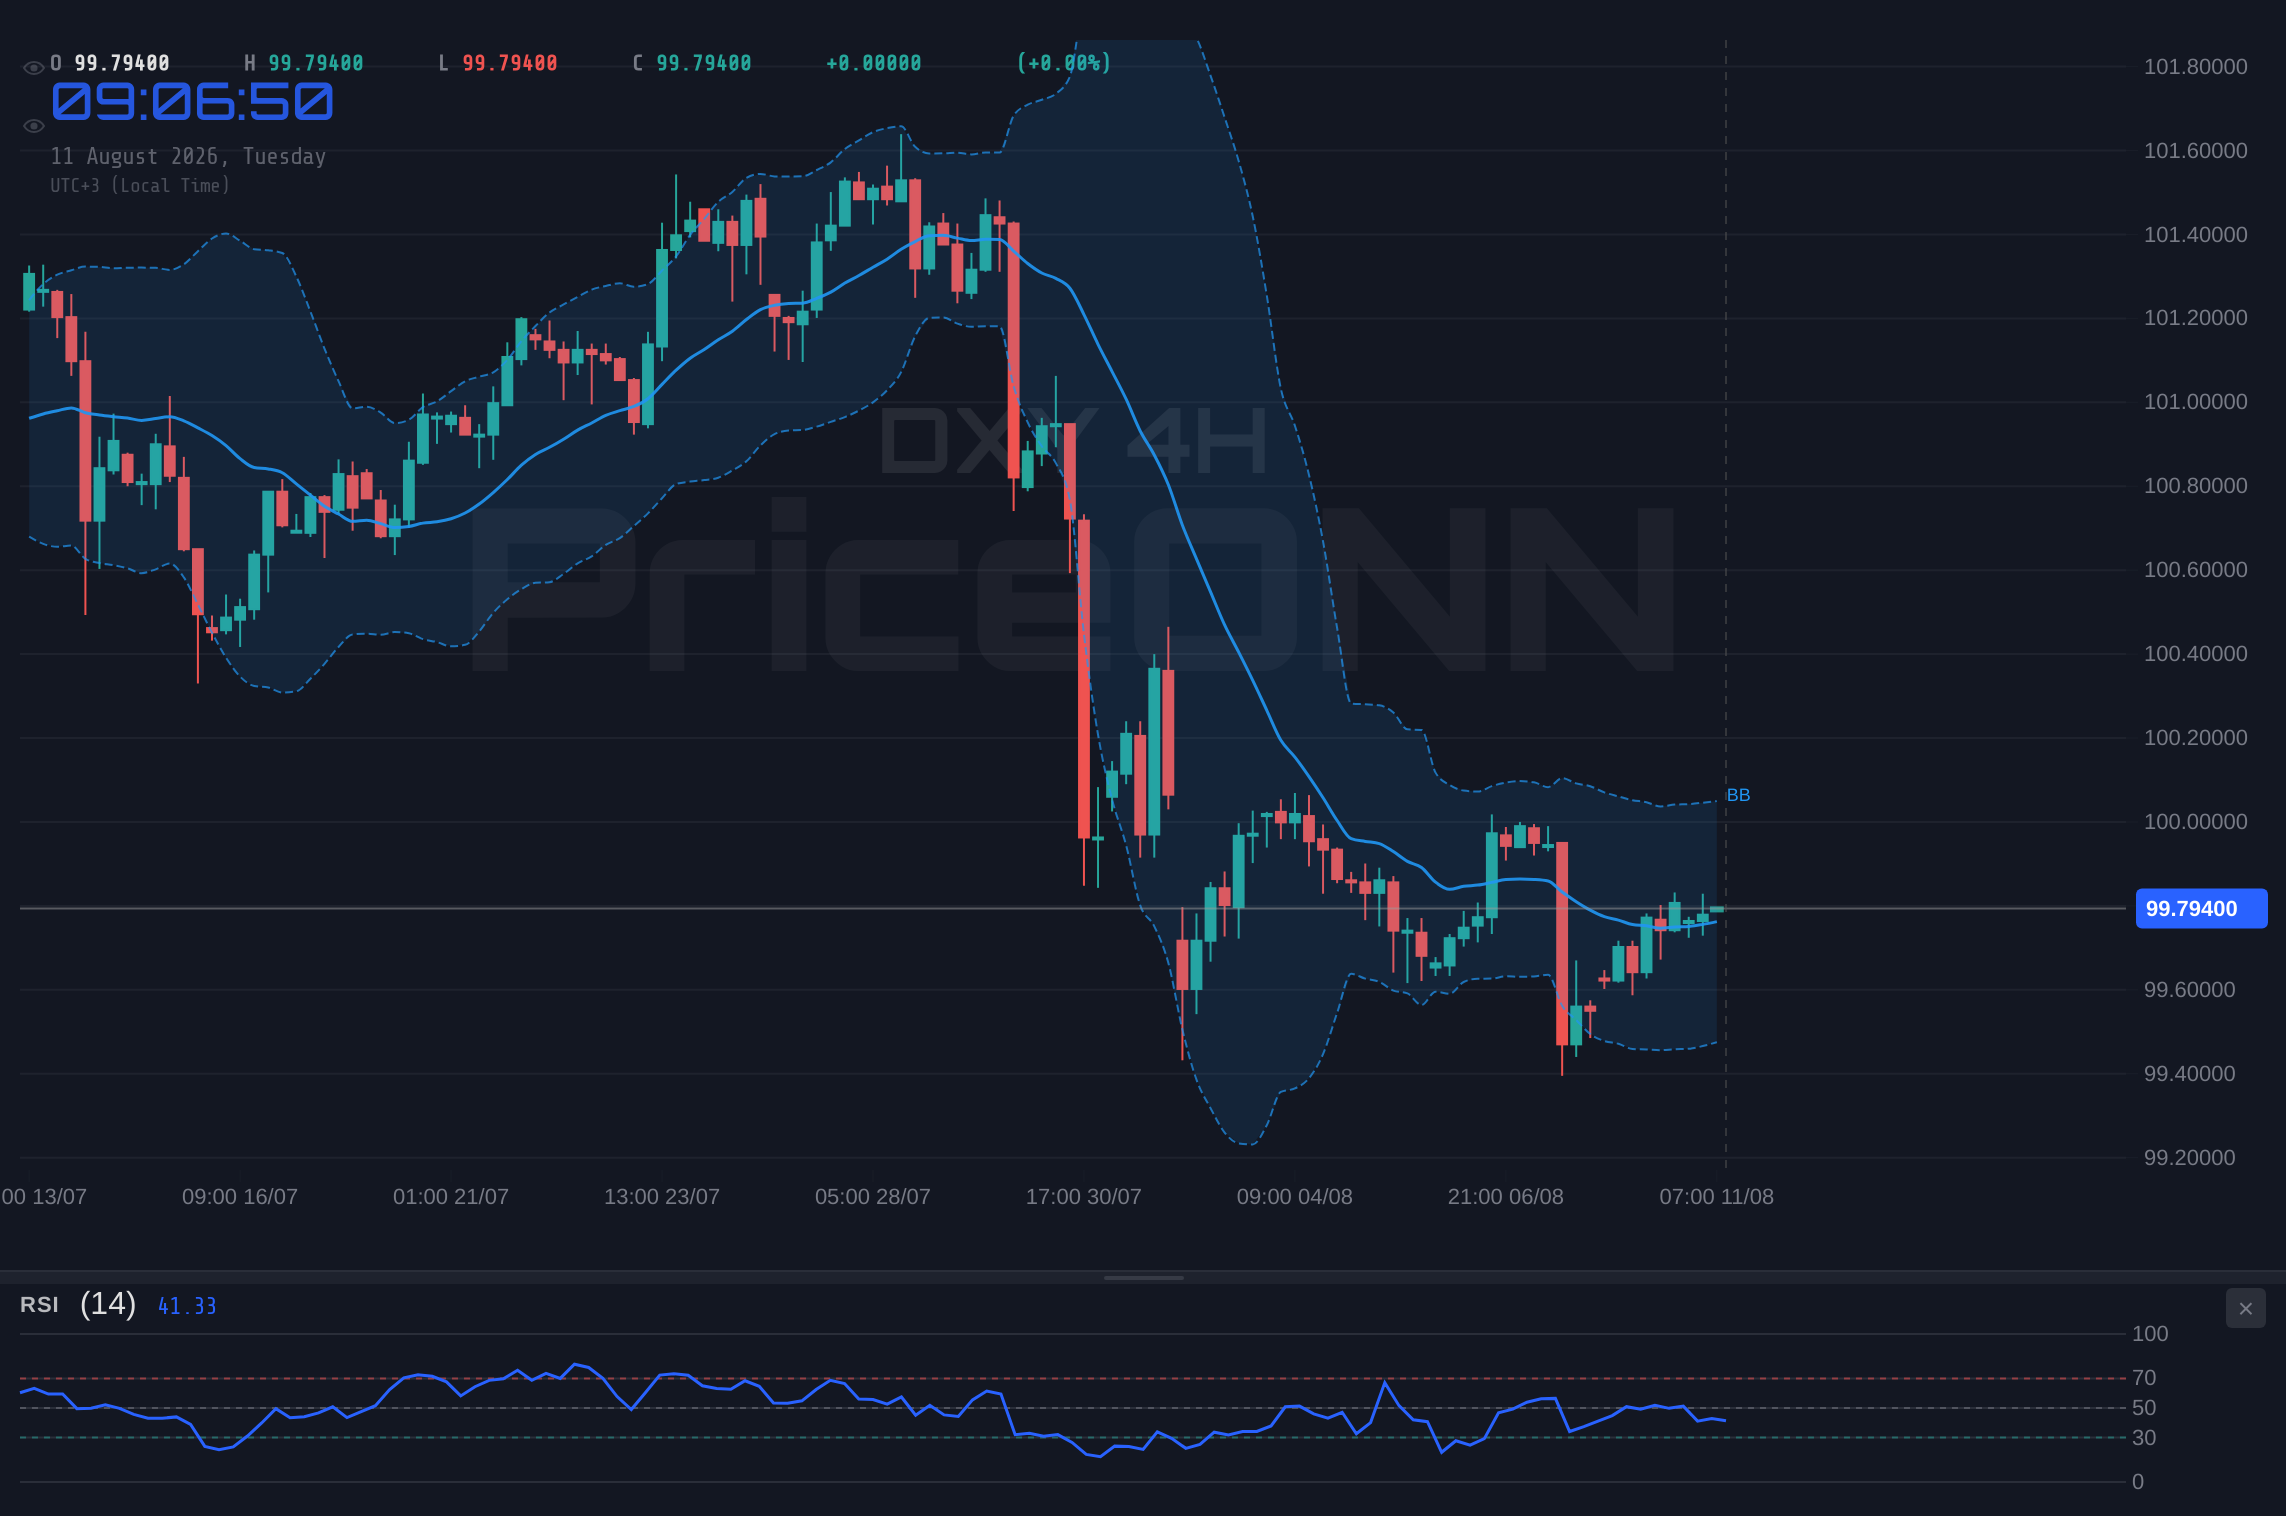
Decoding the Dollar's Daily Dance
The 1-hour chart offers a more immediate perspective on the dollar's struggle. Here, the trend is classified as neutral, with an ADX of 14.55, suggesting a lack of strong directional conviction in the very short term. The RSI at 56.92 is comfortably in neutral ground, showing neither overbought nor oversold conditions, which allows for more flexibility in price movement. The MACD is positive, with the histogram above the signal line, indicating some short-term buying interest. However, the Stochastic Oscillator, with K at 67.6 and D at 70.09, is showing a bearish crossover from overbought territory, a signal that could cap any immediate upside. This conflicting signal from the Stochastic on the 1-hour chart, versus the bullish potential on the daily, highlights the current indecision in the market.
The 4-hour timeframe presents a mixed bag. The trend is neutral, but the ADX at 24.65 suggests a moderate trend strength, which is higher than the 1-hour but lower than the daily's strong downtrend. The RSI at 49.33 is sitting right on the fence, offering no clear directional bias. The MACD is positive, suggesting some underlying buying pressure, while the Stochastic Oscillator shows K at 83.61 and D at 61.43, indicating a strong bullish signal from overbought conditions. This divergence between the RSI and Stochastic on the 4-hour chart, coupled with the positive MACD, adds another layer of complexity. It implies that while buyers might be stepping in, the momentum isn't yet strong enough to overcome the broader bearish sentiment seen on the daily chart.
The key support levels to watch are $99.72, $99.50, and $99.41. A decisive break below $99.72, especially on increasing volume, would invalidate any immediate hopes for a dollar rebound and could signal a continuation of the downtrend towards $99.50. Conversely, resistance lies at $99.81 (the current price), $99.90, and $100.14. For the dollar bulls to regain confidence, a sustained push above $99.90 is essential. This would not only break the immediate resistance but also start to challenge the short-term bearish momentum. The $100.14 level is a more significant hurdle, as breaking above it would signal a potential trend reversal on the intraday charts and could attract more significant buying.
Correlation: The Dollar's Dance Partners
Understanding the DXY's movement requires looking at its key correlative assets. The Dollar Index has an inverse relationship with gold (XAUUSD) and major currency pairs like EURUSD and GBPUSD. Currently, XAUUSD is trading at $4380.1, showing a slight daily dip but with strong bullish signals on the 4-hour and daily charts. The 4-hour RSI is at 67.58, and the ADX is a robust 49.76, indicating a strong uptrend. If the DXY weakens significantly from $99.81, we would expect gold to find further upward momentum, potentially testing its resistance levels. The fact that gold is showing resilience despite the dollar's current position around support suggests that underlying demand for safe havens might be increasing, or that market participants are anticipating a weaker dollar.
Similarly, EURUSD is trading at 1.15424. While the 1-hour and 4-hour charts show mixed signals with neutral trends, the daily chart presents a bullish picture with an RSI of 59.21 and a strong ADX of 27.49. A weakening DXY around $99.81 would typically support a move higher in EURUSD, potentially towards its daily resistance at 1.15738. GBPUSD, currently at 1.3515, also shows a predominantly bullish trend across timeframes, with strong ADX readings and RSI above 60 on the daily chart. A weaker dollar would likely fuel further gains in GBPUSD, targeting its resistance at 1.35558. These correlations are not just theoretical; they represent real-time market dynamics where a move in one asset directly impacts others.
The equity markets, represented by SP500 and Nasdaq100, often move inversely to the dollar during risk-off periods. SP500 is currently at 6572.87, showing a strong daily downtrend with an ADX of 47.51, despite a recent uptick. Nasdaq100 is at 29703.15, showing a mixed daily trend but with a strong uptrend on the 4-hour chart. If the dollar weakens significantly from $99.81, it could be interpreted as a sign of increasing risk appetite, potentially providing a tailwind for equities. However, the current technical picture for SP500 is bearish on the daily chart, suggesting that broader market sentiment might still be cautious. The interplay between dollar strength, risk appetite, and inflation expectations (often influenced by oil prices) creates a complex web that traders must navigate.
Navigating the Crossroads: Scenarios for the Dollar
Given the current technical setup, particularly the DXY's position at $99.81 and the mixed signals across different timeframes, several scenarios are plausible. The daily chart's bearish trend is undeniable, but the intraday indicators are showing signs of potential stabilization or even a short-term bounce. This creates a situation ripe for volatility and requires a nuanced approach rather than a blind directional bet.
Bearish Scenario: Dollar's Slide Continues
65% ProbabilityNeutral Scenario: Consolidation Around $99.81
25% ProbabilityBullish Scenario: Dollar Recovers
10% ProbabilityThe current technical landscape, particularly the daily chart's bearish undertones and the intraday signals of potential stabilization, favors a bearish continuation but with a caveat for a possible short-term bounce. The ADX reading of 29.13 on the daily chart underscores the strength of the prevailing downtrend. However, the RSI at 39.92 and the Stochastic crossover from oversold conditions on the same daily chart cannot be ignored. These suggest that while the larger trend is down, the immediate pressure might ease, leading to a period of consolidation or a minor retracement before any significant move.
For traders looking to capitalize on the DXY's movements, the $99.81 level is pivotal. A break below $99.72 could trigger a sell-off, aligning with the daily trend. This would likely see EURUSD and GBPUSD push higher, while XAUUSD could extend its gains. Conversely, if the dollar manages to reclaim ground above $99.90, it would signal a potential short-covering rally, possibly driven by shifting market sentiment or unexpected macroeconomic news. The key will be to observe the volume accompanying any price movement. A decisive break on high volume would lend more credibility to the directional move, whereas low-volume price action might indicate a temporary fluctuation within a larger range.
The economic calendar also plays a crucial role. While no major high-impact events are scheduled for the immediate session that directly target the dollar in this data snapshot, upcoming inflation reports or central bank commentary could easily sway market sentiment. Traders should remain vigilant for any news related to the Federal Reserve's policy stance, as this remains the primary driver for dollar strength or weakness. The recent reports about U.S. employment data, while mixed, have kept the Fed's future actions in focus. Any hints of a more hawkish stance could support the dollar, even if short-term technicals suggest otherwise, and vice-versa for a dovish outlook.
Ultimately, the DXY's current stance around $99.81 represents a critical juncture. The daily chart still points lower, but the intraday indicators are flashing warning signs for further immediate downside. The most probable scenario, given the data, is a period of consolidation or a minor bounce before the larger trend potentially resumes. However, the risk of a sharp move higher if key resistance levels are breached cannot be discounted. Careful risk management and a focus on price action around these key levels will be paramount for navigating the dollar's next move.
Frequently Asked Questions: DXY Analysis
What happens if DXY breaks below the $99.72 support level?
A break below $99.72 on the 1-hour chart would invalidate the immediate stabilization attempt and likely accelerate dollar weakness. This could push the DXY towards the $99.500 level, aligning with the daily bearish trend. Such a move would also likely see major currency pairs like EURUSD and GBPUSD advance further.
Is the RSI at 39.92 on the daily chart a buy signal for the DXY?
An RSI of 39.92 on the daily chart is not a direct buy signal but indicates that bearish momentum is waning and the market is moving away from oversold territory. It suggests that a short-term bounce is possible, but confirmation from other indicators and price action above key resistance levels like $99.90 would be needed for a more robust bullish signal.
How will the current mixed signals across timeframes affect DXY trading strategies?
The mixed signals between daily bearish trends and intraday stabilization necessitate a cautious approach. Traders might consider waiting for a clearer break above $99.90 or below $99.72 for higher-probability trades. Alternatively, focusing on shorter timeframes with tighter stop-losses could be employed, but with increased risk management.
How might upcoming economic data impact the DXY's movement around $99.81?
Upcoming economic data, particularly inflation reports or Federal Reserve commentary, could significantly influence the DXY's direction. Stronger-than-expected data or hawkish Fed tones could push the DXY above $99.90 resistance, while weaker data or dovish signals might accelerate a move below $99.72 support, impacting its correlation with risk assets.
Track markets in real-time
AI-powered analysis, technical indicators and real-time price data.
Join Our Telegram Channel
Breaking market news, AI analysis and trading signals instantly.
Join Channel