

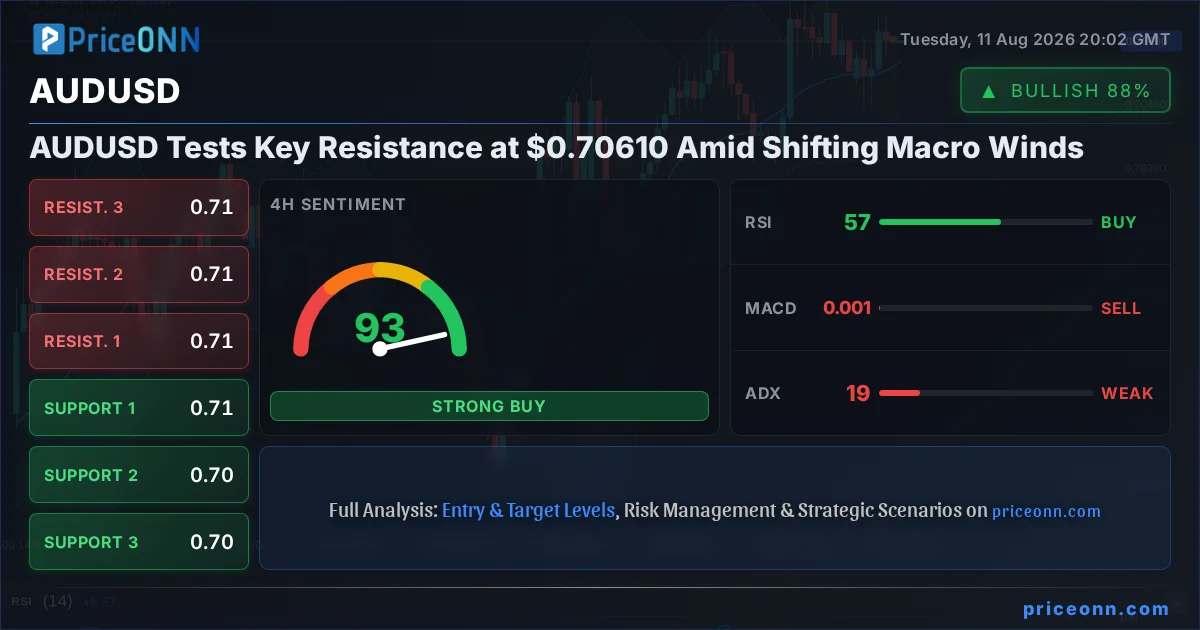
The Australian Dollar's dance with the US Dollar, AUDUSD, is currently at a critical juncture, trading at precisely $0.70610. This level isn't just a number; it represents a confluence of technical resistance and a pivotal point influenced by a complex global macroeconomic backdrop. As traders digest recent shifts in central bank sentiment and await key inflation figures, the path forward for AUDUSD appears fraught with both opportunity and risk. This analysis delves into the intricate interplay of fundamental drivers and technical signals shaping the currency pair's immediate future, providing a clear perspective on what to watch.
- AUDUSD is currently trading at $0.70610, approaching significant resistance.
- The RSI(14) at 58.48 on the daily chart indicates a bullish trend but is moving towards overbought territory.
- The DXY is showing a strong downward trend on the daily chart (ADX 28.85), potentially supporting AUDUSD.
- Upcoming CPI data is the key event to watch, with potential for significant volatility.
Navigating the Macroeconomic Crosscurrents
The global economic landscape is a complex tapestry, and its threads are currently pulling AUDUSD in multiple directions. On one hand, the US Dollar Index (DXY) has been experiencing a notable downturn on the daily chart, currently showing an ADX of 28.85, indicative of a strong downward trend. Historically, a weakening dollar often provides a tailwind for risk-sensitive currencies like the Australian Dollar. This dynamic suggests that the downward pressure on the DXY could be a supportive factor for AUDUSD, pushing it towards higher levels. The fact that the DXY is trading at 99.84, with its daily chart showing a bearish trend strength of 89%, reinforces this correlation. A weaker dollar generally means that it takes more dollars to buy the same amount of foreign currency, thus making AUDUSD more attractive.
However, this narrative is not without its counterpoints. The impending release of crucial inflation data, specifically the CPI report, casts a significant shadow over market sentiment. Inflation figures are the lynchpin for central bank policy decisions, particularly for the US Federal Reserve. If inflation proves to be stickier than anticipated, it could reignite expectations of further interest rate hikes or a prolonged period of higher rates. Such a scenario would likely bolster the US Dollar, reversing the current trend and potentially putting significant pressure on AUDUSD. Conversely, softer-than-expected inflation numbers would reinforce the narrative of a Fed on hold, potentially accelerating the dollar's decline and providing a clearer runway for AUDUSD's ascent. The market is currently pricing in a range of possibilities, and this uncertainty is contributing to the cautious trading observed around the $0.70610 mark.
Furthermore, the performance of global equity markets, particularly the S&P 500 and Nasdaq, plays a crucial role in risk appetite. The S&P 500, currently at 6572.87 and showing a strong daily uptrend, suggests a generally positive risk environment. When risk appetite is high, investors tend to favor higher-yielding, albeit riskier, assets and currencies like the AUD. This risk-on sentiment can fuel demand for the Australian Dollar. Conversely, a sudden downturn in these major indices, perhaps triggered by disappointing economic data or geopolitical uncertainty, could lead to a flight to safety, benefiting the US Dollar and pressuring AUDUSD. The current strength in the S&P 500 provides a supportive undertone, but any shift in this sentiment could quickly alter the trading dynamics for AUDUSD.
Technical Picture: A Battle at the Threshold
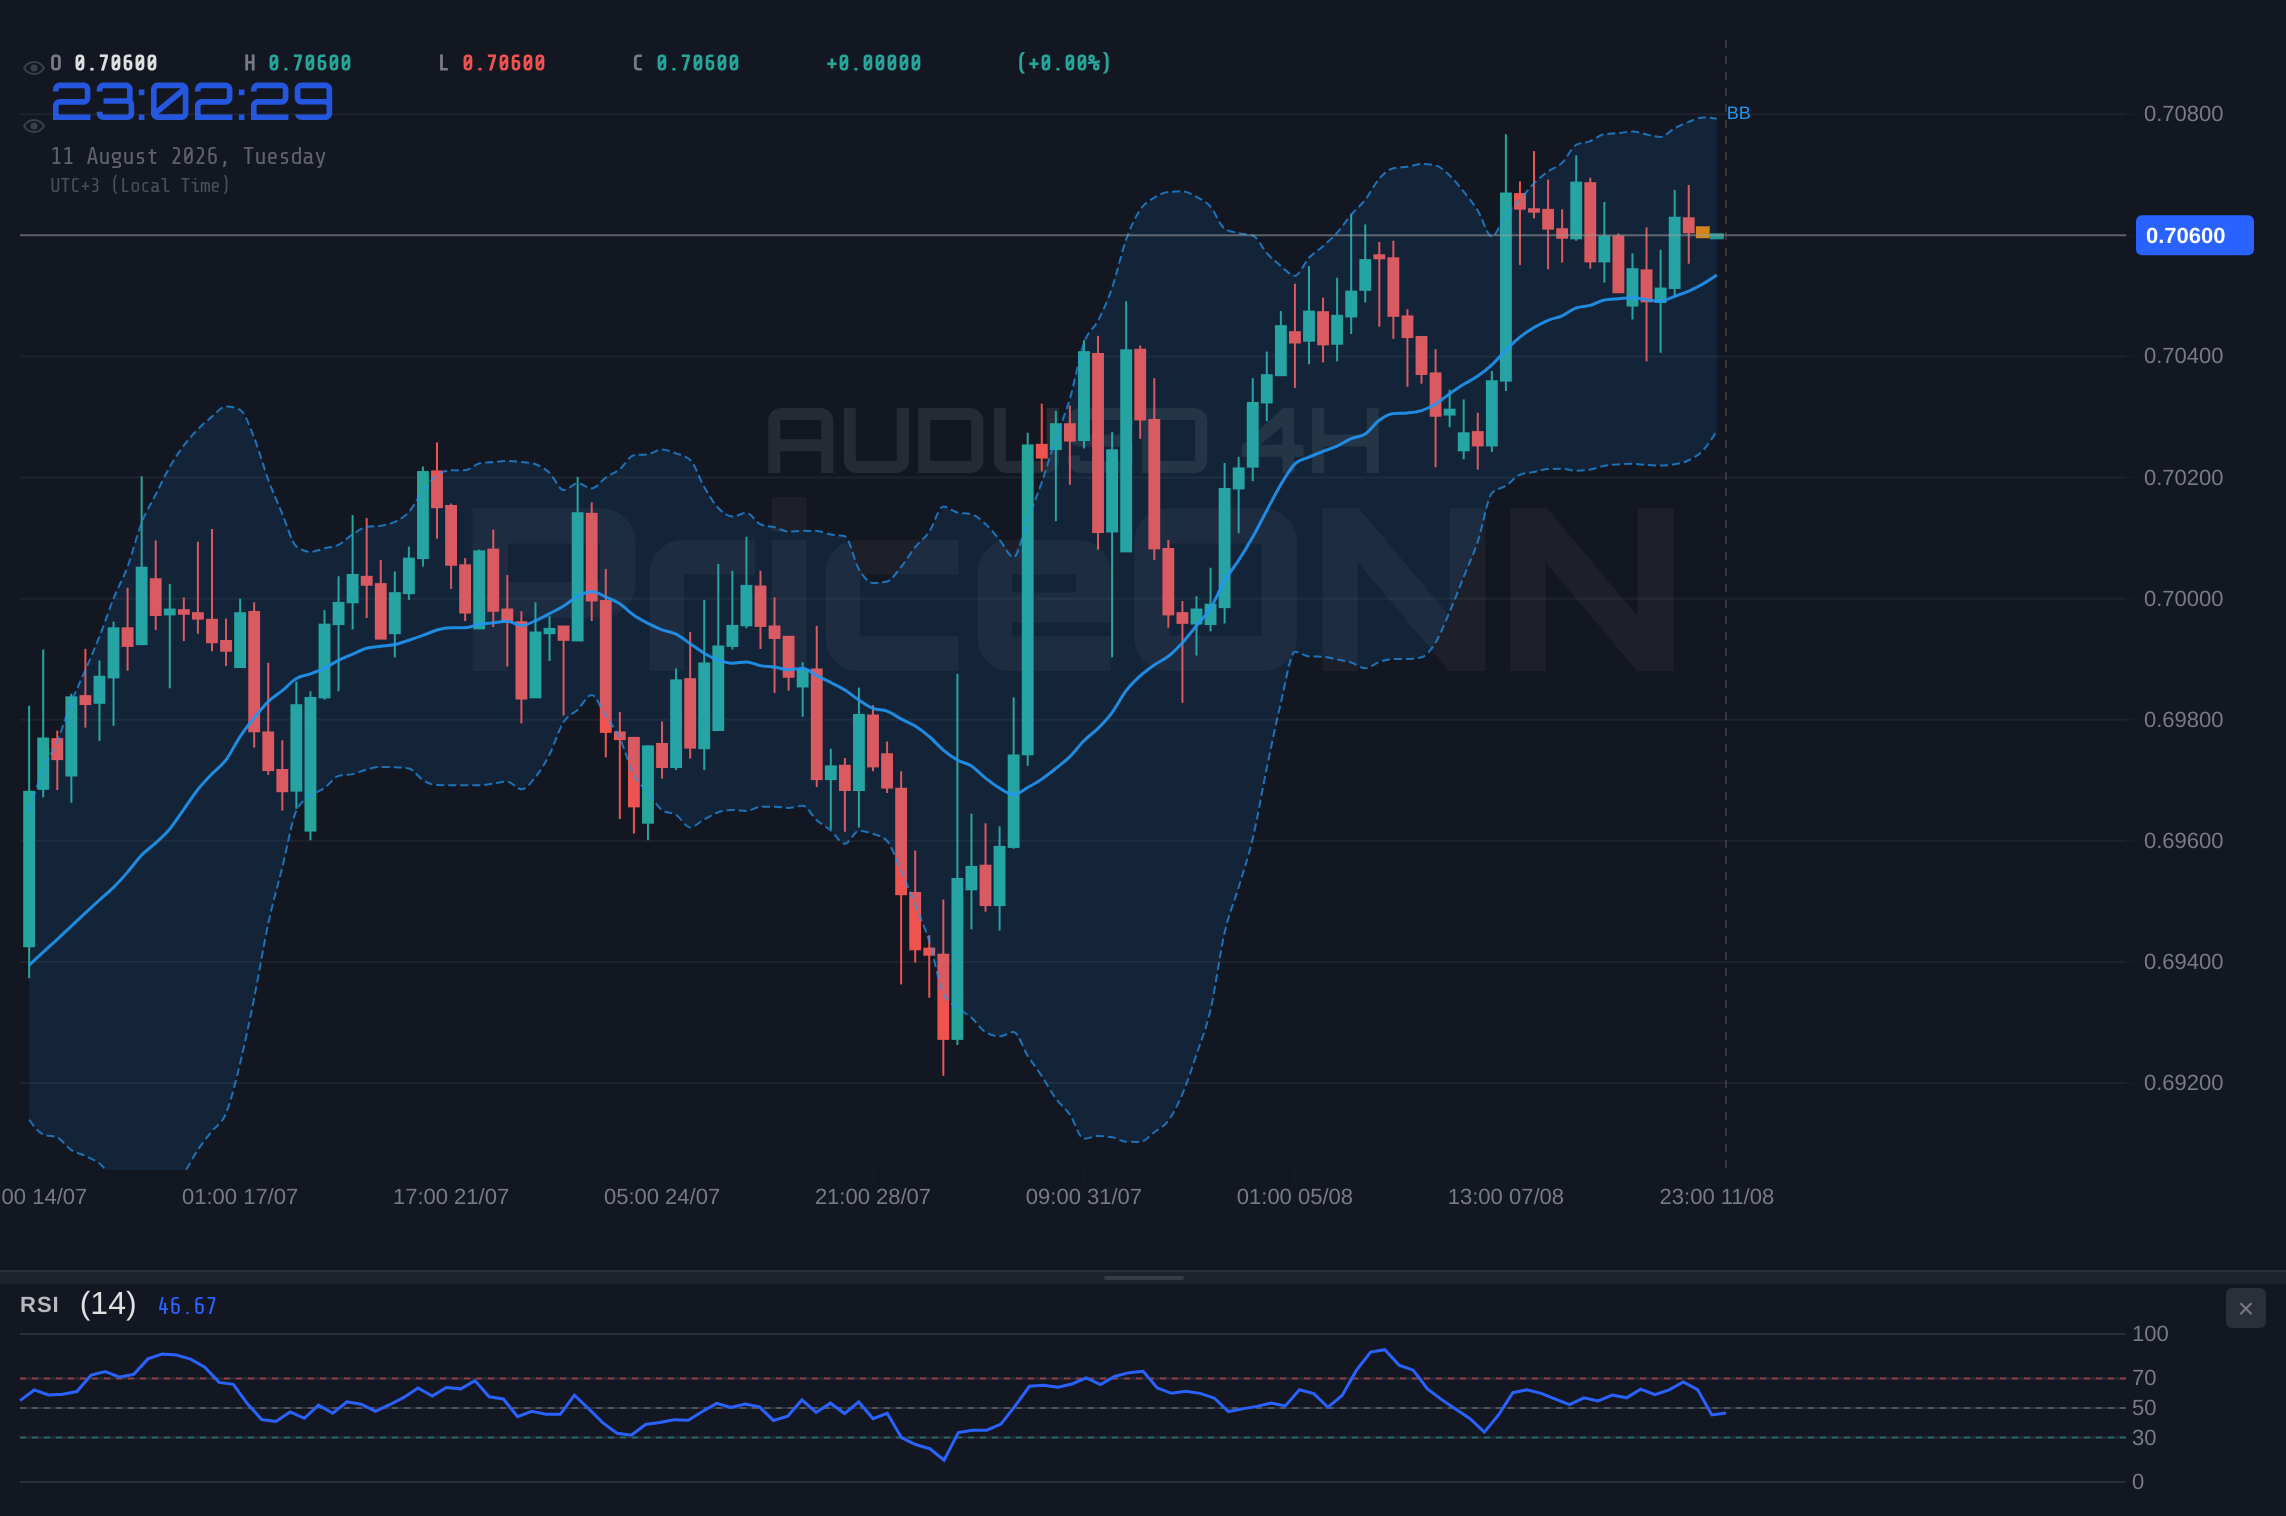
From a technical standpoint, AUDUSD is poised at a significant resistance level around $0.70610. The daily chart paints a picture of a currency pair in a discernible uptrend, with a strong ADX of 11.12 suggesting a generally weak trend, but the RSI(14) at 58.48 indicates a healthy position within the neutral zone, leaning towards bullish territory without being overbought. This suggests that while there's upward momentum, there's still room for further gains before the pair becomes technically overextended. The MACD on the daily chart is also showing positive momentum, with the MACD line above its signal line, reinforcing the bullish undercurrent. Bollinger Bands on the daily chart are above the middle band, further confirming the upward bias. However, the Stochastic Oscillator, with K at 87.43 and D at 86.22, is firmly in overbought territory, flashing a warning signal that a pullback or consolidation could be imminent. This divergence between the MACD's bullish momentum and the Stochastic's overbought condition highlights the tension at the current price level.
Diving deeper into the shorter timeframes, the 4-hour chart presents a slightly more nuanced view. The trend is officially classified as neutral with a strength of 50%, reflecting the indecision around the current price. Support is identified at 0.70526, 0.70422, and 0.70348, while resistance levels loom at 0.70704, 0.70778, and 0.70882. The RSI(14) here is 57.38, still in the neutral zone and suggesting upward potential. However, the MACD is showing negative momentum, with the MACD line below its signal line, and the Stochastic is in a rising phase, with K at 55.88 and D at 44.23, indicating a bullish signal. The ADX at 18.66 points to a weak trend on this timeframe. This mixed picture on the 4-hour chart underscores the immediate struggle for direction, with key levels acting as clear battlegrounds.
The 1-hour chart, often indicative of short-term trading sentiment, shows a trend classified as bearish with a strength of 82%. This is a significant divergence from the daily and 4-hour outlooks. Support is found at 0.70541, 0.70507, and 0.70486, with resistance at 0.70596, 0.70617, and 0.70651. The RSI(14) is hovering around 52.8, suggesting a slight upward lean but not strong conviction. The MACD is currently neutral, indicating a lack of clear momentum. The Stochastic Oscillator, however, shows a bearish signal with K at 40.25 and D at 62.33. The ADX at 14.95 signifies a very weak trend, suggesting that any moves on this timeframe might be more noise than signal, or that a significant breakout is yet to materialize. This short-term bearish inclination, despite the longer-term bullish bias, adds another layer of complexity for traders navigating the $0.70610 price point.
Correlation Analysis: The Dollar's Shadow
The relationship between AUDUSD and the US Dollar Index (DXY) is a cornerstone of forex analysis. As observed on the daily charts, the DXY is exhibiting a strong bearish trend, with an ADX of 28.85 and a trend strength of 89% pointing downwards. This is currently providing a significant tailwind for AUDUSD. When the dollar weakens, as indicated by a falling DXY, assets priced in dollars, like AUDUSD, tend to appreciate. The current DXY price of 99.84 is a key level to watch; a sustained move below this psychological barrier could accelerate the dollar's decline and further support AUDUSD's upward trajectory.
Conversely, if the DXY were to reverse its trend and begin a strong ascent, it would almost certainly apply downward pressure on AUDUSD. This could be triggered by a more hawkish-than-expected stance from the Federal Reserve, perhaps in response to hotter inflation data. The correlation is typically inverse, meaning as DXY goes up, AUDUSD tends to go down, and vice versa. The current setup, with DXY showing clear signs of weakness, makes it a crucial factor to monitor. Any deviation from this trend, such as a bounce from current DXY support levels, would need to be closely analyzed for its potential impact on AUDUSD's immediate price action.
Beyond the dollar's influence, the correlation with broader risk sentiment, as reflected in the S&P 500, is also vital. The S&P 500's current price of 6572.87 and its strong daily uptrend (ADX 47.51 indicating a strong downtrend on the daily chart but strong uptrend on 1H/4H) presents a mixed picture for risk appetite. While the index is showing strength on shorter timeframes, the daily chart suggests caution. A robust risk-on environment typically supports currencies like the AUD, but if risk sentiment deteriorates, we could see a flight to safety, benefiting the USD and hurting AUDUSD. The divergence in ADX strength between the daily and shorter timeframes for S&P 500 mirrors the complexity seen in AUDUSD itself, highlighting a market grappling with conflicting signals.
Economic Calendar Watch: Inflation Data on Deck
The most significant event on the horizon, with the potential to dramatically influence AUDUSD's trajectory, is the upcoming CPI report. While the exact release date isn't specified in the provided data, historical context suggests such releases are critical market movers. If the CPI data comes in hotter than expected, it would likely force a reassessment of the Federal Reserve's monetary policy stance. This could lead to a strengthening of the US Dollar as markets price in a higher probability of continued hawkishness or a slower pace of rate cuts. Such a scenario would put considerable downward pressure on AUDUSD, potentially leading to a sharp reversal from current resistance levels.
Conversely, a cooler-than-expected inflation print would likely be interpreted as a green light for the Fed to maintain its current policy or even consider earlier rate cuts. This would be bullish for risk assets and currencies like AUDUSD, potentially breaking the current resistance at $0.70610 and paving the way for further gains. Traders will be scrutinizing not just the headline inflation numbers but also the core CPI figures, which exclude volatile food and energy prices, as these often provide a clearer picture of underlying inflation trends. The market's reaction will depend heavily on how these numbers align with or deviate from current expectations.
Beyond inflation, other economic releases from both the US and Australia will continue to shape sentiment. Any significant data points related to employment (like Non-Farm Payrolls or Australian employment figures), GDP growth, or manufacturing PMIs could provide additional impetus for directional moves. For instance, a surprisingly strong Australian employment report could bolster the AUD independently of dollar movements, while weak US manufacturing data might reinforce the bearish dollar narrative. Staying attuned to the economic calendar and understanding the potential impact of each release is paramount for navigating the AUDUSD market in the coming days and weeks.
Bullish Scenario: Breaking the Ceiling
25% ProbabilityConsolidation Scenario: Range-Bound Battle
55% ProbabilityBearish Scenario: Resistance Holds Firm
20% ProbabilityFrequently Asked Questions: AUDUSD Analysis
What happens if AUDUSD breaks above the $0.70651 resistance level?
A sustained break above $0.70651, especially on strong volume, would invalidate the immediate bearish outlook and could trigger a move towards the next resistance at $0.70778. This would likely be fueled by positive inflation data or a continued weakening of the US Dollar Index (DXY).
Should I consider buying AUDUSD at current levels of $0.70610 given the RSI at 58.48?
Buying at current levels carries risk as $0.70610 represents significant resistance. While the daily RSI at 58.48 is bullish, the daily Stochastic at 87.43 is overbought, suggesting caution. A more prudent approach might be to wait for a confirmed breakout above resistance or a pullback to a key support level like $0.70422.
Is the RSI at 58.48 a strong buy signal for AUDUSD on the daily chart?
An RSI of 58.48 on the daily chart is considered within the neutral to bullish zone, indicating upward momentum but not yet overbought conditions. It suggests that buyers have some control, but it's not a standalone 'buy' signal. Confirmation from other indicators like MACD and price action breaking key resistance levels would be needed.
How will the upcoming CPI data impact AUDUSD this week?
The CPI data is the most critical upcoming event. Hotter-than-expected inflation could strengthen the USD and push AUDUSD down from its current resistance, while cooler data could accelerate the dollar's decline and support a move higher. The market's reaction will depend entirely on whether the data aligns with or deviates from expectations.
Track markets in real-time
AI-powered analysis, technical indicators and real-time price data.
Join Our Telegram Channel
Breaking market news, AI analysis and trading signals instantly.
Join Channel