

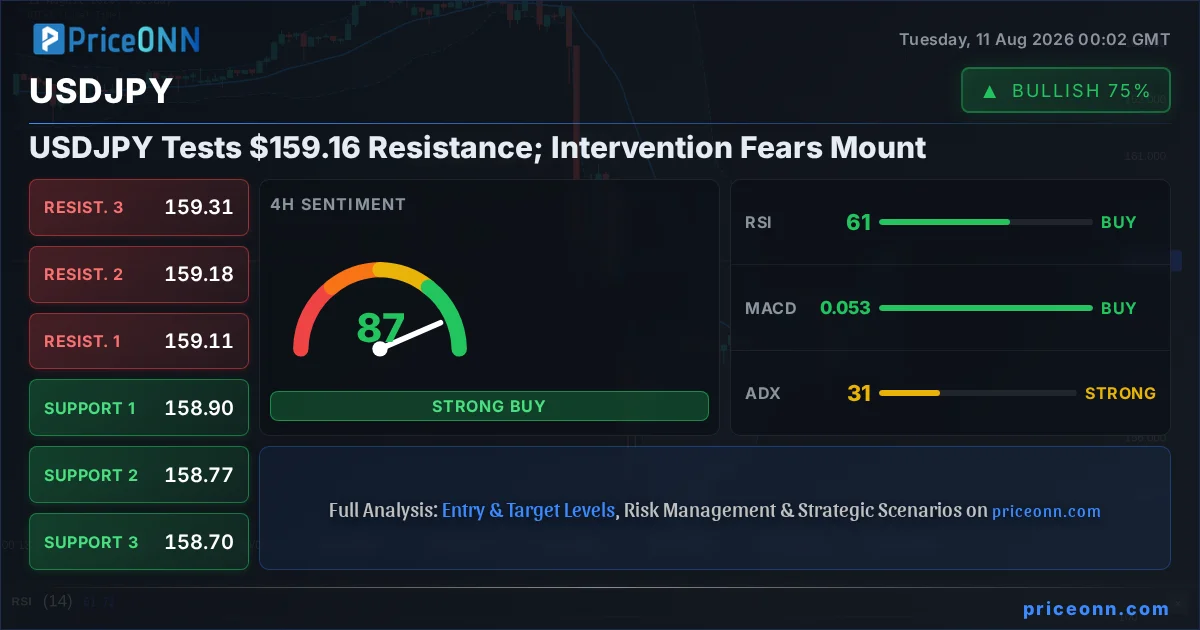
The currency pair USDJPY is currently dancing around the critical $159.16 resistance level, a point of intense focus for traders and policymakers alike. This pivotal price zone has become the battleground where the market's sentiment clashes with the ever-present specter of central bank intervention. With the Dollar Index (DXY) showing signs of strength, currently trading at 99.8, and Japanese authorities frequently signaling their unease about yen weakness, the pressure is mounting. Today's analysis delves into the technical underpinnings and potential scenarios that could unfold as USDJPY confronts this significant resistance.
- USDJPY is testing resistance at $159.16, a level watched closely for potential intervention.
- The ADX at 31.37 indicates a strong trend, while RSI at 65.52 suggests room for further upside but nearing overbought territory.
- Support for USDJPY is identified at $159.15 and $159.10, with resistance looming at $159.20 and $159.30.
- The correlation with a strengthening DXY (at 99.8) adds upward pressure on USDJPY, but intervention risks cap further gains.
This dance around $159.16 is not just another technical tug-of-war; it's a high-stakes game with significant implications for global markets. The Bank of Japan has repeatedly voiced concerns about the rapid depreciation of the yen, suggesting a readiness to step into the foreign exchange market to curb excessive volatility. While no direct intervention has occurred recently, the mere threat can influence market behavior. Traders are constantly weighing the possibility of Japanese authorities stepping in, which could trigger a sharp reversal. This tension is palpable as USDJPY approaches levels previously deemed critical. Our multi-timeframe analysis, examining the 1-hour, 4-hour, and daily charts, reveals a strong upward trend, but also highlights the increasing risk of a pullback or consolidation as resistance is tested.
The recent price action on the 1-hour chart paints a picture of determined bulls pushing the pair higher. The trend strength is at a robust 86%, with the Relative Strength Index (RSI) at 65.52. This suggests there's still some room for upward momentum before hitting overbought conditions, typically considered above 70. However, we're not quite there yet, leaving room for further advances. The Moving Average Convergence Divergence (MACD) histogram is positive, indicating bullish momentum is currently in play. The Bollinger Bands also show the price trading above the middle band, reinforcing the bullish inclination on this shorter timeframe. Stochastic Oscillator readings, with %K at 68.32 and %D at 84.89, show a slight bearish divergence as %K dips below %D, hinting at a potential short-term pause or minor pullback. The Average Directional Index (ADX) at 22.97 confirms a moderately strong uptrend on the 1-hour chart, suggesting that the prevailing direction is indeed upwards, but without the extreme conviction seen in longer timeframes.
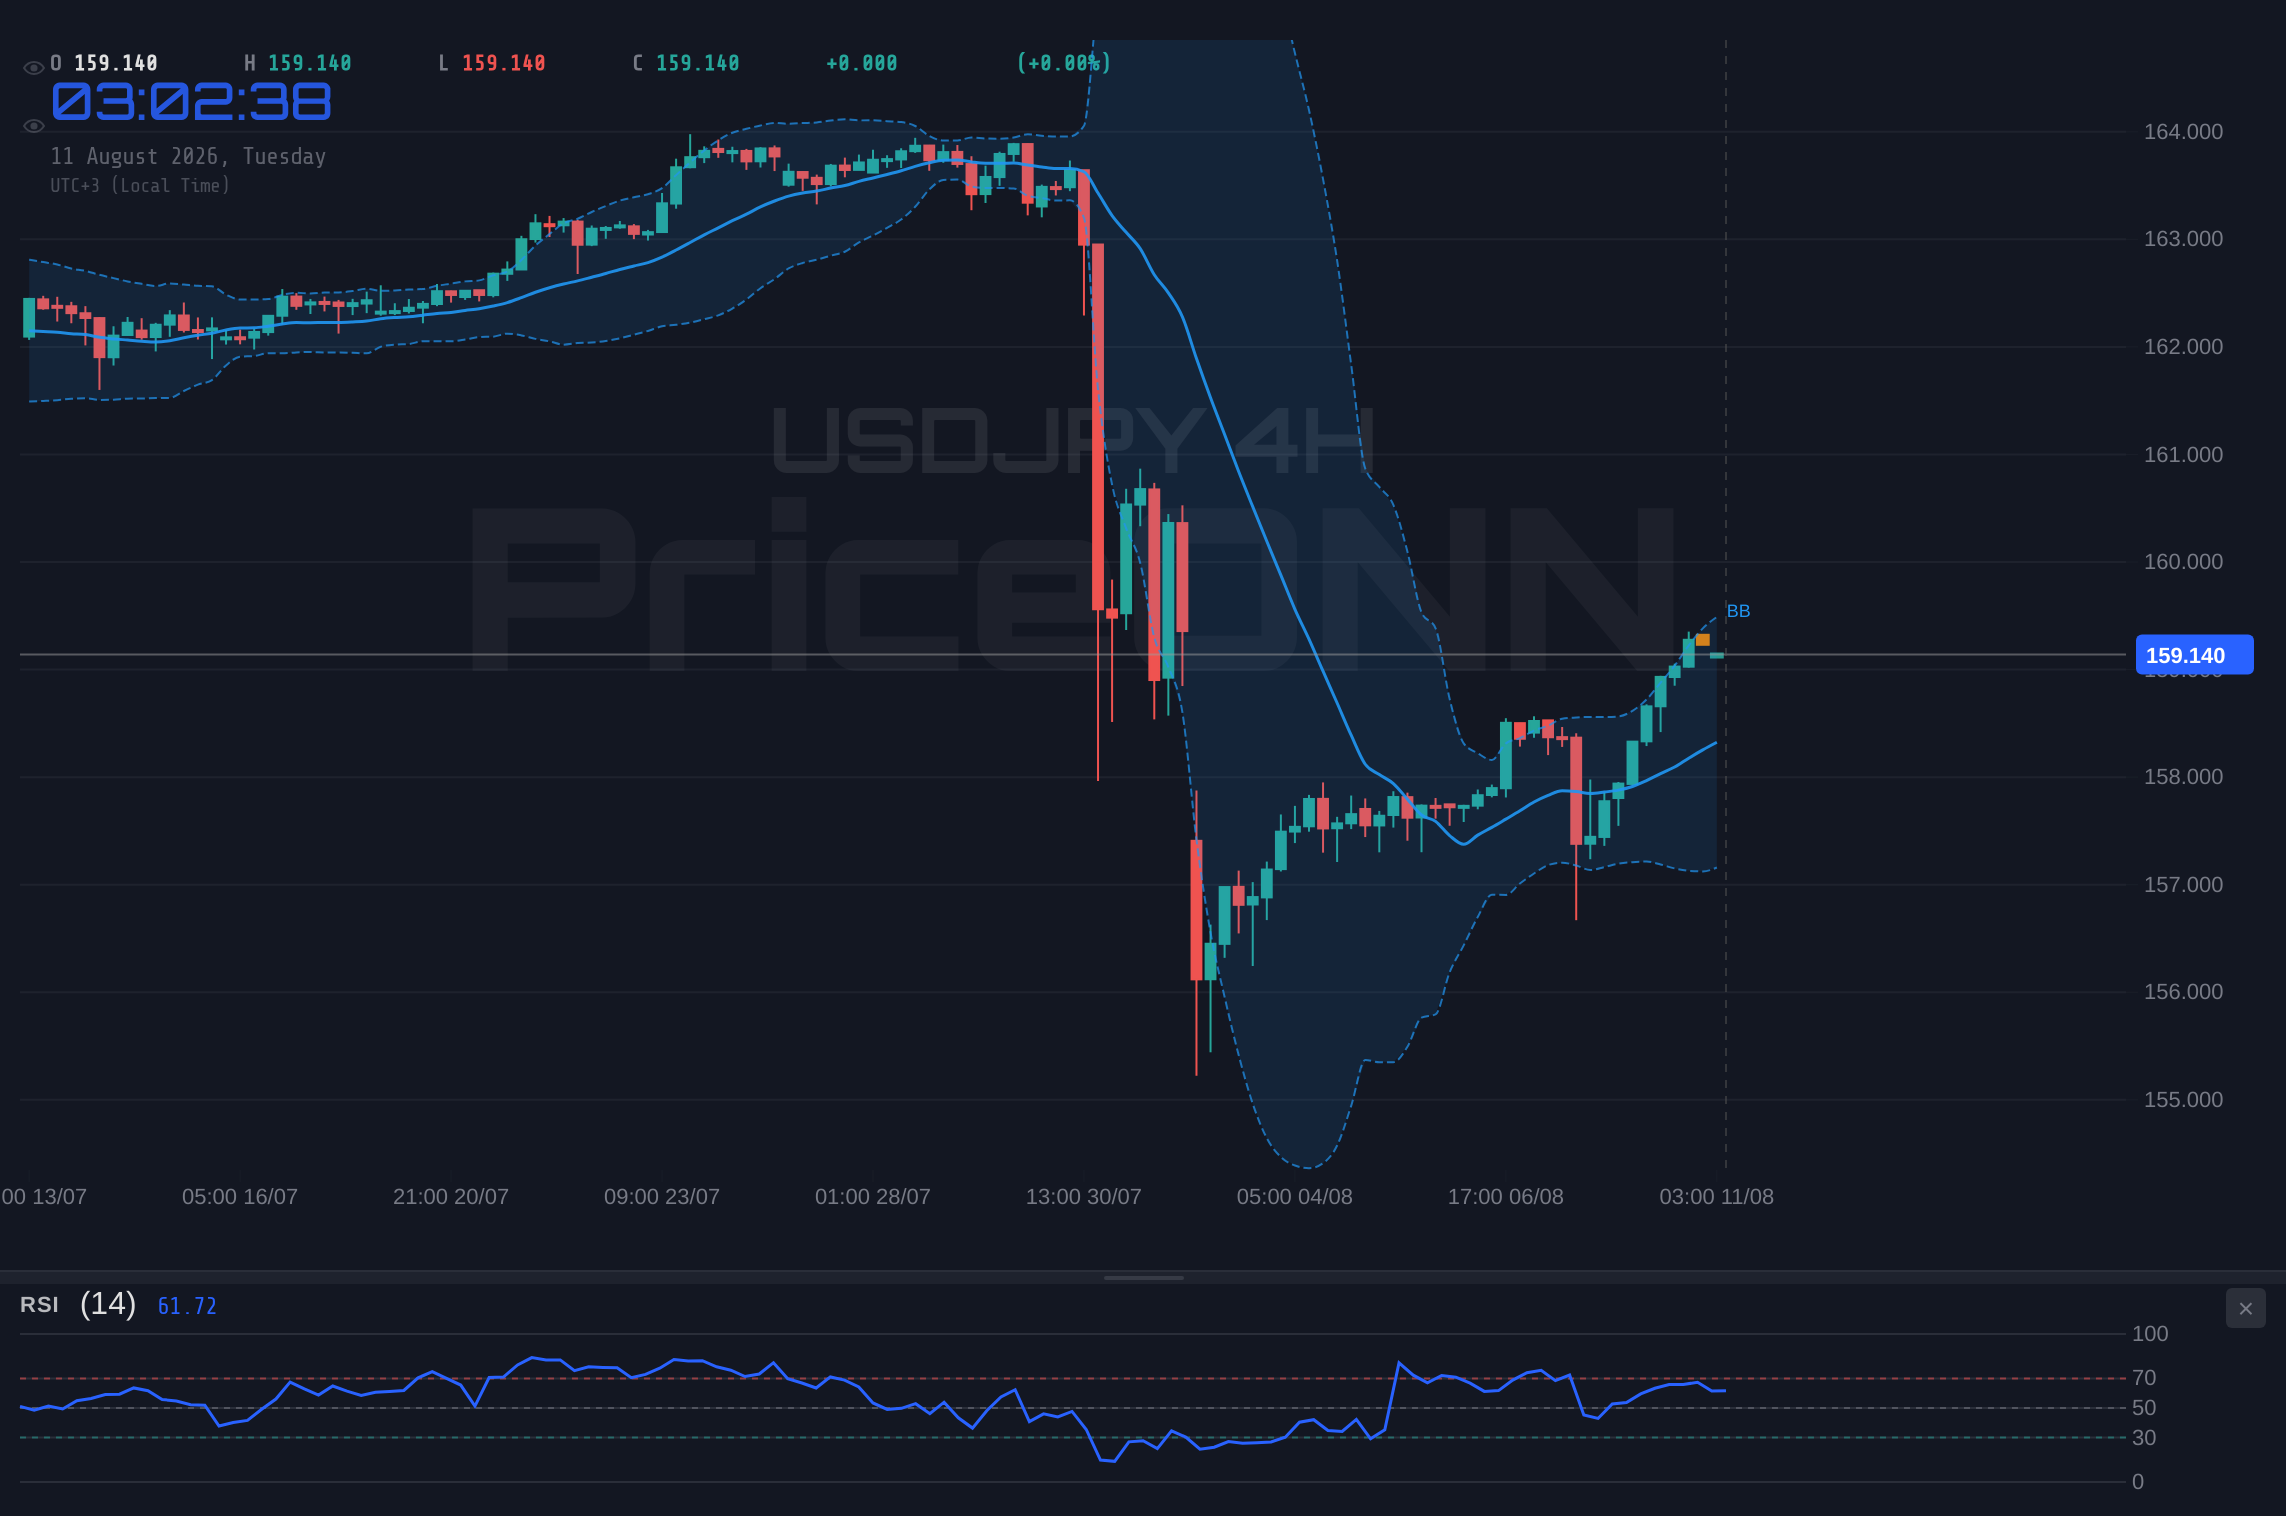
Moving to the 4-hour chart, the picture remains largely constructive, though with a touch more caution. The trend strength here is at 50%, signaling a more neutral stance, which often accompanies periods of consolidation or indecision near key levels. The RSI is at 60.7, still comfortably in neutral territory and showing room for further upside. The MACD continues to display positive momentum, aligning with the bullish sentiment. Bollinger Bands remain above the middle band, indicating an upward bias. However, the Stochastic Oscillator is flashing a more concerning signal here: %K at 97.02 and %D at 83.74 are deeply in overbought territory. This extreme reading suggests that the market is overheated on this timeframe and a significant correction or consolidation phase is increasingly likely. The ADX at 31.37, however, points to a strong upward trend, creating a conflict between the overbought oscillators and the strong trend-following indicator. This divergence warrants close attention as it can precede sharp reversals or periods of sideways chop.
On the daily timeframe, the trend strength drops to 93%, but the overall direction is notably bearish, with an RSI of 41.9. This presents a stark contrast to the shorter timeframes and highlights the potential for a significant shift in sentiment if current resistance holds. The MACD histogram is negative, underscoring bearish momentum on the daily chart. The Bollinger Bands are trading below the middle band, further supporting a bearish outlook. The Stochastic Oscillator, with %K at 36.85 and %D at 26.43, shows a rising %K from oversold levels, which could signal a potential bounce, but it's still too early to confirm a sustained move. The ADX at 36.7 confirms a strong downtrend on the daily chart. This multi-timeframe analysis reveals a significant technical divergence: shorter timeframes show bullish strength and upward momentum, while the daily chart clearly indicates bearish pressure and a strong downtrend. This conflict between timeframes is precisely why traders must be vigilant around key resistance levels like $159.16.
The Dollar's Ascent and Yen's Plight: A Tale of Two Currencies
The current strength in USDJPY is intrinsically linked to the performance of the US Dollar Index (DXY). As the DXY hovers around 99.8, it exerts upward pressure on USDJPY. A stronger dollar generally means that USDJPY will rise, reflecting the relative strength of the US economy and its monetary policy compared to Japan. The market sentiment, as indicated by the SP500 trading at 6572.87 and Nasdaq at 29590.37, shows a generally positive risk appetite, which typically supports carry trades like USDJPY where investors borrow in a low-interest-rate currency (JPY) to invest in higher-yielding assets or currencies (USD). However, this correlation is not always straightforward. The Japanese authorities' consistent verbal intervention, warning against excessive yen weakness, introduces a significant 'risk-off' element specifically for this pair. Any hint of direct intervention can swiftly unravel the bullish momentum, regardless of broader market trends.
The economic backdrop plays a crucial role here. While US interest rates remain higher than in Japan, creating a yield differential that favors the dollar, the market is constantly pricing in future monetary policy expectations. Any signals from the Federal Reserve regarding future rate hikes or holds can dramatically influence the DXY and, consequently, USDJPY. Conversely, any indication that the Bank of Japan might shift its ultra-loose monetary policy, even subtly, could lead to a sharp appreciation of the yen. Currently, the market consensus seems to favor continued dollar strength against the yen, driven by yield differentials and a generally positive risk sentiment. However, the proximity to intervention levels means that any macroeconomic data release, especially from the US, will be scrutinized not just for its direct impact on the dollar but also for its potential to trigger Japanese authorities into action.
The historical context of USDJPY's movements around such resistance levels is also telling. We've seen periods where the yen's weakness was allowed to persist for extended durations, followed by sharp, rapid reversals. These interventions, when they occur, are often swift and decisive, aiming to shock the market back into a more orderly trading range. Therefore, traders must remain acutely aware of the potential for sudden, sharp moves. The current upward trend, while strong on shorter timeframes, is approaching a psychological and technical barrier where the risk of such intervention increases exponentially. The ADX of 31.37 on the 4-hour chart suggests a strong trend, but this strength can quickly dissipate if intervention occurs. It's this delicate balance between trend momentum and intervention risk that defines the current trading landscape for USDJPY.
The Bull's Roadmap: Navigating Towards Higher Ground
For the bulls to maintain control and push USDJPY higher, several conditions must be met. The immediate hurdle is the resistance at $159.16. A decisive break and, more importantly, a sustained hold above this level are paramount. If USDJPY can convincingly clear $159.16, the next immediate target would be the 4-hour resistance level of $159.30. Further upside could then target the daily resistance at $159.57. The path to these higher levels would likely involve continued positive momentum, possibly fueled by strong US economic data or dovish signals from the Bank of Japan, which would be highly unlikely at this stage. The RSI would need to remain below the 70 overbought threshold on the 4-hour chart, and the daily chart would need to show a significant shift in trend, moving away from the current bearish momentum indicated by the MACD and ADX. The Stochastic Oscillator on the 4-hour chart, currently showing extreme overbought conditions, would need to cool off, perhaps through a period of consolidation rather than a sharp decline, to allow for further upside potential without immediate reversal.
The trigger for this bullish scenario would be a clear, high-volume break above $159.16, followed by a successful retest of this level as support. This would signal that the market has absorbed the selling pressure at resistance and is ready to advance. The invalidation of this bullish thesis would occur if the price fails to break $159.16 and instead falls back below the 1-hour support level of $159.11. A close below $159.10 on the 1-hour chart would further strengthen the bearish case and suggest that the upside attempt has failed. The probability of this scenario playing out in the short-term (next 24-48 hours) is moderate, given the strong daily bearish trend and the looming intervention risk. However, if US yields continue to climb or risk sentiment remains exceptionally strong, this bullish outlook could gain traction over the coming week.
Where Bears Take Control: The Intervention Threat Looms
On the bearish side, the scenario is perhaps more immediate given the technical readings on the daily chart and the ever-present threat of intervention. If USDJPY fails to break decisively above $159.16, the bears are poised to take control. The first line of defense for the bulls, and the initial target for the bears, is the 1-hour support at $159.11. A break below this level, especially on increasing volume, would signal a failure of the current upward push and could lead to a rapid decline. The next key support level to watch would be $159.00, followed by the 4-hour support at $158.90. Should these levels break, the path opens up towards the daily support levels, starting with $158.67. The daily chart's bearish MACD and ADX at 36.7 strongly support this downside scenario.
The primary trigger for this bearish scenario would be a rejection from the $159.16 to $159.30 resistance zone, coupled with a subsequent break below the $159.11 support. This would indicate that sellers are overwhelming buyers at these key levels. The invalidation of this bearish thesis would occur if USDJPY manages to break and hold above the $159.30 resistance, suggesting that the earlier bearish signals were false and a new bullish leg is commencing. Given the confluence of daily bearish technicals and the significant intervention risk associated with levels above $159.16, the probability of a bearish move or at least a significant pullback from current levels is considerable in the short to medium term. The market is acutely aware that pushing much higher could invite a response from Japanese authorities.
The Waiting Game: Consolidation and Divergence
In a neutral scenario, USDJPY might enter a period of consolidation, trapped between the strong bullish momentum on shorter timeframes and the bearish undertones of the daily chart, all while awaiting clearer directional cues or intervention. In this scenario, the pair could trade sideways, potentially oscillating between the $159.16 resistance and a support level around $159.00. This range-bound trading would likely be characterized by lower volatility and indecisive price action. The ADX on the 4-hour chart might begin to decline from its current 31.37, indicating a weakening trend as the market struggles to find direction. RSI readings could fluctuate around the 50-60 level, reflecting this indecision.
The trigger for this neutral scenario would be the failure of both the bulls and bears to establish firm control. Price action would become choppy, with failed breakouts above resistance and failed breakdowns below support. The invalidation of this scenario would occur if either the bullish or bearish scenario gains traction, leading to a decisive move beyond the established range. This neutral phase could persist until a significant economic event, a shift in central bank policy expectations, or clear signs of intervention from Japanese authorities. The probability of this scenario is significant, especially in the immediate intraday period, as the market digests the current technical picture and awaits further catalysts.
The Verdict: A Bearish Bias with Intervention Risk
Considering the technical divergence across timeframes and the significant geopolitical and central bank-related risks, the most probable scenario in the short to medium term (next 1-2 weeks) leans towards a bearish outcome or at least a significant pullback from current resistance. The daily chart's bearish signals, combined with the extreme overbought conditions on the 4-hour Stochastic Oscillator and the looming threat of intervention above $159.16, suggest that the upside potential is limited and carries substantial risk. Therefore, I assign a higher probability to the bearish scenario.
Bears' Advantage: Intervention Looms
60% ProbabilityThe Waiting Game: Consolidation Ahead
30% ProbabilityBullish Momentum: A Difficult Climb
10% ProbabilityThe key to navigating this complex situation lies in risk management and patience. The market is at a critical juncture, and volatility could increase rapidly. Always manage your risk, use stop-losses, and wait for clear setups. The market will present opportunities, but it's crucial to enter when the odds are in your favor.
Frequently Asked Questions: USDJPY Analysis
What happens if USDJPY breaks decisively above $159.16 resistance?
A sustained break above $159.16, confirmed by strong volume and a retest of this level as support, would invalidate the immediate bearish outlook. The next targets would be $159.30 and potentially $159.57, though this scenario carries a lower probability due to intervention risks and daily chart bearish signals.
Is RSI at 65.52 a sell signal for USDJPY right now?
An RSI of 65.52 on the 1-hour chart is approaching overbought territory but is not yet a definitive sell signal. It suggests upward momentum is strong but could be nearing exhaustion. A confirmed sell signal would require bearish divergence or a move below the 50 level, especially if coupled with bearish MACD or price action below key support.
How will the potential for Japanese intervention affect USDJPY this week?
The threat of intervention significantly caps upside potential above $159.16. Any strong verbal cues or actual market action from Japanese authorities could trigger a sharp and rapid depreciation of the dollar against the yen. This risk increases as USDJPY approaches higher resistance levels, making it a key factor to monitor.
Should I consider buying USDJPY at current levels of $159.16 given the strong trend?
Buying at $159.16 is risky given it's a resistance level and carries intervention risk. While shorter timeframes show strength, the daily chart is bearish. A more prudent approach would be to wait for a confirmed break above $159.16 with clear invalidation below $159.11, or to look for opportunities on a significant pullback towards support levels like $159.00 or $158.90 if the bearish scenario plays out.
Track markets in real-time
AI-powered analysis, technical indicators and real-time price data.
Join Our Telegram Channel
Breaking market news, AI analysis and trading signals instantly.
Join Channel