

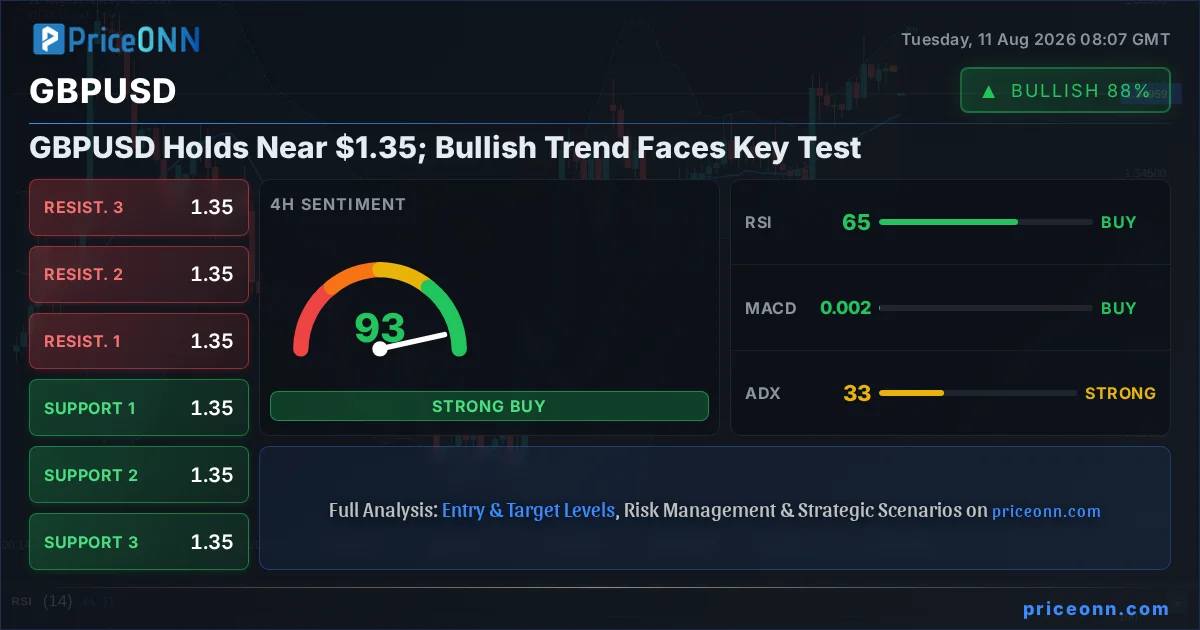
The currency pair GBPUSD is currently locked in a tight battleground, hovering precariously near the critical $1.35 psychological level. This pivotal price point is more than just a number; it represents a crucial juncture where the prevailing bullish sentiment faces its sternest test. As traders and analysts dissect the latest economic data and technical indicators, a clear divergence in outlooks is emerging, painting a complex picture of the pound's immediate future against the dollar. Understanding the forces at play – from central bank policy shifts to macroeconomic correlations – is paramount for navigating this uncertain terrain. This analysis dives deep into the conflicting signals, exploring the arguments for both the bulls and the bears, and what it means for traders watching GBPUSD today.
- GBPUSD is currently trading at $1.34974, consolidating around the $1.35 mark.
- Critical support sits at $1.34839, tested multiple times this week.
- Resistance is observed near $1.35331, a level that needs to break for further upside.
- The DXY index strength at 99.92 is a key factor influencing GBPUSD's correlation.
The Tug-of-War at $1.35: Bulls vs. Bears
The currency pair GBPUSD is currently locked in a tight battleground, hovering precariously near the critical $1.35 psychological level. This pivotal price point is more than just a number; it represents a crucial juncture where the prevailing bullish sentiment faces its sternest test. As traders and analysts dissect the latest economic data and technical indicators, a clear divergence in outlooks is emerging, painting a complex picture of the pound's immediate future against the dollar. Understanding the forces at play – from central bank policy shifts to macroeconomic correlations – is paramount for navigating this uncertain terrain. This analysis dives deep into the conflicting signals, exploring the arguments for both the bulls and the bears, and what it means for traders watching GBPUSD today. The market is clearly divided, with technical indicators flashing mixed signals across different timeframes, creating a scenario ripe for volatility. The 1-hour chart suggests bearish momentum, while the daily chart leans bullish, leaving the 4-hour chart in a neutral zone. This divergence is not just an academic point; it translates directly into trading decisions and risk management strategies.
The current price of $1.34974, a slight dip from its recent highs, underscores the indecision. Support levels at $1.34905 and $1.34836 are being closely watched on the downside, while the resistance zone around $1.35166 and $1.35331 looms overhead. The DXY, or Dollar Index, currently trading at 99.92, adds another layer of complexity. A strengthening dollar, as indicated by the DXY's upward trajectory, typically exerts downward pressure on pairs like GBPUSD. However, the relationship is not always linear, and other fundamental factors can override this correlation. Market sentiment, driven by economic data releases and central bank rhetoric, plays a crucial role in determining the pair's direction.
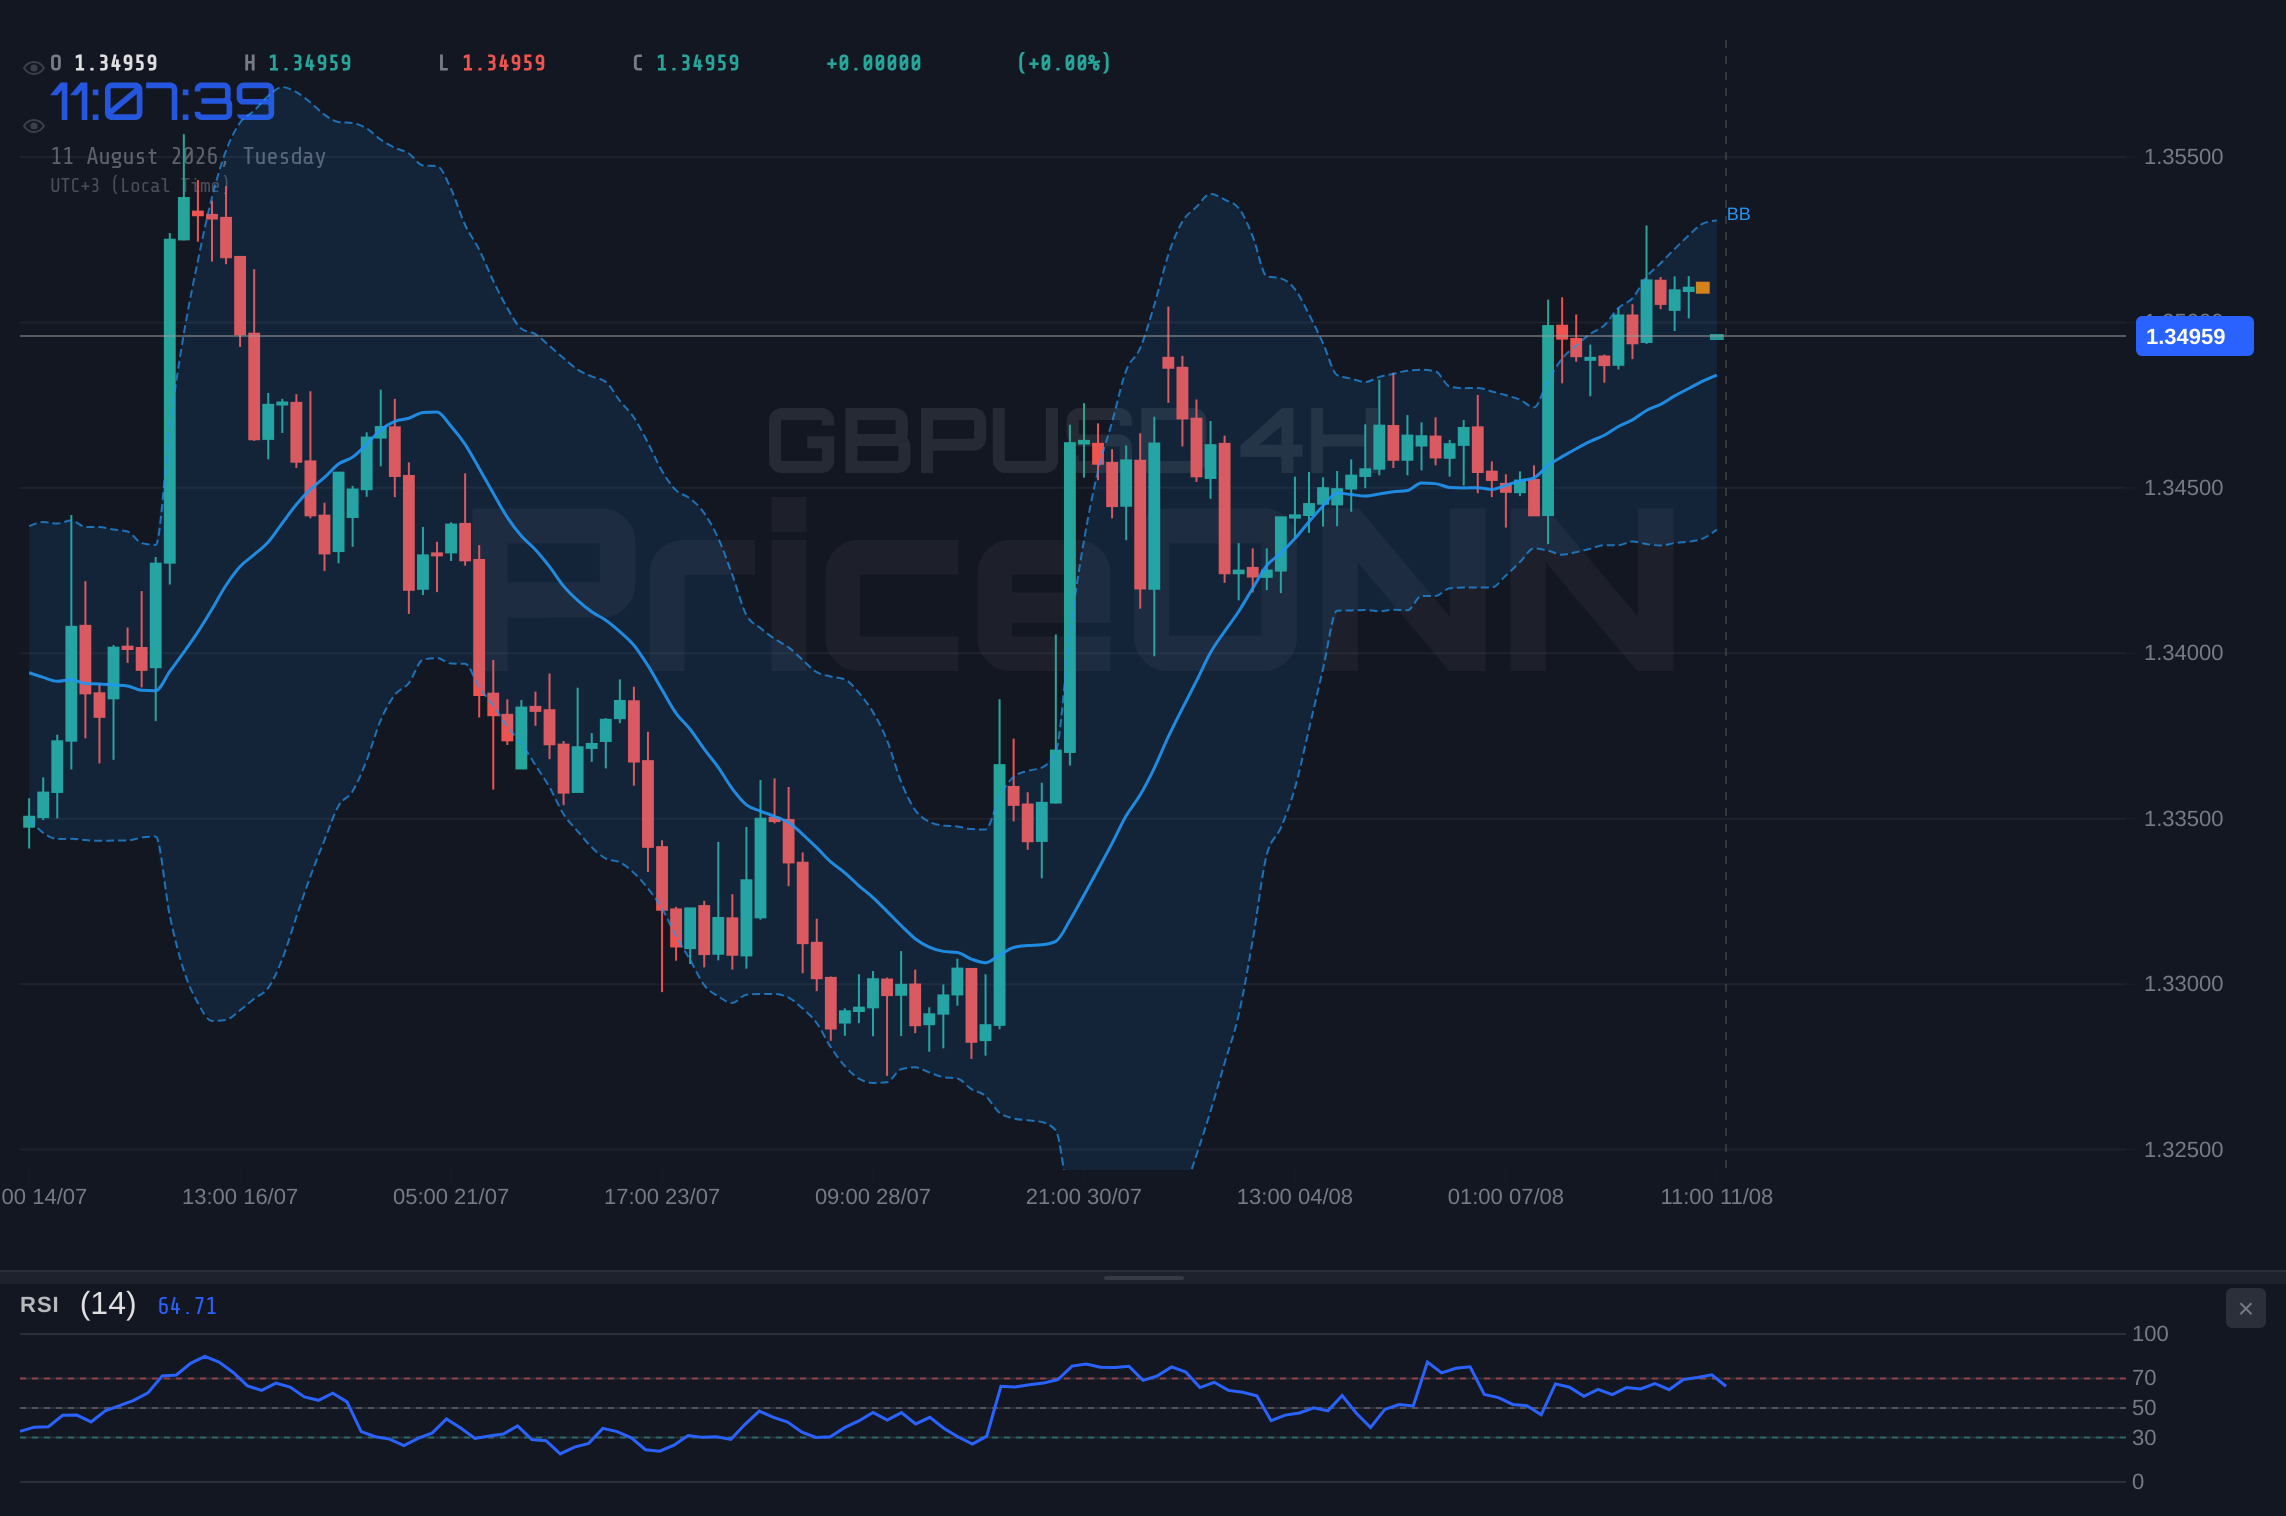
The 1-hour technical indicators present a predominantly bearish outlook. With the RSI at 43.8, it suggests that selling pressure is building, although it's not yet in oversold territory. The MACD is showing negative momentum, with the MACD line below the signal line, reinforcing the bearish sentiment on this short-term timeframe. Stochastic oscillators also lean towards a sell signal, with the %K line below the %D line at 40.42 and 59.34 respectively. The ADX at 17.45 indicates a weak trend, suggesting that any downward move might lack strong conviction but could still lead to a test of lower support levels. This short-term bearishness contrasts sharply with the signals from longer timeframes, creating a significant divergence that demands careful attention.
The Bull Case: Sterling's Resilience Amidst Dollar Strength
Despite the short-term technical headwinds, a compelling case can be made for the continuation of GBPUSD's bullish trend. The fundamental backdrop, while complex, offers several reasons for optimism. The UK economy, though facing challenges, has shown pockets of resilience. Recent PMI data, for instance, has often surprised to the upside, indicating robust activity in key sectors. While inflation remains a concern, the Bank of England (BoE) is in a delicate balancing act, aiming to curb price pressures without stifling economic growth. The market is closely monitoring the BoE's forward guidance, with any hints of a less hawkish stance potentially providing support for the pound. The current price action on the 4-hour and daily charts, which generally lean bullish, supports this narrative.
On the 4-hour timeframe, the RSI at 64.53 hovers in neutral territory but shows an upward eğilim, suggesting that buyers are still active and could push prices higher. The MACD on this timeframe is positive, with the MACD line above the signal line, indicating bullish momentum. Stochastic oscillators, while showing a sell signal (%K
The daily chart further bolsters the bull case. The RSI at 59.28 is comfortably in the neutral zone, trending upwards, indicating room for further appreciation. The MACD is positive and above its signal line, confirming bullish momentum on the larger timeframe. Stochastic oscillators are in overbought territory (88.85, 82.39), which typically signals a potential pullback, but historically, strong uptrends can persist even in overbought conditions. The ADX at 22.3 indicates a moderately strong upward trend, suggesting that the foundational support for a higher GBPUSD remains intact. This longer-term perspective suggests that the current price action near $1.35 is merely a pause before the next leg higher.
Furthermore, the correlation with the Dollar Index (DXY) needs careful consideration. While DXY is currently at 99.92 and showing strength on the 1-hour chart, its longer-term trend on the daily chart is down, indicating potential weakness ahead. If the DXY begins to falter, especially with upcoming US economic data releases that could influence Federal Reserve policy expectations, GBPUSD could see a significant tailwind. The market is already pricing in certain Fed actions, and any deviation from these expectations could trigger a substantial move in currency markets. Recent news about the US labor market, with a decline in employment data impacting the USD index, supports the idea that the dollar's strength might be waning, which would be a significant tailwind for GBPUSD.
The Bear Case: Sterling Under Pressure from Multiple Fronts
Conversely, the bears have a strong argument rooted in both technicals and fundamental concerns surrounding the UK economy and the relative strength of the US dollar. The immediate bearish signals on the 1-hour chart cannot be ignored. A break below the support at $1.34839 could trigger a cascade of selling, pushing the pair towards the next significant support level at $1.34275. The RSI at 43.8 and the MACD's negative momentum on this timeframe are clear warnings that short-term sentiment is turning sour. This could be the precursor to a deeper correction, especially if upcoming UK economic data disappoints or if geopolitical tensions escalate, leading to a flight to safety towards the US dollar.
The economic outlook for the UK presents several challenges. While recent PMI data has shown some resilience, underlying issues such as persistent inflation, the cost of living crisis, and ongoing Brexit-related adjustments continue to weigh on the pound. The Bank of England faces a difficult path, and any misstep in its monetary policy decisions could spook investors. If inflation proves stickier than expected, forcing the BoE into more aggressive tightening, it could potentially stifle growth and negatively impact Sterling. Conversely, if the BoE signals a pause or pivot too early, the yield differential with the US could widen, favoring the dollar.
The strength of the US dollar, particularly its upward trend on the 1-hour and 4-hour charts, remains a significant headwind for GBPUSD. The Federal Reserve's stance on interest rates, even if nearing a peak, continues to provide a supportive environment for the dollar. Upcoming US economic data, such as inflation figures and employment reports, will be crucial in shaping these expectations. Any data that suggests a stronger-than-expected US economy or a more hawkish Fed could further boost the dollar and push GBPUSD lower. The recent news highlighting the dollar letting the labor market down might be a temporary reprieve, but the underlying strength of the US economy and its monetary policy outlook cannot be entirely dismissed.
From a technical standpoint, the resistance levels at $1.35166 and $1.35331 are formidable barriers. A failure to decisively break and hold above these levels could lead to a sharp reversal. The Stochastic oscillators on the 4-hour chart are showing a dip signal from overbought conditions, and the daily chart's Stochastic is also signaling a potential downturn from extreme levels. While the daily ADX suggests a bullish trend, its value of 22.3 is not as strong as the shorter-term ADX readings, implying that the trend's conviction might be weakening. This confluence of technical warnings, coupled with fundamental uncertainties, provides a solid foundation for the bearish argument.
Weighing the Evidence: Technicals and Fundamentals Converge
The current market environment for GBPUSD is characterized by a clear conflict between short-term technical signals and longer-term fundamental drivers. The 1-hour chart screams caution, with bearish indicators suggesting an imminent pullback. However, the daily and 4-hour charts paint a more optimistic picture, hinting at underlying strength and potential for further upside. This divergence is where skilled traders find opportunities, but it also demands a robust risk management strategy. The key lies in identifying which timeframe's signals are likely to dominate and what catalysts could trigger a decisive move.
The interplay between GBPUSD and the DXY is crucial. Currently, DXY shows strength on shorter timeframes but a weaker trend on the daily. If the dollar begins to weaken significantly, particularly due to shifts in Fed policy expectations, it could provide the necessary impetus for GBPUSD to break through its resistance levels. Conversely, any unexpected strength in the US economy or a more hawkish tone from the Fed could solidify dollar strength and send GBPUSD lower, even if the UK economy shows signs of stability. The recent volatility in USD/JPY, influenced by intervention fears, highlights how currency markets are sensitive to central bank actions and can lead to cascading effects across other pairs.
The upcoming economic calendar will be critical in resolving this ambiguity. Key UK inflation data, along with US employment figures and central bank speeches, will provide the necessary guidance. For GBPUSD bulls, a break above $1.35331 is essential, confirming that the pair can overcome dollar strength and upward resistance. This would likely require supportive UK economic data or a dovish signal from the Fed. For bears, a decisive break below $1.34839, potentially triggered by weak UK data or hawkish Fed rhetoric, would open the door for a move towards $1.34275.
The ADX indicator provides a fascinating insight across timeframes. While the 1-hour ADX at 17.45 suggests a weak trend, the 4-hour ADX at 33.44 and the daily ADX at 22.3 point towards stronger underlying trends, albeit with varying degrees of conviction. This suggests that the market is in a state of flux, with short-term noise potentially masking a more established longer-term direction. The Stochastic oscillators also present conflicting signals, with daily charts nearing overbought or showing a downturn, while shorter timeframes suggest further downside. This lack of clear consensus across all indicators and timeframes means that traders should exercise caution and wait for confirmation before committing to a significant position.
Bearish Scenario: Testing the Lower Bounds
50% ProbabilityBullish Scenario: Breaking the Ceiling
40% ProbabilityConsolidation Scenario: Range-Bound Play
10% ProbabilityFrequently Asked Questions: GBPUSD Analysis
What happens if GBPUSD breaks below the $1.34839 support level?
A break below $1.34839, especially on increased volume, could signal a bearish continuation. This would likely invalidate the short-term bullish setup and could lead to a test of the $1.34275 support level, as indicated by the bearish scenario. Such a move would be further confirmed if DXY strengthens significantly.
Should I consider buying GBPUSD at current levels of $1.34974 given the mixed signals?
Buying at current levels carries significant risk due to the conflicting signals across timeframes. The 1-hour chart suggests bearish momentum, while the daily chart shows bullish potential. A more prudent approach might be to wait for confirmation: either a decisive break above $1.35331 resistance or a clear rejection from $1.34839 support before committing.
Is the RSI at 43.8 on the 1-hour chart a sell signal for GBPUSD?
An RSI of 43.8 on the 1-hour chart indicates bearish momentum but is not yet in oversold territory. While it leans towards a sell signal in the short term, it needs to be considered alongside other indicators and the broader trend. A sustained move below this level, coupled with MACD negative momentum, would strengthen the bearish case.
How might upcoming US employment data affect GBPUSD this week?
Stronger-than-expected US employment data could boost the DXY and put downward pressure on GBPUSD, potentially triggering the bearish scenario. Conversely, weaker data might lead to a Fed pivot expectation, weakening the dollar and supporting a GBPUSD rally towards resistance levels like $1.35331.
The market is at a crossroads, and the $1.35 level for GBPUSD is more than just a price point; it's a battleground where fundamental narratives and technical signals clash. While the longer-term charts offer a glimmer of hope for the bulls, the immediate bearish signals and the persistent strength of the US dollar cannot be dismissed. Traders must remain vigilant, employing strict risk management and waiting for clear confirmation before entering positions. The upcoming economic data releases from both the UK and the US will be the key determinants in whether GBPUSD breaks out of its current stalemate or continues its choppy dance around this crucial psychological level.
Technical Outlook Summary
| Indicator | Value | Signal | Interpretation |
|---|---|---|---|
| RSI (14) | 43.8 | Bearish | Suggests selling pressure building on 1H. |
| MACD Histogram | -0.00083 | Bearish | Negative momentum on 1H, below signal line. |
| Stochastic | K:40.42, D:59.34 | Bearish | %K below %D on 1H, leaning lower. |
| ADX | 17.45 | Neutral | Weak trend on 1H, lacks strong conviction. |
| Bollinger | Mid Band | Bearish | Below mid-band on 1H, indicating downward pressure. |
Key Levels
Track markets in real-time
AI-powered analysis, technical indicators and real-time price data.
Join Our Telegram Channel
Breaking market news, AI analysis and trading signals instantly.
Join Channel