
Brent Crude Holds Near $87.10; Bulls Eye $88.76 Resistance
Brent crude trades around $87.10. Technical indicators suggest a strong bullish trend, with eyes on the $88.76 resistance level. Analysis covers indicators, key levels, and market sentiment.
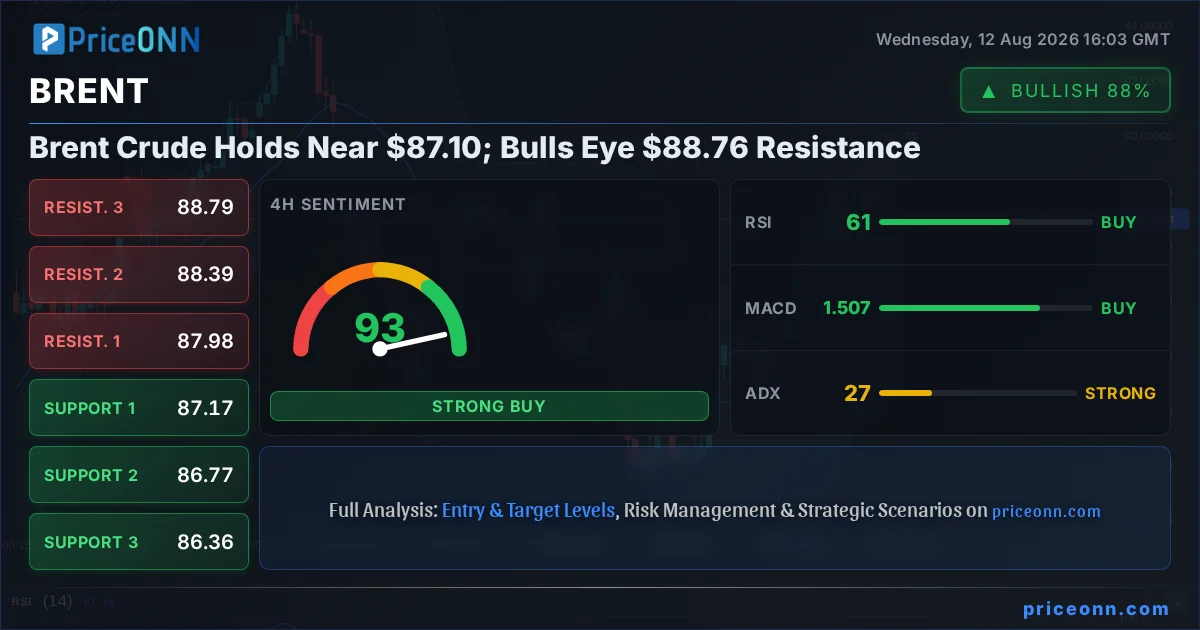
The energy markets are at a fascinating juncture, and Brent crude is right in the thick of it, hovering precariously near the $87.10 mark. Having witnessed a significant surge from its recent lows, the bulls are clearly showing their hand, pushing the price towards the critical resistance level at $88.76. This isn't just a random price point; it represents a significant hurdle that, if cleared, could signal a new phase of upward momentum. My analysis, drawing from years of watching these markets and understanding the underlying infrastructure, suggests that the current technical setup is compelling, but not without its caveats. We're seeing a confluence of indicators pointing towards strength, yet the broader economic backdrop and geopolitical tensions always add a layer of complexity that cannot be ignored. This is precisely where a seasoned trader needs to pay close attention, differentiating between noise and genuine signals.
- Brent crude is trading at $87.10, with a strong bullish trend indicated by ADX at 26.79.
- The immediate resistance is observed at $87.98, with a more significant barrier at $88.76.
- Key support levels are identified at $87.17 and $86.77, crucial for maintaining bullish sentiment.
- RSI at 60.85 suggests room for upward movement, while Stochastic's K value (67.21) indicates potential for further gains before overbought conditions emerge.
- Geopolitical tensions and inflation expectations remain key drivers for oil prices, adding volatility.
The current price action on Brent crude presents a compelling narrative for traders. The 4-hour chart, often a sweet spot for capturing medium-term trends, reveals a robust uptrend with an ADX reading of 26.79. This signifies a strong, established trend, meaning that the current upward momentum is likely to have staying power, at least in the short to medium term. Furthermore, the confluence of signals from key indicators is painting a bullish picture. The RSI(14) at 60.85, while in the neutral zone, clearly leans towards bullish territory, indicating that there's still ample room for prices to climb before hitting overbought conditions. This suggests that the buying pressure is not yet exhausted, a crucial point for those looking to capitalize on the current move.
Adding to the bullish sentiment, the MACD is showing positive momentum, with the MACD line positioned above the signal line. This crossover is a classic bullish signal, often preceding further price appreciation. While the Stochastic indicator's %K line (67.21) is nearing the upper threshold, it hasn't yet entered the extreme overbought territory (typically above 80). This implies that there's still room for the price to ascend before a potential pullback or consolidation phase sets in. The interplay between these indicators suggests that the path of least resistance for Brent crude, in the immediate future, is upwards.
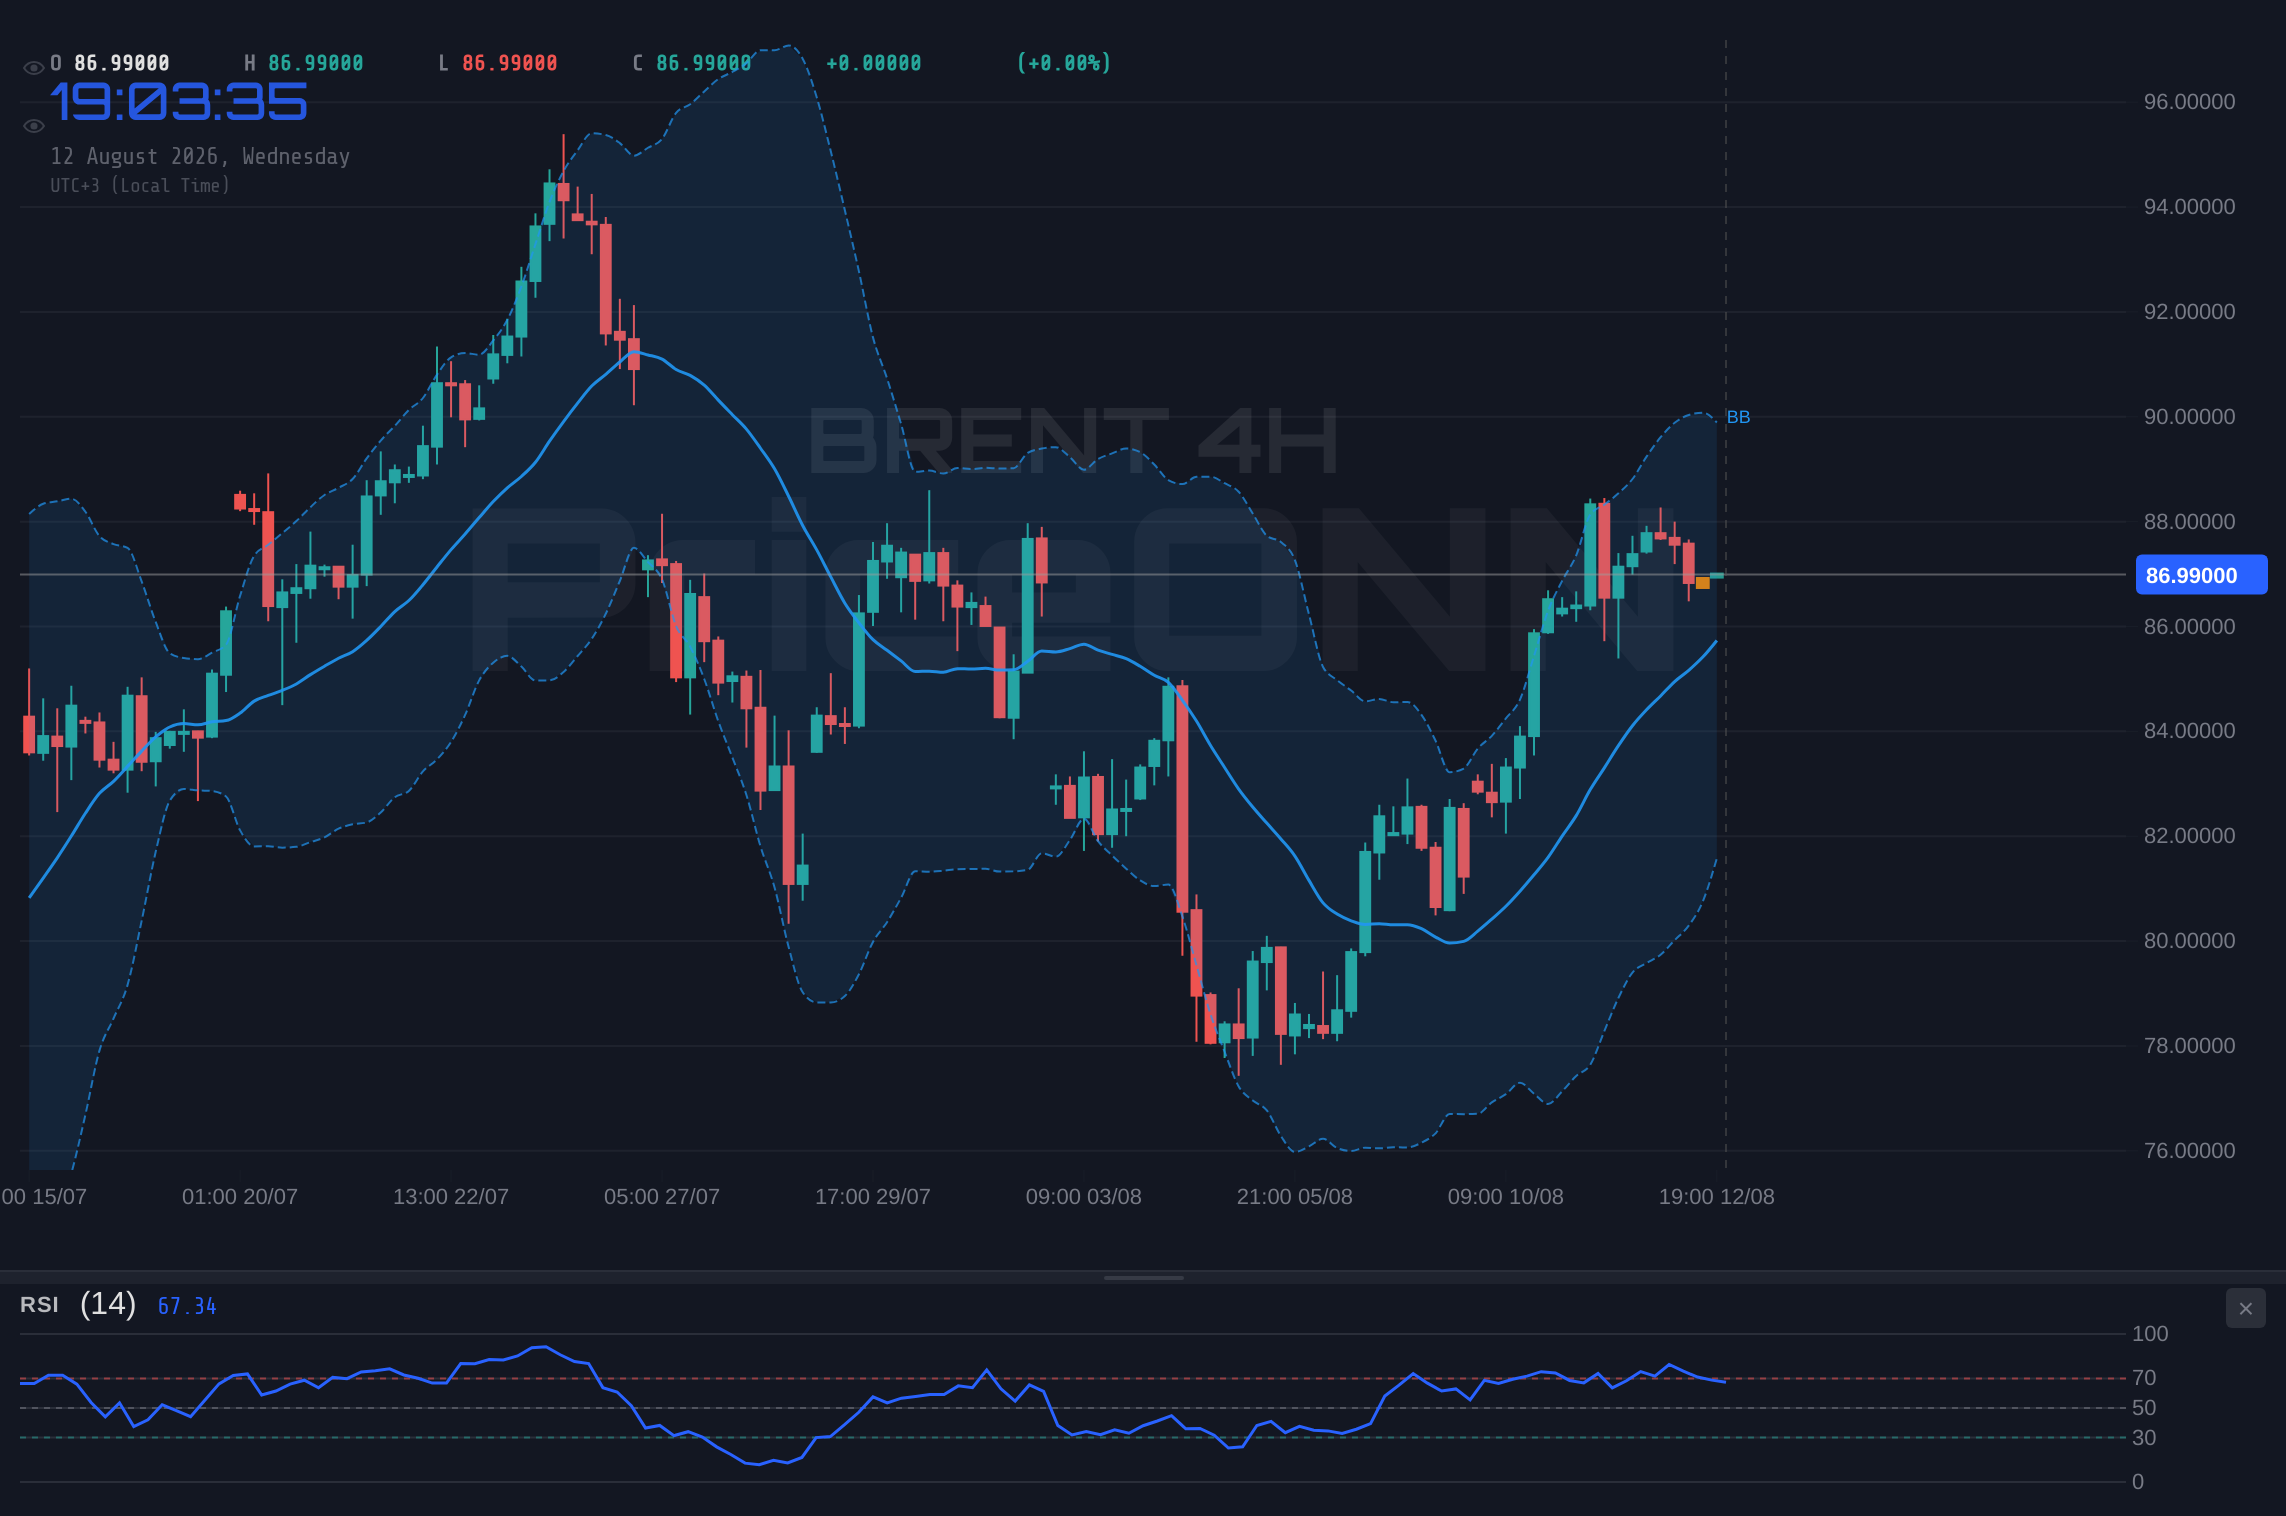
However, as any experienced trader knows, the market is never a one-way street. While the technicals are flashing green, we must consider the levels that matter. The immediate resistance sits at $87.98, a level that has likely seen some profit-taking in the past. A decisive break above this point would strengthen the bullish case, paving the way for a test of the more significant resistance at $88.76. This latter level is particularly important; a sustained move above it could trigger a cascade of buy orders, potentially pushing prices even higher. On the flip side, support is critical. The first line of defense is at $87.17, followed by $86.77. A close below these levels, particularly $86.77, would invalidate the immediate bullish outlook and suggest a potential pullback or even a trend reversal.
The daily chart offers a broader perspective, reinforcing the bullish trend but also highlighting potential long-term challenges. The ADX at 19.36 on the daily timeframe indicates a weaker trend compared to the 4-hour chart, suggesting that while the current uptrend has momentum, it might lack the sustained conviction needed for a major breakout without further fundamental catalysts. The RSI(14) at 54.15 is again in neutral territory, leaning bullish, which aligns with the idea of further upside potential but also suggests that the market is not yet in an extreme bullish phase. The Stochastic, with its %K line at 86.04 and %D at 43.36, is showing a strong upward signal, but it's also nearing extreme overbought conditions on this longer timeframe. This divergence between the 4H and Daily Stochastics warrants attention; it implies that while the short-term trend is strong, the longer-term picture might be approaching a point where consolidation or a correction becomes more probable.
Let's delve into the macro picture, because that's where the real drivers often lie. Geopolitical tensions, particularly in the Middle East, continue to be a significant factor underpinning oil prices. Any escalation or perceived threat to supply routes can send crude prices soaring. We saw this recently with the price action, as Brent rebounded from the $70s towards the $90s. This sensitivity means that even minor geopolitical rumblings can cause outsized price reactions. Furthermore, inflation expectations play a crucial role. As gold prices have climbed, seemingly betting that a $90 oil price won't force the Fed back to tightening, the market is signaling a complex relationship between energy costs, inflation, and monetary policy. The upcoming CPI report will be a critical check on these assumptions.
The recent news flow provides context. While the direct impact on Brent from the subdued July US inflation data (CPI rising 0.1% m/m) might seem minimal at first glance, it reinforces the narrative that the Fed might be nearing the end of its tightening cycle, or at least pausing. This can be bullish for commodities as it potentially eases pressure on demand and reduces the strength of the dollar. The dollar index (DXY) itself is currently trading around 99.86, showing a mixed picture across timeframes. On the daily chart, it's in a downtrend, which typically supports commodities like Brent. However, the 1-hour and 4-hour charts show some bullish consolidation. This mixed DXY signal adds another layer of complexity; a strengthening dollar would typically act as a headwind for oil prices, so monitoring the DXY's next move is paramount.
The correlation between oil prices and broader market sentiment, as indicated by the S&P 500 and Nasdaq, is also something to keep an eye on. The S&P 500 is showing strength, trading around 6572.87, which suggests a generally positive risk appetite. This risk-on environment is usually conducive to higher commodity prices, as investors feel more confident allocating capital to assets perceived as riskier, like oil. Conversely, if equity markets were to falter, we could see a shift towards safe-haven assets, potentially putting pressure on Brent. For now, the correlation appears to be working in favor of the bulls.
Considering the technical indicators and the macro environment, we can outline a few scenarios. The bullish case hinges on a decisive break above $87.98, confirming the strength seen on the 4-hour chart and pushing towards the $88.76 resistance. This scenario gains traction if the DXY weakens and inflation concerns persist. The bearish case would be triggered by a failure to hold support levels, specifically if Brent closes below $87.17, and more critically, below $86.77. Such a move would suggest that the upward momentum has stalled and profit-taking could intensify, potentially leading to a retest of lower levels, perhaps even down to the $85.70 support.
A neutral scenario, or consolidation phase, is also possible. This would likely occur if Brent struggles to break the immediate resistance at $87.98 while also holding above the support at $87.17. In such a scenario, we might see prices trading within a tighter range, perhaps between $87.17 and $87.98, as the market digests recent gains and awaits fresh fundamental or geopolitical catalysts. This sideways movement could be characterized by lower trading volumes and less conviction in either direction, typical of a market pausing before its next significant move.
The infrastructure and industrial underpinnings of the oil market cannot be overstated. While price action captures headlines, the actual production capacity, refinery utilization, and geopolitical stability of key producing regions form the bedrock of sustained price movements. Reports on OPEC+ production levels, inventory data, and any disruptions in major oil-producing nations are critical. For instance, news regarding capacity constraints in key fields or unexpected refinery outages can provide a fundamental justification for the price surges we've witnessed. These are the 'real economy' signals that often precede or confirm the technical patterns we observe on the charts.
Looking ahead, the interplay between central bank policy, inflation data, and geopolitical stability will be key. The upcoming CPI report is a significant event that could sway market sentiment and influence Fed policy expectations. If inflation proves stickier than anticipated, it could prompt renewed hawkishness from the Fed, strengthening the dollar and potentially capping oil's upside. Conversely, softer inflation would reinforce the 'pause' narrative, likely benefiting commodities. Traders must remain vigilant, integrating these macroeconomic factors with the technical picture to navigate the inherent volatility.
The current setup, with Brent trading near $87.10 and strong bullish signals on shorter timeframes, presents an interesting risk-reward proposition. The key is to respect the defined support and resistance levels. A break above $87.98 could open the door for a move towards $88.76, aligning with the bullish sentiment. However, a failure to hold $87.17 support could signal a reversal, making prudent risk management paramount. The market is dynamic, and while the technicals are currently favoring the bulls, the underlying fundamentals and potential for geopolitical events mean that caution should always be exercised.
Bearish Scenario: Profit-Taking Pressure Mounts
60% ProbabilityNeutral Scenario: Consolidation Around $87.50
25% ProbabilityBullish Scenario: Resistance Breakout Targets $88.76
15% ProbabilityFrequently Asked Questions: BRENT Analysis
What happens if BRENT breaks above the $87.98 resistance level?
A sustained break above $87.98 would likely confirm the bullish trend, potentially triggering further buying pressure. This could lead to price targets testing the significant resistance at $88.76, supported by positive momentum indicators and continued risk appetite in the broader market.
Should I consider buying BRENT at current levels around $87.10 given the RSI at 60.85?
Buying at $87.10 presents a risk-reward scenario. The RSI at 60.85 suggests room for upside, but the proximity to resistance at $87.98 means a tight stop-loss below support at $87.17 is crucial. A confirmed breakout above $87.98 would offer a more favorable entry point with less immediate risk.
Is the ADX at 26.79 on the 4-hour chart a strong buy signal for BRENT?
An ADX reading of 26.79 on the 4-hour chart indicates a strong uptrend, suggesting that the current price movement has significant directional conviction. While not a direct buy signal itself, it confirms the trend's strength, making bullish positions more favorable provided other indicators and price action align with this trend.
How will upcoming inflation data and geopolitical tensions affect BRENT's price this week?
Sticky inflation could lead to a stronger dollar and pressure oil prices, while softer inflation might support commodities. Geopolitical risks in the Middle East remain a constant upward pressure. Traders should monitor the CPI report closely, as it could influence Fed policy expectations and, consequently, Brent's trajectory towards $88.76 or a potential retreat to $87.17.
| Indicator | Value | Signal | Interpretation |
|---|---|---|---|
| RSI (14) | 60.85 | Bullish | Room for upside before overbought territory. |
| MACD Histogram | Positive | Bullish | Momentum supporting upward movement. |
| Stochastic (%K/%D) | 67.21/77.94 | Neutral | Nearing overbought, monitor for divergence. |
| ADX | 26.79 | Strong Trend | Confirms current trend strength. |
| Bollinger Bands | Above Mid | Bullish | Price action above the middle band. |
Track markets in real-time
AI-powered analysis, technical indicators and real-time price data.
Join Our Telegram Channel
Breaking market news, AI analysis and trading signals instantly.
Join Channel