

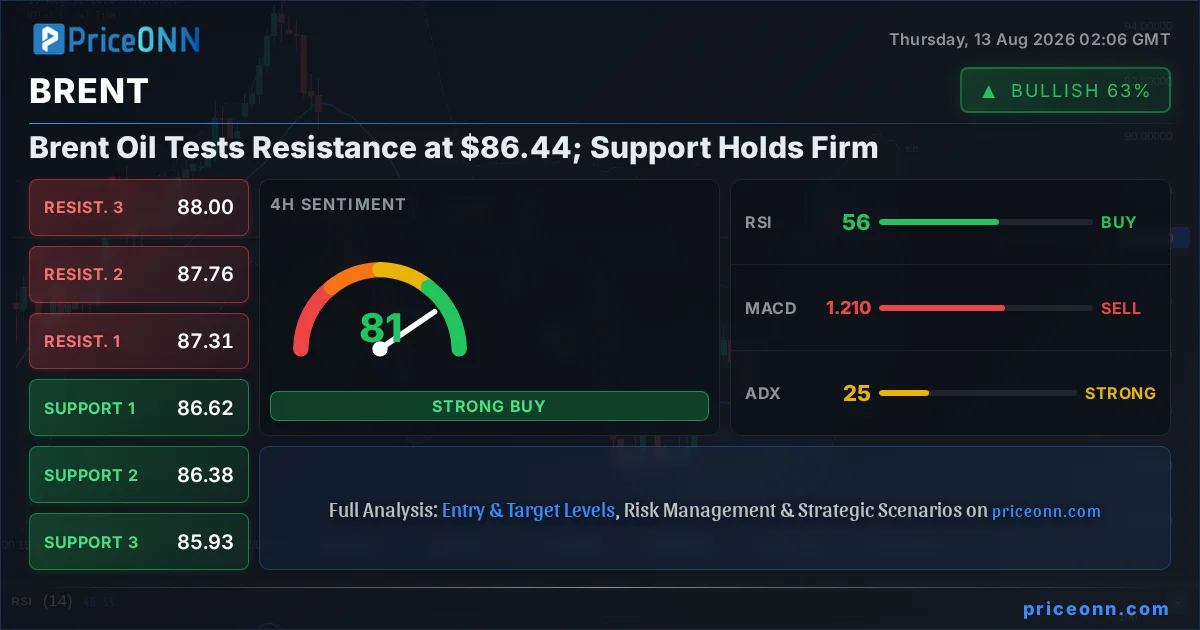
The global energy landscape is in a constant state of flux, and understanding the intricate dance between macroeconomic forces, geopolitical tensions, and the underlying infrastructure is paramount for any serious market participant. As Brent crude oil currently trades around the $86.44 mark, a critical juncture is being tested. This price point is not merely a number; it represents a confluence of recent market sentiment, the lingering effects of geopolitical events, and the technical indicators that chart a potential path forward. The interplay between the strengthening dollar, as indicated by the DXY at 100, and the commodity's movement is a key theme, alongside the broader risk appetite reflected in indices like the S&P 500, currently at 6572.87. This analysis delves into the multifaceted drivers shaping Brent's trajectory, examining the technical signals and the broader market context to provide a comprehensive outlook.
- Brent crude oil is testing resistance near $86.44, a level that has seen significant price action.
- The ADX indicator at 25.25 suggests a strong trend is developing, though Stochastic signals extreme overbought/oversold conditions, creating potential for volatility.
- With the DXY at 100, a strengthening dollar may exert downward pressure on oil prices, contingent on inflation data.
- Geopolitical risks, particularly in the Middle East, remain a background factor supporting oil prices, even as demand-side concerns linger.
- Key support for Brent is identified at $85.70, while resistance looms around $87.31.
The Macroeconomic Crosscurrents Shaping Brent Crude
The current trading environment for Brent crude oil is heavily influenced by a complex web of macroeconomic factors, chief among them the performance of the US dollar. With the Dollar Index (DXY) currently at 100, a level that often signifies strength and can put pressure on dollar-denominated commodities like oil, traders are closely watching for any signs of sustained dollar appreciation. A stronger dollar typically makes oil more expensive for holders of other currencies, potentially dampening demand and weighing on prices. This dynamic is particularly relevant given the recent subdued inflation data from the US in July, which saw the Consumer Price Index (CPI) rise by 0.1% month-on-month, in line with expectations. While this might suggest a pause in aggressive monetary tightening from the Federal Reserve, the market's reaction to such data is nuanced. The divergence between gold's rally towards $4,450, driven by safe-haven demand and anticipation of the upcoming CPI report, and oil's more cautious stance highlights differing market interpretations of inflation and risk.
Furthermore, the performance of major equity indices provides a crucial barometer of global risk sentiment. The S&P 500's current position at 6572.87, showing a daily gain, might suggest a degree of risk-on appetite. However, this needs to be viewed against the backdrop of more mixed signals across other indices, such as the Dow Jones Industrial Average, which is currently seeing a slight dip. This mixed sentiment can translate into volatility for oil prices, as investors weigh the potential for economic growth against inflationary pressures and the possibility of central bank intervention. The energy sector's correlation with broader market movements is undeniable; a significant shift in risk appetite can trigger substantial swings in oil demand expectations, directly impacting Brent's price.
Technical Signals at the $86.44 Juncture
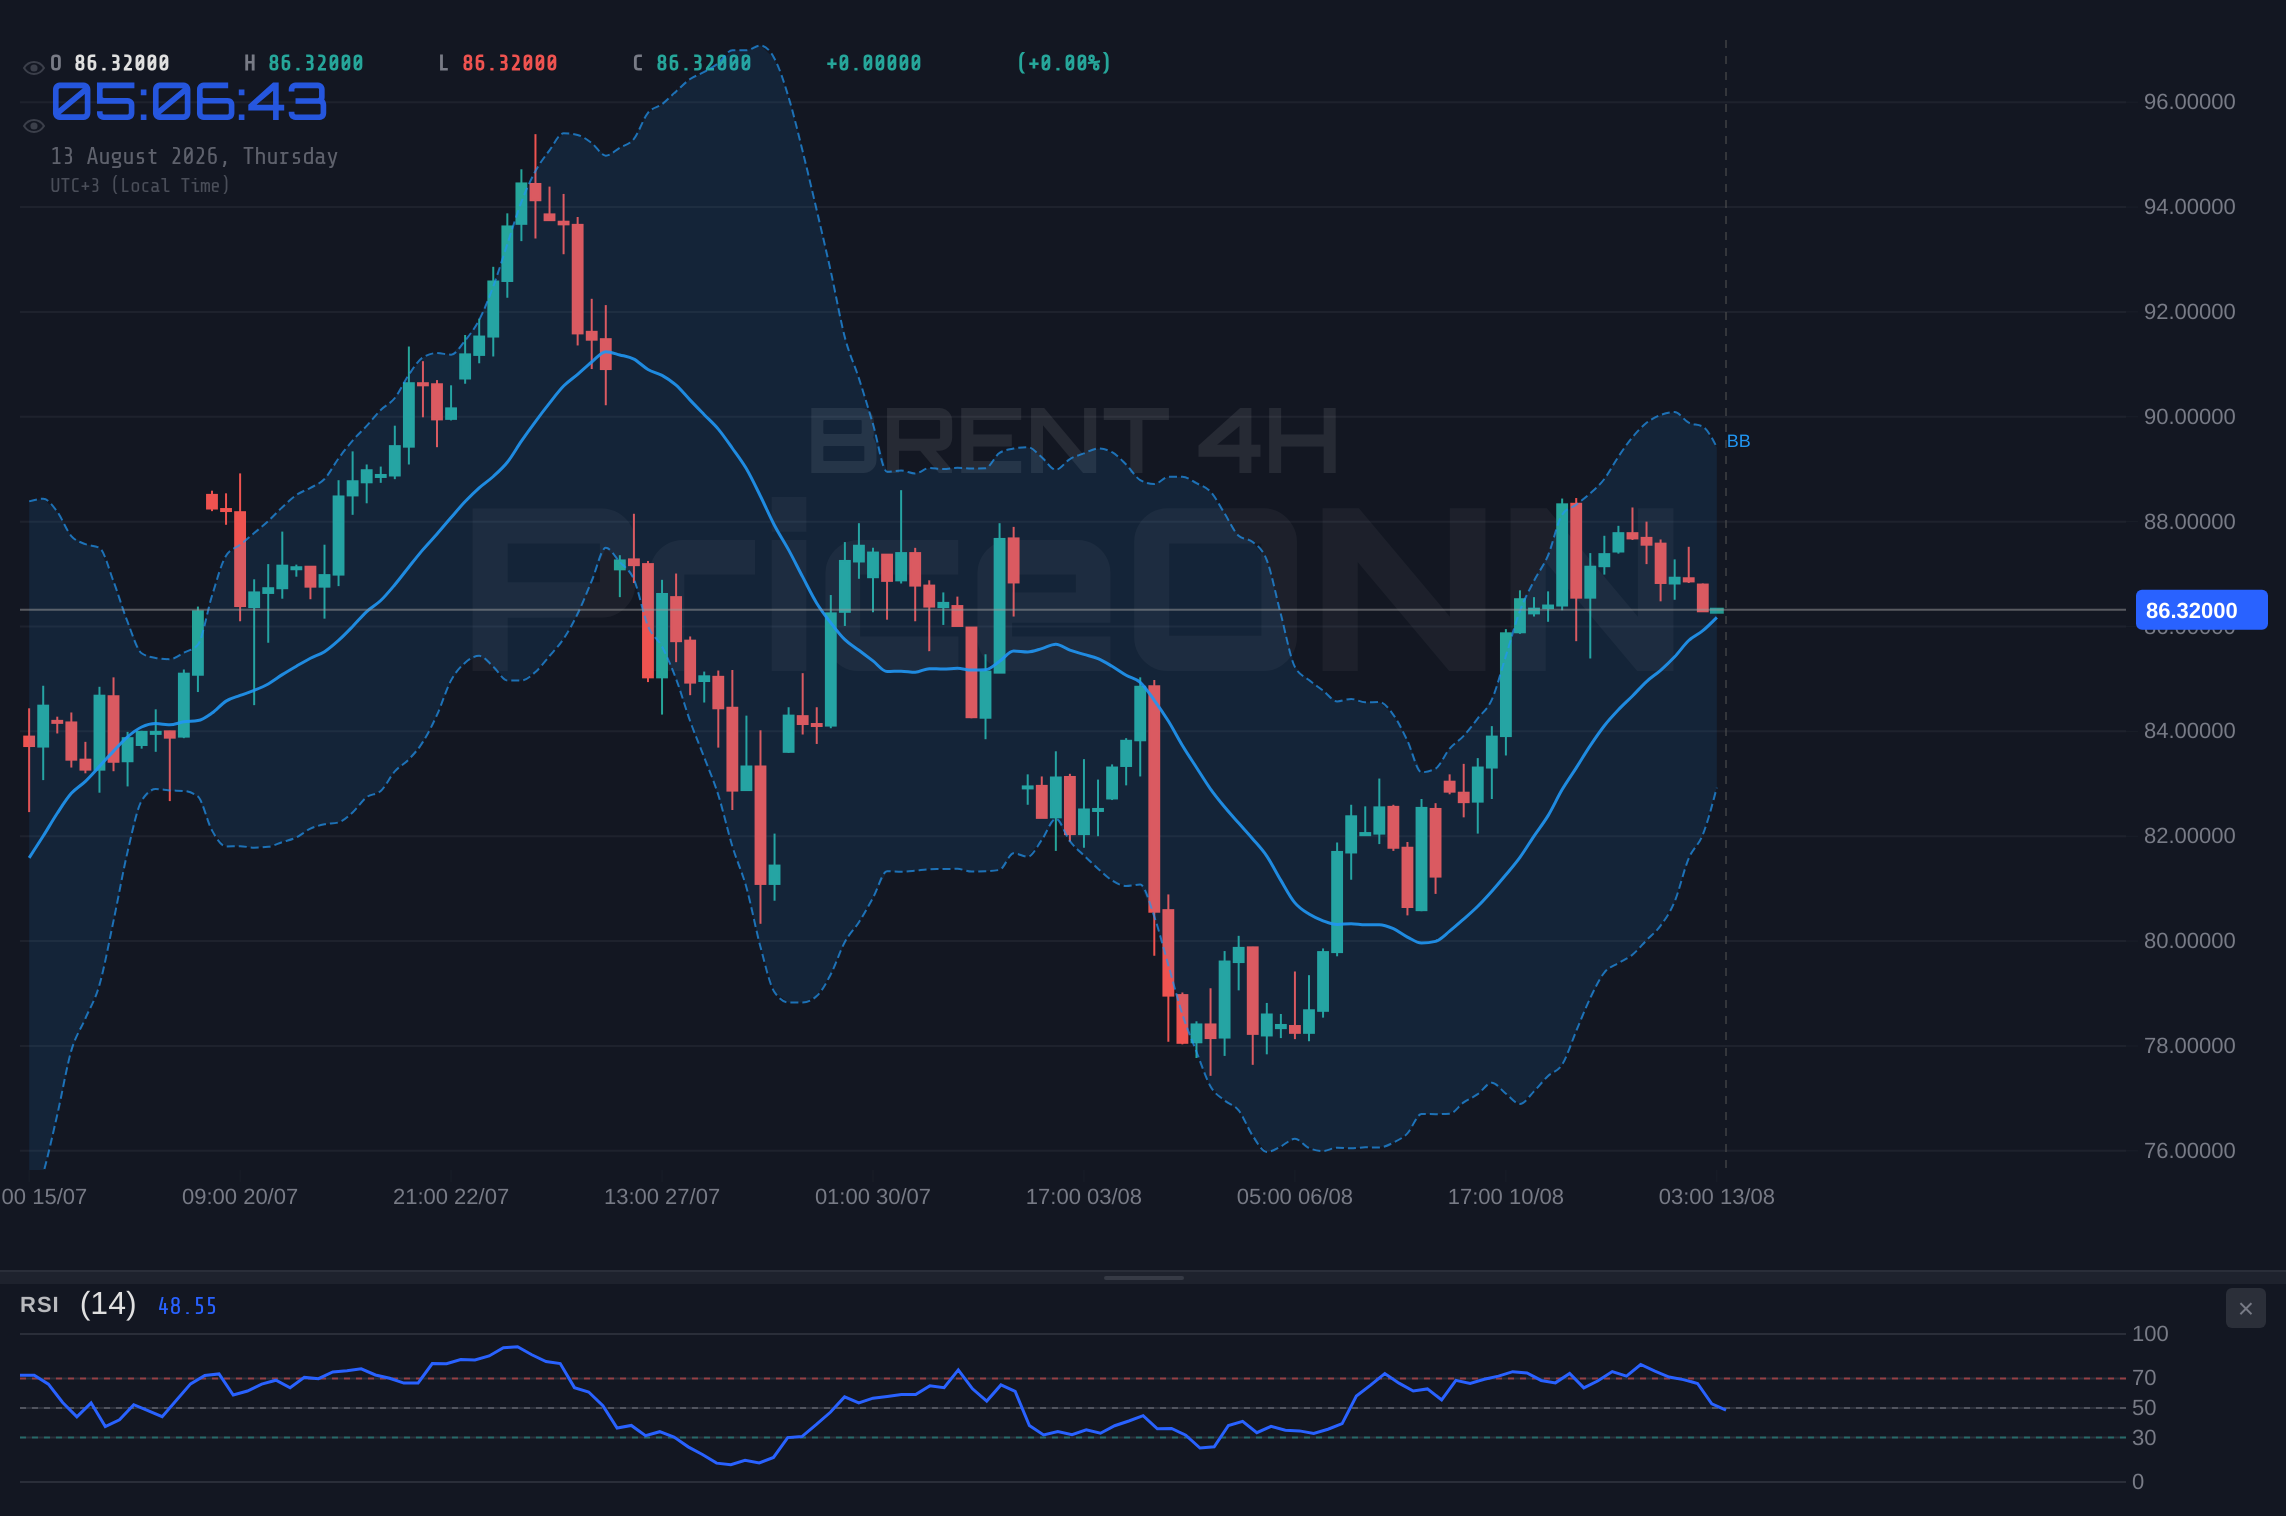
Examining the technical landscape for Brent crude oil reveals a market at a critical juncture, with multiple indicators offering a mixed yet compelling picture. The current price of $86.44 sits just below the 4-hour resistance level of $87.31, but crucially, it is above the immediate 1-hour support at $86.11. The 4-hour trend is identified as neutral with a strength of 50%, suggesting a lack of clear directional conviction on this timeframe. However, the daily chart paints a different story, indicating a strong upward trend (90% strength) with price above the middle Bollinger Band, a sign of bullish momentum. The daily RSI at 53.17 is in neutral territory, showing a slight upward tendency, which aligns with the overall bullish trend indicated by the ADX at 19.36 – a reading that suggests a developing, albeit not yet overpowering, trend.
The divergence in signals across different timeframes is where the real analytical challenge lies. While the daily chart leans bullish, the 1-hour indicators present a more cautious outlook. The 1-hour RSI at 42.86 indicates a downward tendency, and the MACD is below its signal line, suggesting negative momentum. The Stochastic oscillator on the 1-hour chart, however, shows a potential for a bounce with %K (18.97) crossing above %D (46.98), signaling a possible upward movement from oversold conditions. This conflict between short-term bearish signals and longer-term bullish indicators underscores the importance of the $86.44 level and the immediate resistance and support zones. The ADX at 25.25 on the 4-hour chart does indicate a strong trend, but the conflicting signals from RSI and Stochastic suggest that this trend's conviction might be tested around current price levels.
Geopolitical Undercurrents and Supply-Side Dynamics
While technical indicators provide a roadmap of market sentiment and price action, the fundamental drivers of oil prices, particularly geopolitical risks, cannot be overstated. The ongoing tensions in the Middle East, though not currently at a fever pitch, continue to act as a background support for crude prices. Any escalation or perceived threat to supply routes, such as the Strait of Hormuz, can quickly inject significant upward pressure on Brent. This underlying risk premium is a persistent factor that often prevents prices from falling too sharply, even when demand-side concerns emerge. The market's sensitivity to these geopolitical events means that news flow from the region is constantly monitored for potential disruptions.
In addition to geopolitical factors, the decisions made by major oil-producing nations, particularly OPEC+ members, play a crucial role. While no immediate OPEC+ meetings are on the immediate horizon based on the provided data, the group's production quotas and adherence to them remain a key determinant of global supply. Any indication of increased production, or conversely, a commitment to tighter supply management, can significantly impact price expectations. The current market pricing of Brent at $86.44 may already be reflecting expectations of continued supply discipline, but any deviation from this could lead to sharp price adjustments. The recent subdued inflation data, while potentially easing pressure on central banks to hike rates aggressively, also hints at a global economy that might not be firing on all cylinders, posing a counterbalancing force to supply-driven price increases.
The Dollar's Influence and Inflationary Expectations
The relationship between the US dollar and oil prices is a cornerstone of commodity market analysis. As the DXY hovers around 100, its strength is a significant consideration for Brent crude. A sustained rise in the dollar, fueled by factors such as higher US interest rate expectations or a global flight to safety, would typically translate into downward pressure on oil prices. This is because oil is priced in dollars, making it more expensive for countries using other currencies. Conversely, a weakening dollar can provide a tailwind for oil, as it becomes cheaper for international buyers, potentially stimulating demand.
The recent July CPI data, showing inflation in line with expectations, adds another layer to this dynamic. If this data reinforces the view that inflationary pressures are moderating, it could temper expectations of further aggressive interest rate hikes by the Federal Reserve. This, in turn, might limit dollar strength and offer some support to oil prices. However, the market's interpretation is crucial. Gold's rally suggests that while inflation might be cooling, it is still a concern for investors seeking inflation hedges, and the precious metal's upward trajectory is viewed as a signal of underlying economic anxieties. The market is essentially betting on the Fed's next move, and any deviation from the current path, perhaps signaled by future economic data or central bank commentary, could dramatically alter the dollar's trajectory and, consequently, Brent's price.
Market Sentiment and Risk Appetite
The broader market sentiment, often gauged by the performance of major equity indices like the S&P 500 and Nasdaq, plays a pivotal role in the outlook for commodities. With the S&P 500 currently trading higher at 6572.87, there's an indication of some risk-on sentiment prevailing. This generally supports demand for riskier assets, including oil, as it suggests expectations of economic growth and increased industrial activity. A strong equity market often correlates with higher oil consumption. However, the mixed performance across different indices, with the Dow Jones showing a slight decline, introduces an element of caution. This divergence can signal underlying fragility or sector-specific rotations rather than broad-based optimism.
The narrative surrounding Bitcoin, currently facing resistance near $65,500, also adds to the complexity of risk sentiment. While often seen as a risk-on asset, its recent struggles suggest that even in the cryptocurrency space, investors are being selective. For oil, a sustained decline in risk appetite, potentially triggered by disappointing economic data or escalating geopolitical tensions, could lead to a sell-off. This would manifest as lower demand forecasts and a subsequent drop in Brent prices, irrespective of supply-side factors. Therefore, monitoring these broader market trends is essential for understanding the tailwinds or headwinds that Brent crude may face in the near term.
Navigating the Technical Levels: Support at $85.70
From a technical standpoint, the immediate price action around $86.44 is critical. The 4-hour chart shows resistance at $87.31 and support at $86.38, with the 1-hour chart highlighting support at $86.11. The most significant support level identified for Brent is $85.70. A decisive break below this level would signal a potential shift in momentum, invalidating the current bullish bias and opening the door for further declines towards lower support zones. On the flip side, sustained price action above $86.44, with a clear break and hold above the 4-hour resistance at $87.31, would reinforce the bullish sentiment and could pave the way for a move towards the next resistance level at $88.00. The ADX at 25.25 on the 4-hour chart indicates a strong trend is in play, but the conflicting signals from oscillators like Stochastic suggest that the market is seeking further confirmation before committing to a significant move.
The interplay between these levels is crucial. Traders will be looking for confirmation signals, such as increased volume on a breakout or breakdown, or a clear divergence in oscillator readings. For instance, if Brent were to break above $87.31 with strong volume and RSI moving decisively into overbought territory (above 70), it would validate the bullish scenario. Conversely, a close below $85.70, accompanied by a drop in RSI below 40 and negative MACD crossover, would strongly support a bearish outlook. The current neutral signals on the 1-hour chart suggest a period of consolidation or a tug-of-war between buyers and sellers before the next significant move.
Scenario Analysis: Potential Paths for Brent Crude
Bearish Scenario: Downside Risk Below $85.70
65% ProbabilityNeutral Scenario: Consolidation Around $86.44
25% ProbabilityBullish Scenario: Breakout Above $87.31
10% ProbabilityConclusion: Navigating Uncertainty with Discipline
The current market environment for Brent crude oil is characterized by a delicate balance of bullish and bearish forces. While the underlying trend on the daily chart suggests upward potential, supported by factors like geopolitical risk premiums and potential supply discipline, short-term technical indicators and the strong DXY at 100 introduce significant headwinds. The critical support at $85.70 and resistance at $87.31 are the immediate battlegrounds. A decisive move beyond these levels will likely be driven by upcoming economic data, particularly inflation figures, and any shifts in geopolitical stability.
For traders, the emphasis must be on risk management and waiting for clear signals. The divergence in technical indicators across timeframes suggests that patience will be rewarded. A break below $85.70, supported by negative macro news or dollar strength, presents a bearish opportunity. Conversely, a sustained move above $87.31, perhaps fueled by positive risk sentiment or unexpected supply disruptions, would open the door for further upside. In the absence of such clear breaks, consolidation around the current $86.44 level is a distinct possibility.
As an electrical-electronics engineer and expert witness specializing in energy systems, my perspective emphasizes the infrastructure that underpins these markets. While price action is vital, understanding production capacity, refinery operations, and global energy infrastructure resilience provides a deeper context. The current technical setup demands attention, but the long-term stability of Brent prices will ultimately depend on supply-side robustness and evolving global energy demand dynamics, influenced heavily by regulatory frameworks and technological advancements in energy production and storage.
Frequently Asked Questions: BRENT Analysis
What happens if BRENT breaks below the $85.70 support level?
A break below $85.70 would invalidate the current bullish sentiment, potentially triggering a sell-off. The next significant downside targets would be the daily support levels at $84.01 and then $82.64, signaling a more pronounced bearish trend.
Should I consider buying BRENT at current levels around $86.44, given the mixed signals?
Caution is advised at current levels due to the conflicting technical signals and the proximity to resistance at $87.31. A confirmation, such as a sustained break above $87.31 with strong volume, would be a more prudent entry trigger for a bullish position.
Is the RSI at 53.17 on the daily chart a buy signal for BRENT?
An RSI of 53.17 on the daily chart is considered neutral, indicating neither overbought nor oversold conditions. While it aligns with the overall strong daily trend, it doesn't provide a strong independent buy signal on its own and requires confluence with other indicators and price action.
How will the upcoming CPI data impact BRENT prices this week?
Subdued CPI data, as seen in July, could lessen pressure for aggressive Fed rate hikes, potentially weakening the dollar and supporting oil. Conversely, any signs of persistent inflation could strengthen the dollar and weigh on Brent. Market participants will be closely watching for deviations from expectations.
Track markets in real-time
AI-powered analysis, technical indicators and real-time price data.
Join Our Telegram Channel
Breaking market news, AI analysis and trading signals instantly.
Join Channel