

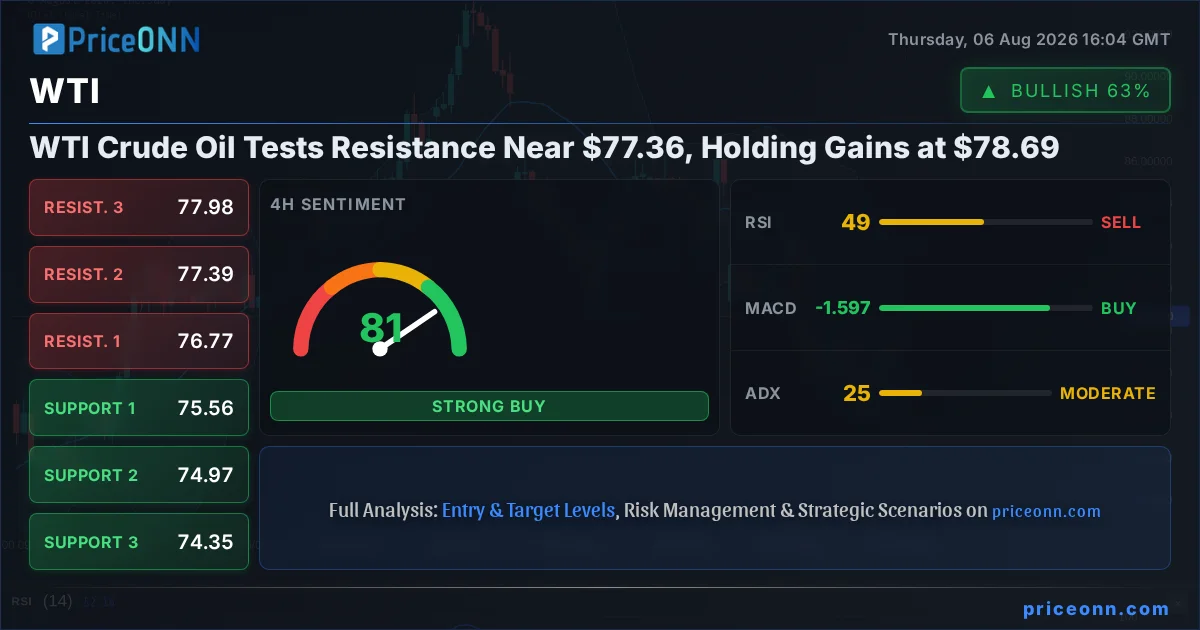
The immediate question for anyone watching the energy markets right now is what's happening with WTI Crude Oil. Currently trading at $78.69, WTI has shown resilience, managing to hold onto recent gains even as it bumps against a key resistance level. The charts are painting a picture of a market in a bit of a tug-of-war, with moderate trends and indicators sending mixed signals. This isn't a clear runaway train in either direction; instead, it's a situation demanding careful observation and a disciplined approach. The ADX reading, sitting at 24.61, confirms this moderate trend strength, suggesting that while a direction is present, it hasn't committed with the kind of force that signals a major breakout or breakdown is imminent. For traders, this means patience is paramount. The real setup is forming, but we're not quite there yet.
- WTI Crude Oil is trading at $78.69, testing resistance near $77.36.
- The ADX at 24.61 indicates a moderate trend, suggesting a lack of strong commitment from either bulls or bears.
- Stochastic Oscillator is in an extreme zone (K=53.22, D=24.57), signaling a potential upward move but demanding caution due to the moderate trend.
- A daily close above $77.82 (R1) would be needed to confirm bullish momentum, targeting higher resistance levels.
- Conversely, a break below the $76.67 support level could signal further downside towards $76.36.
Navigating the $78.69 Crossroads: What the Charts Reveal
Looking at the 1-hour chart for WTI, the picture is one of consolidation and cautious optimism, bordering on neutral. The RSI(14) is hovering around 69.71, which is certainly in the upper part of the neutral zone, leaning towards overbought but not definitively there. This suggests that while momentum has been building to the upside, there's room for further gains before sellers might step in aggressively. However, the MACD is showing positive momentum, with its histogram above the signal line, which typically supports a bullish view. Yet, the Stochastic Oscillator is a bit more emphatic, with the %K line (53.22) well above the %D line (24.57), indicating a strong upward signal and suggesting that buyers are gaining traction. This confluence of signals on the shorter timeframe suggests that the immediate pressure is to the upside, but the overall trend strength, as indicated by the ADX at 23.54, is only moderate. This means that while we might see some upward movement, it's unlikely to be a sharp, decisive rally without further confirmation.
The Bollinger Bands on the 1-hour chart are currently above the middle band, also hinting at bullish pressure. However, the ADX value of 23.54 is crucial here. It's not indicating a strong, established trend, but rather a moderate one. This means that the current upward movement could be part of a larger consolidation pattern or a precursor to a more significant move, either up or down, depending on what happens next. The 'General Signal' on this timeframe leans towards 'BUY' (7 Buy, 1 Sell, 0 Neutral), reinforcing the idea that short-term traders might be looking for opportunities to go long. But as always, we must consider the broader context and longer timeframes to get a complete picture. The key takeaway from the 1-hour chart is that while there are bullish signals, the moderate trend strength suggests we need to see further confirmation before expecting a sustained rally.
The 4-Hour Perspective: A Tale of Two Trends
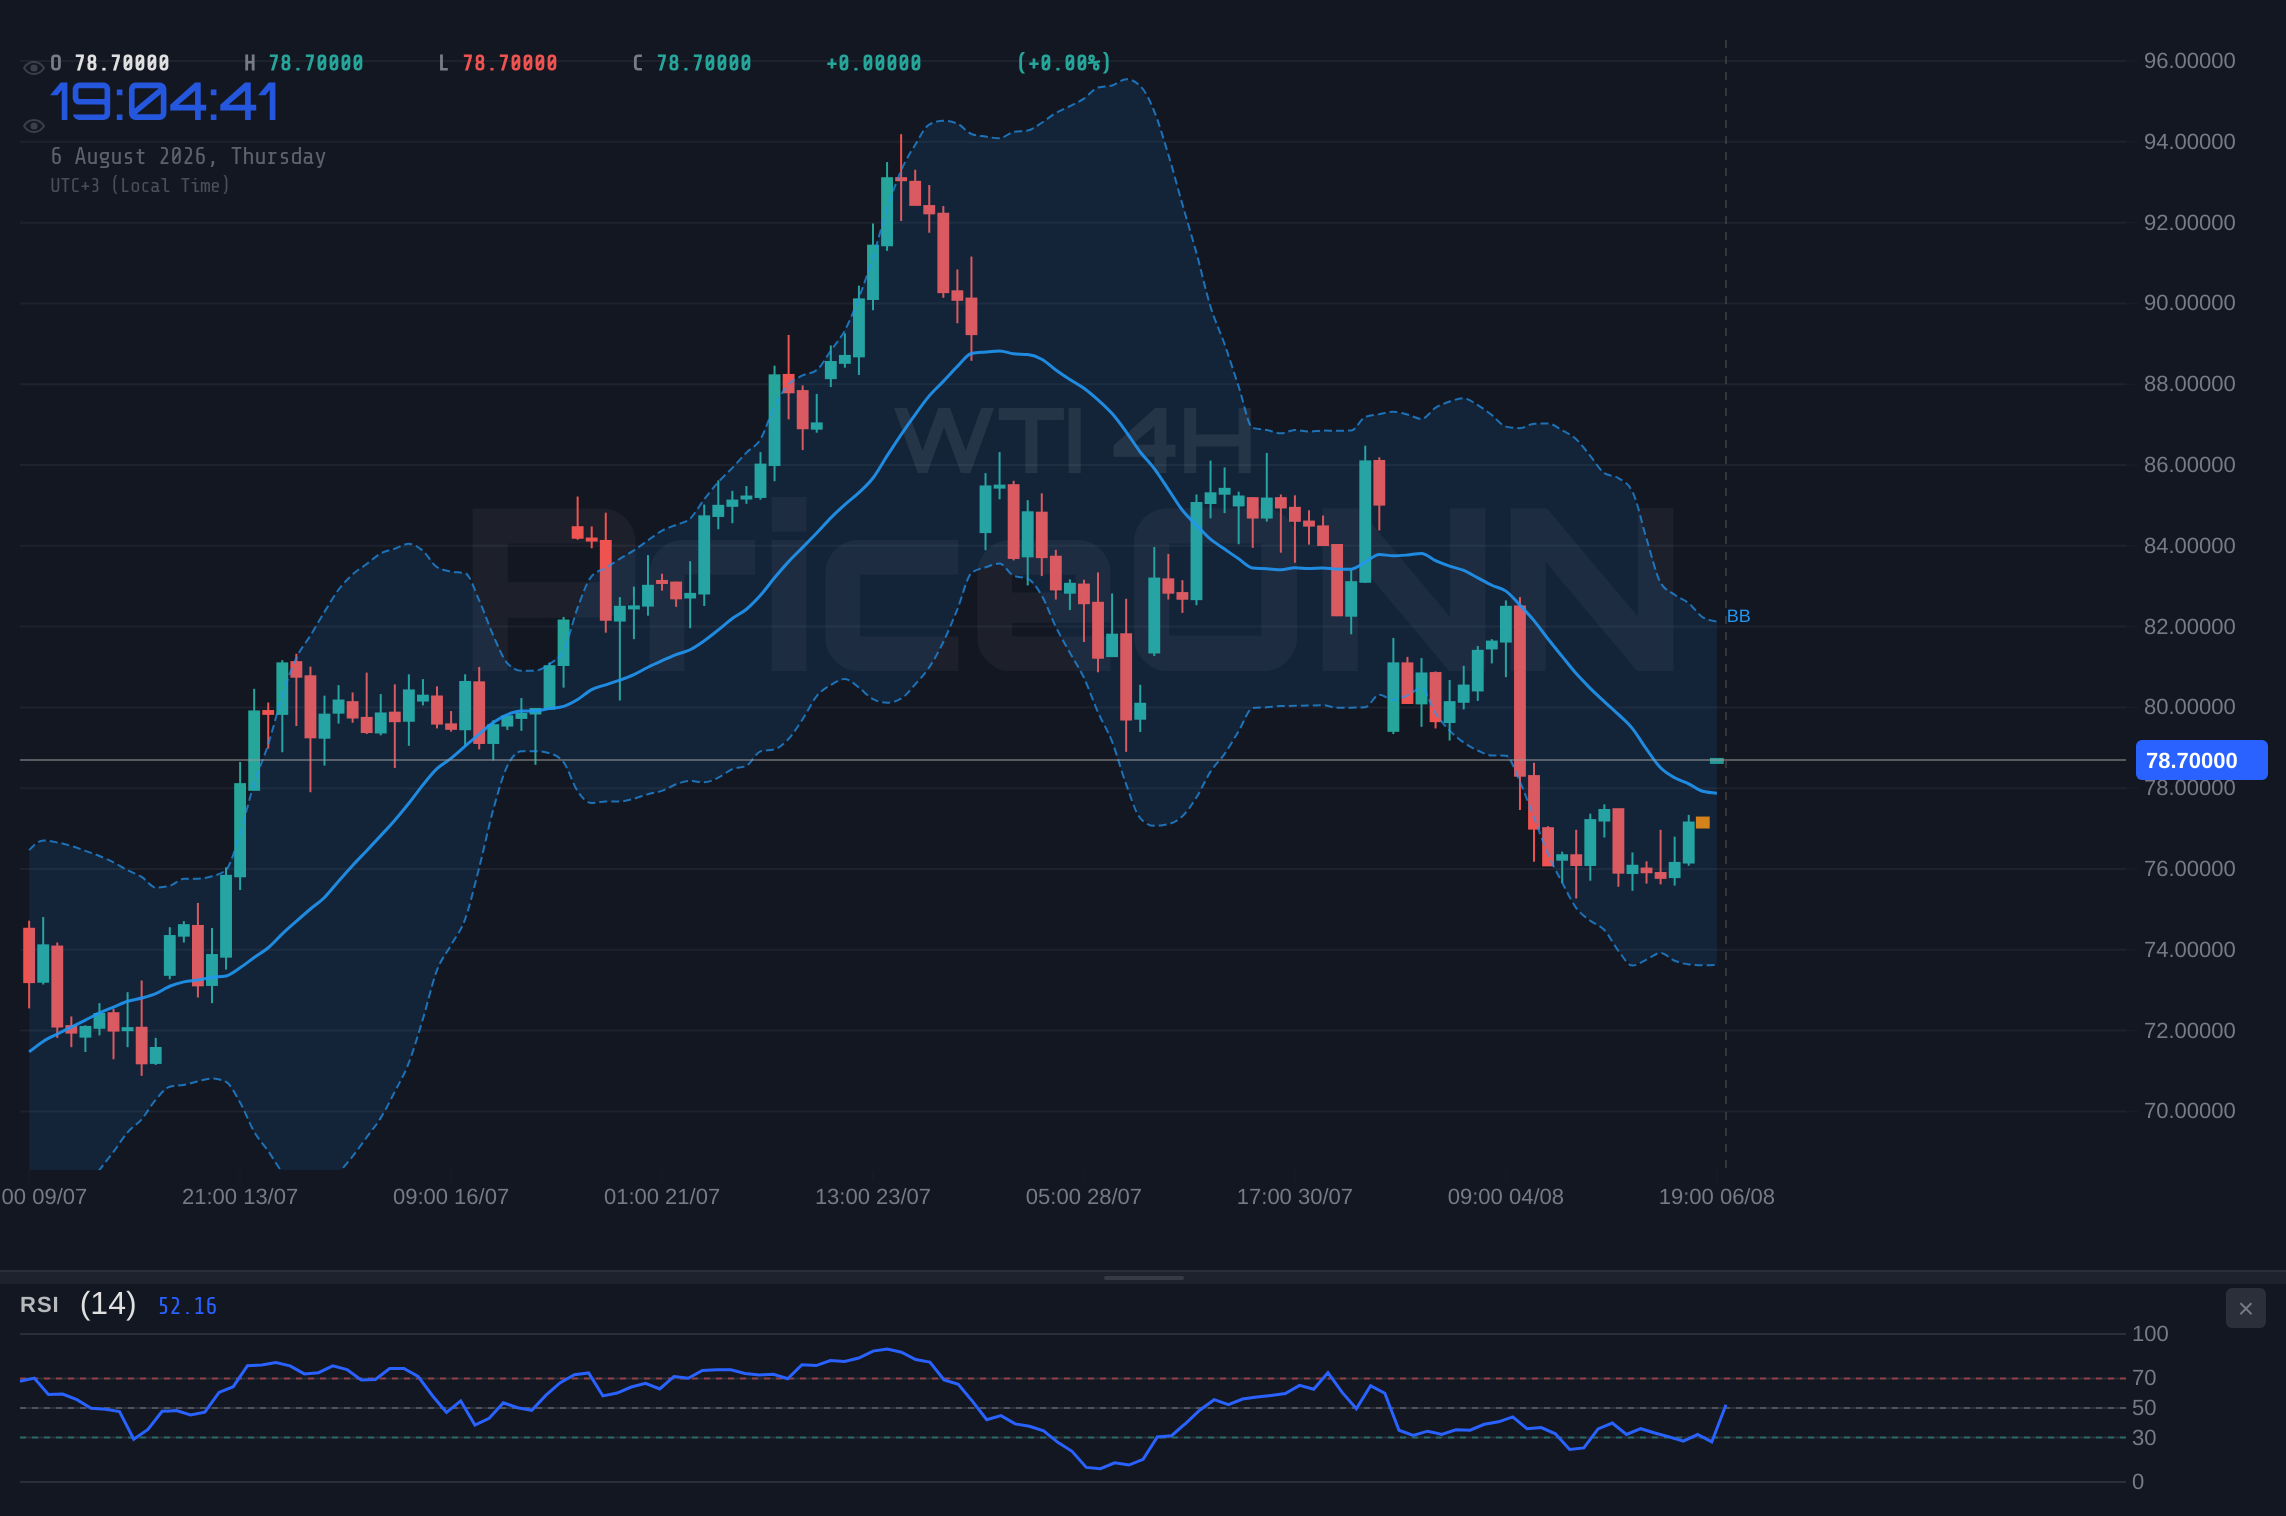
Shifting to the 4-hour timeframe, the narrative gets a bit more complex. Here, the trend is identified as 'Nötr' (Neutral) with a power of 50%, which immediately tells us that short-term impulses might be battling against a more balanced market sentiment. The RSI(14) is sitting at 48.72, firmly in neutral territory and showing a slight downward tendency. This contrasts with the 1-hour chart's more bullish RSI reading. The MACD here is also showing positive momentum, with its histogram above the signal line, which is generally a bullish sign. However, the Stochastic Oscillator presents a different story: %K is at 53.22 and %D is at 24.57, indicating a strong upward signal, but this is where the 'moderate trend' from the ADX (24.61) becomes critical. It implies that this Stochastic signal, while strong on paper, might not have the underlying trend strength to sustain a significant move. The Bollinger Bands are sitting above the middle band, which is usually a sign of bullishness, but it's the overall signal that warrants attention.
The 'General Signal' on the 4-hour chart is a mixed bag, leaning slightly towards 'BUY' (5 Buy, 3 Sell, 0 Neutral). This ambiguity is precisely why the 50% trend power is so significant. It suggests that the market is at a crossroads. We're seeing conflicting signals across different indicators and timeframes. The ADX at 24.61 on this timeframe is also indicative of a moderate trend, not a strong one. This means that the price action might be choppy, with potential for reversals or consolidations. For a more decisive view, we need to look at the daily chart. The 4-hour perspective tells us that while there are some bullish leanings, the market lacks conviction. It’s a waiting game, and the key levels we'll discuss shortly become even more important in defining the next likely move.
Daily Chart Insights: The Long-Term Picture for WTI
On the daily chart, WTI Crude Oil presents a picture that is predominantly neutral, with a trend power of 50%. This suggests that the longer-term sentiment is not strongly directional, and the recent price action is more reflective of short-term fluctuations or a market searching for direction. The RSI(14) is at 46.8, which is in the neutral zone and showing a slight downward tendency. This contrasts with the short-term bullish signals and suggests that the longer-term momentum might be waning. The MACD is exhibiting negative momentum, with the histogram below the signal line, a bearish indicator that suggests selling pressure is building. This is a significant divergence from the bullish signals seen on the 1-hour chart and even the mixed signals on the 4-hour chart. The Stochastic Oscillator, however, is showing a rising signal with %K at 11.68 and %D at 23.52, indicating an oversold condition and a potential for a bounce. This is a classic case of conflicting indicators across timeframes.
The Bollinger Bands on the daily chart are below the middle band, which often signals bearish pressure or a potential for a downside continuation. The ADX value here is 22.57, which, again, points to a moderate trend, not a strong one. This reinforces the idea that the market lacks a clear directional bias over the longer term. The 'General Signal' for the daily timeframe is decidedly 'SELL' (1 Buy, 7 Sell, 0 Neutral). This strong bearish signal on the daily chart, coupled with the neutral-to-slightly-bearish RSI and MACD, paints a cautious picture for WTI. While short-term charts might flirt with bullishness, the longer-term technicals suggest that upside potential may be limited, and downside risks are more pronounced. This divergence between short-term bullish signals and long-term bearish indicators is precisely what defines a 'WATCH_ZONE' scenario. It’s a market that needs a catalyst to break out of its current equilibrium.
Key Levels to Watch: Defining the Battleground
With WTI trading at $78.69, the immediate price action is critical. On the 1-hour chart, the first resistance level is at $77.82, followed by $78.13 and $78.55. It's important to note that the current price of $78.69 is actually above the first two resistance levels on this shorter timeframe, which might seem bullish. However, the daily chart's resistance levels are far more significant for defining the broader market sentiment. The first daily resistance is at $79.99, then $81.38, and finally $82.66. For any sustained bullish move to occur, WTI would need to decisively break and hold above these daily resistance levels.
Conversely, support levels are where buyers might step in. On the 1-hour chart, immediate support is seen at $77.09, then $76.67, and $76.36. On the daily chart, the first significant support level is at $77.32. Below that, we have further support at $76.04 and $74.65. The current price of $78.69 is trading above the 1-hour resistance levels but below the daily resistance level of $79.99. It is also above the immediate daily support of $77.32. This positioning between short-term resistance and longer-term support is what creates the current indecision. A clear break above the daily resistance of $79.99 would be a strong bullish signal, while a decisive drop below the daily support of $77.32 would likely trigger further selling pressure.
The Trade-Off: What Needs to Happen for a Clear Setup
The current technical setup for WTI Crude Oil is what we call a 'WATCH_ZONE'. The ADX at 24.61 across the daily and 1-hour charts signifies a moderate trend, meaning neither the bulls nor the bears have a firm grip on the market. This is reinforced by the conflicting signals from various indicators. For instance, while the 1-hour chart shows bullish momentum with RSI nearing 70 and Stochastic signaling upward, the daily chart presents a bearish picture with a negative MACD and RSI below 50. This divergence is precisely why a clear trade setup hasn't materialized yet. We need to see a commitment from the market. A daily close above the first daily resistance level of $79.99 would be a significant bullish development. This would not only break the immediate resistance but also align with the short-term bullish signals, potentially opening the door for a move towards $81.38 (R2) and then $82.66 (R3). Such a move would require sustained buying pressure and confirmation from other indicators.
On the flip side, if WTI fails to break above $79.99 and instead succumbs to selling pressure, the first key level to watch would be the daily support at $77.32. A break below this level, especially with increased volume, could trigger a cascade of selling, testing the next support at $76.04 and potentially reaching $74.65. This bearish scenario would be supported by a weakening of short-term bullish signals and confirmation from daily indicators turning more negative. The Stochastic Oscillator, currently showing a strong upward signal on the 1-hour chart (K=53.22, D=24.57), would need to reverse, and the daily MACD would need to remain bearish or turn more negative. Until one of these levels is decisively breached with confirmation, WTI is likely to remain in this elevated, yet uncertain, trading range. The current price of $78.69 is sitting in a critical zone where the next significant move will be dictated by which side can break through the prevailing technical barriers.
Correlation and Context: DXY and Equities
Understanding WTI's price action in isolation is insufficient; its relationship with broader market indices like the DXY (Dollar Index) and equity markets (SP500, Nasdaq) is crucial. The DXY is currently trading at 100.01 and showing a strong upward move (0.33% daily change). Historically, a strengthening dollar often puts downward pressure on commodities like WTI, as they become more expensive for holders of other currencies. The fact that WTI is showing some resilience despite the rising DXY is noteworthy. It suggests that either the market is pricing in other factors more heavily, such as geopolitical tensions or supply concerns, or the dollar's strength is not yet at a level that significantly overwhelms commodity demand. If the DXY continues its ascent, it will likely act as a headwind for WTI, making it harder for prices to break higher resistance levels.
Equity markets are also sending mixed signals. The SP500 is up 0.74% to 6572.87, while the Nasdaq is down 0.31% to 29378.98. This divergence indicates a mixed risk appetite. While the broader market sentiment isn't uniformly bearish, the slight weakness in the tech-heavy Nasdaq could hint at underlying caution. Generally, a strong risk-off sentiment in equities would correlate with lower oil prices, as demand expectations diminish. However, the recent surge in Brent Crude Oil (up 3.72% to $81.52) and WTI (up 3.43% to $78.69) suggests that supply-side concerns or geopolitical factors might be temporarily overriding broader risk sentiment. The news of the Hormuz crisis, although seeing some 'optimism awaiting proof', continues to be a background factor that could support oil prices by threatening supply routes. This complex interplay between a strengthening dollar, mixed equity performance, and specific energy supply concerns creates the current 'WATCH_ZONE' environment for WTI.
What the News Cycle Suggests: Hormuz and Supply Fears
The geopolitical landscape is currently a significant driver for oil prices, and the ongoing situation in the Strait of Hormuz cannot be ignored. While there's talk of 'Hormuz optimism awaiting proof', the reality is that any disruption or perceived threat to this critical chokepoint for global oil supply can have an immediate impact on WTI and Brent prices. Reports indicate that Iranian attacks on vessels are continuing, effectively closing the strait as a reliable passage for LPG trade, and by extension, posing a risk to crude oil shipments. This underlying supply risk provides a fundamental floor for oil prices, even when technical indicators might suggest otherwise.
Furthermore, Indian refiners are reportedly continuing their buying spree of crude from West Africa, a trend that has been amplified as the Middle East crisis has 'sapped supply'. This diversification of sourcing by major consumers like India indicates a proactive response to potential supply chain disruptions originating from the Middle East. While WTI is currently trading at $78.69, these supply-side fundamentals suggest that any escalation in geopolitical tensions or a more concrete threat to major shipping lanes could quickly push prices higher, regardless of the immediate technical signals. Conversely, any de-escalation or resolution of these tensions could lead to a rapid unwinding of the risk premium currently embedded in oil prices. The market is, therefore, caught between the immediate technical picture and the potential for significant fundamental shifts driven by geopolitics.
The Trader's Dilemma: Patience vs. Opportunity
For active traders, the current WTI environment at $78.69 presents a classic dilemma: the need for patience versus the desire to capitalize on potential opportunities. The moderate trend strength (ADX around 24) and conflicting indicator signals across different timeframes mean that entering a trade prematurely could lead to whipsaws and losses. A scalper might look for very short-term moves based on the 1-hour chart's bullish leanings, but even then, the risk of reversal is high. A swing trader, however, would likely wait for a clearer signal – perhaps a decisive break above the daily resistance of $79.99, or a clear rejection and fall below the daily support of $77.32.
The key is to understand what constitutes a 'clear signal'. It would involve not just price action but also confirmation from multiple indicators and perhaps increased volume. For instance, a bullish scenario would be strengthened if RSI moves sustainably above 70 on the daily chart, the MACD crosses bullishly, and price holds above $79.99. Conversely, a bearish scenario would be confirmed if RSI falls below 40, MACD remains negative, and price breaks decisively below $77.32. Until then, managing risk and waiting for a high-probability setup is the most prudent strategy. The market is offering hints, but it hasn't yet provided the definitive roadmap for a strong directional trade.
Bearish Scenario: Testing Lower Support
55% ProbabilityNeutral Scenario: Consolidation Around $78.69
30% ProbabilityBullish Scenario: Breaking Resistance
15% ProbabilityFrequently Asked Questions: WTI Crude Oil Analysis
What happens if WTI breaks below the $77.32 daily support level?
A close below the daily support at $77.32 would invalidate the current neutral stance and likely trigger further selling pressure. This could lead to a test of the next support at $76.04, with a potential downside target towards $74.65 if the bearish momentum intensifies.
Should I consider buying WTI at current levels around $78.69 given the mixed signals?
Buying at current levels around $78.69 is a high-risk proposition due to the conflicting indicators and moderate trend strength. A confirmed bullish setup would require a daily close above $79.99 resistance, with confirmation from RSI moving above 70 and MACD showing sustained positive momentum.
Is the Stochastic Oscillator signal at K=53.22, D=24.57 a buy signal for WTI at $78.69?
While the Stochastic Oscillator showing %K above %D (53.22 vs 24.57) on the 1-hour chart is technically a bullish signal, its reliability is questionable given the moderate ADX trend strength (24.61). This signal alone is not sufficient for a trade without confirmation from other indicators and price action.
How might the strengthening DXY at 100.01 affect WTI's price around $78.69 this week?
A strengthening DXY at 100.01 typically exerts downward pressure on commodities like WTI. If the dollar continues to rise, it could act as a headwind against WTI's upward momentum, making it harder to break through resistance levels like $79.99 and potentially increasing the odds of a move towards support.
The WTI Crude Oil market, currently hovering around $78.69, is at a critical juncture. While short-term charts offer glimpses of bullish potential, the daily technicals and moderate trend strength suggest caution. The interplay between supply-side geopolitical risks and broader market sentiment creates a complex trading environment. For now, patience appears to be the most valuable asset. Waiting for a decisive break above the $79.99 resistance or a confirmed fall below the $77.32 support will provide a much clearer and higher-probability trading setup. Until then, managing risk and observing price action at these key levels is the prudent path forward. The market is providing signals, but it's up to the disciplined trader to wait for the confirmation that aligns with their strategy.
Track markets in real-time
AI-powered analysis, technical indicators and real-time price data.
Join Our Telegram Channel
Breaking market news, AI analysis and trading signals instantly.
Join Channel