

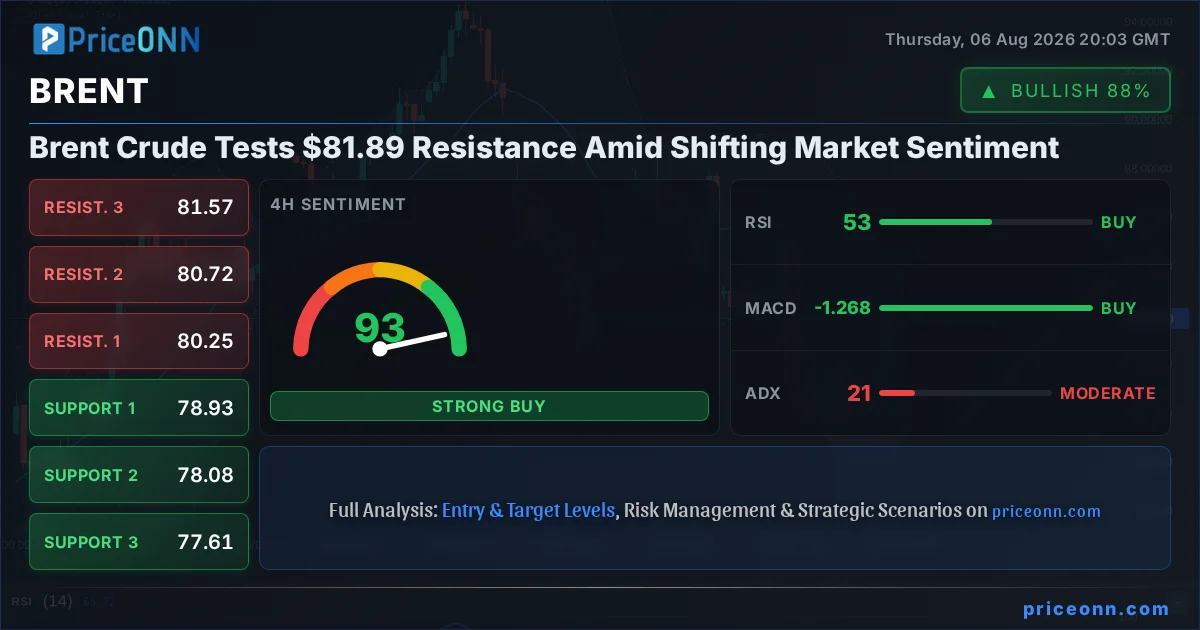
Brent Crude is currently trading at $81.89, a pivotal point where a significant battle between bulls and bears is unfolding. After a notable surge on August 6th, pushing prices from the $78.09 low to the day's high of $82.35, the market now grapples with resistance levels that have historically dictated short-term price direction. This critical juncture demands a close examination of the underlying technicals and the broader market context to decipher the next likely move.
- Brent Crude is trading at $81.89, testing immediate resistance after a strong intraday rally.
- The 1-hour chart shows bullish momentum (RSI 69.36), but the 1-day view presents a neutral trend with ADX at 22.43 suggesting a lack of strong directional conviction.
- Immediate resistance is at $81.96, with key levels at $82.35 (daily high) and $82.66 (1D resistance).
- Immediate support is at $81.63, with further levels at $81.30 (1H support) and $80.97 (1H support).
- Geopolitical tensions in the Strait of Hormuz remain a backdrop, influencing oil prices, though market optimism awaits confirmation.
Navigating the $81.89 Crossroads: A Technical Deep Dive
The intraday chart for Brent Crude paints a picture of bullish conviction, with an RSI (14) at 69.36 signaling strong upward momentum. The MACD is also in positive territory, with the histogram above the signal line, reinforcing the idea that buyers were in control during the early part of the session. Stochastic indicators, though entering overbought territory (K=85.61, D=88.26), are still showing a slight upward bias before a potential crossover. However, this bullish narrative is significantly tempered when we zoom out. The ADX at 30.14 on the 1-hour chart indicates a strong uptrend, but it's crucial to note the divergence emerging across timeframes. This internal conflict suggests that while the intraday move was potent, the broader market structure might not fully support a sustained breakout above the current resistance.
The 4-hour timeframe offers a more balanced perspective. Here, the RSI sits at a neutral 52.77, indicating that the market is not yet overheated, allowing room for further upward movement if the price can decisively break through the immediate resistance. The MACD remains positive, and the Stochastic oscillator (K=78.4, D=38.51) has just crossed bullishly, reinforcing the potential for upside. The ADX at 23.28 suggests a moderately strong trend, but it lacks the conviction seen on the hourly chart. This middle ground highlights the importance of the $81.89 to $82.35 zone. A sustained hold above this area could pave the way for further gains, but a rejection here could see prices retreat to the mid-70s.
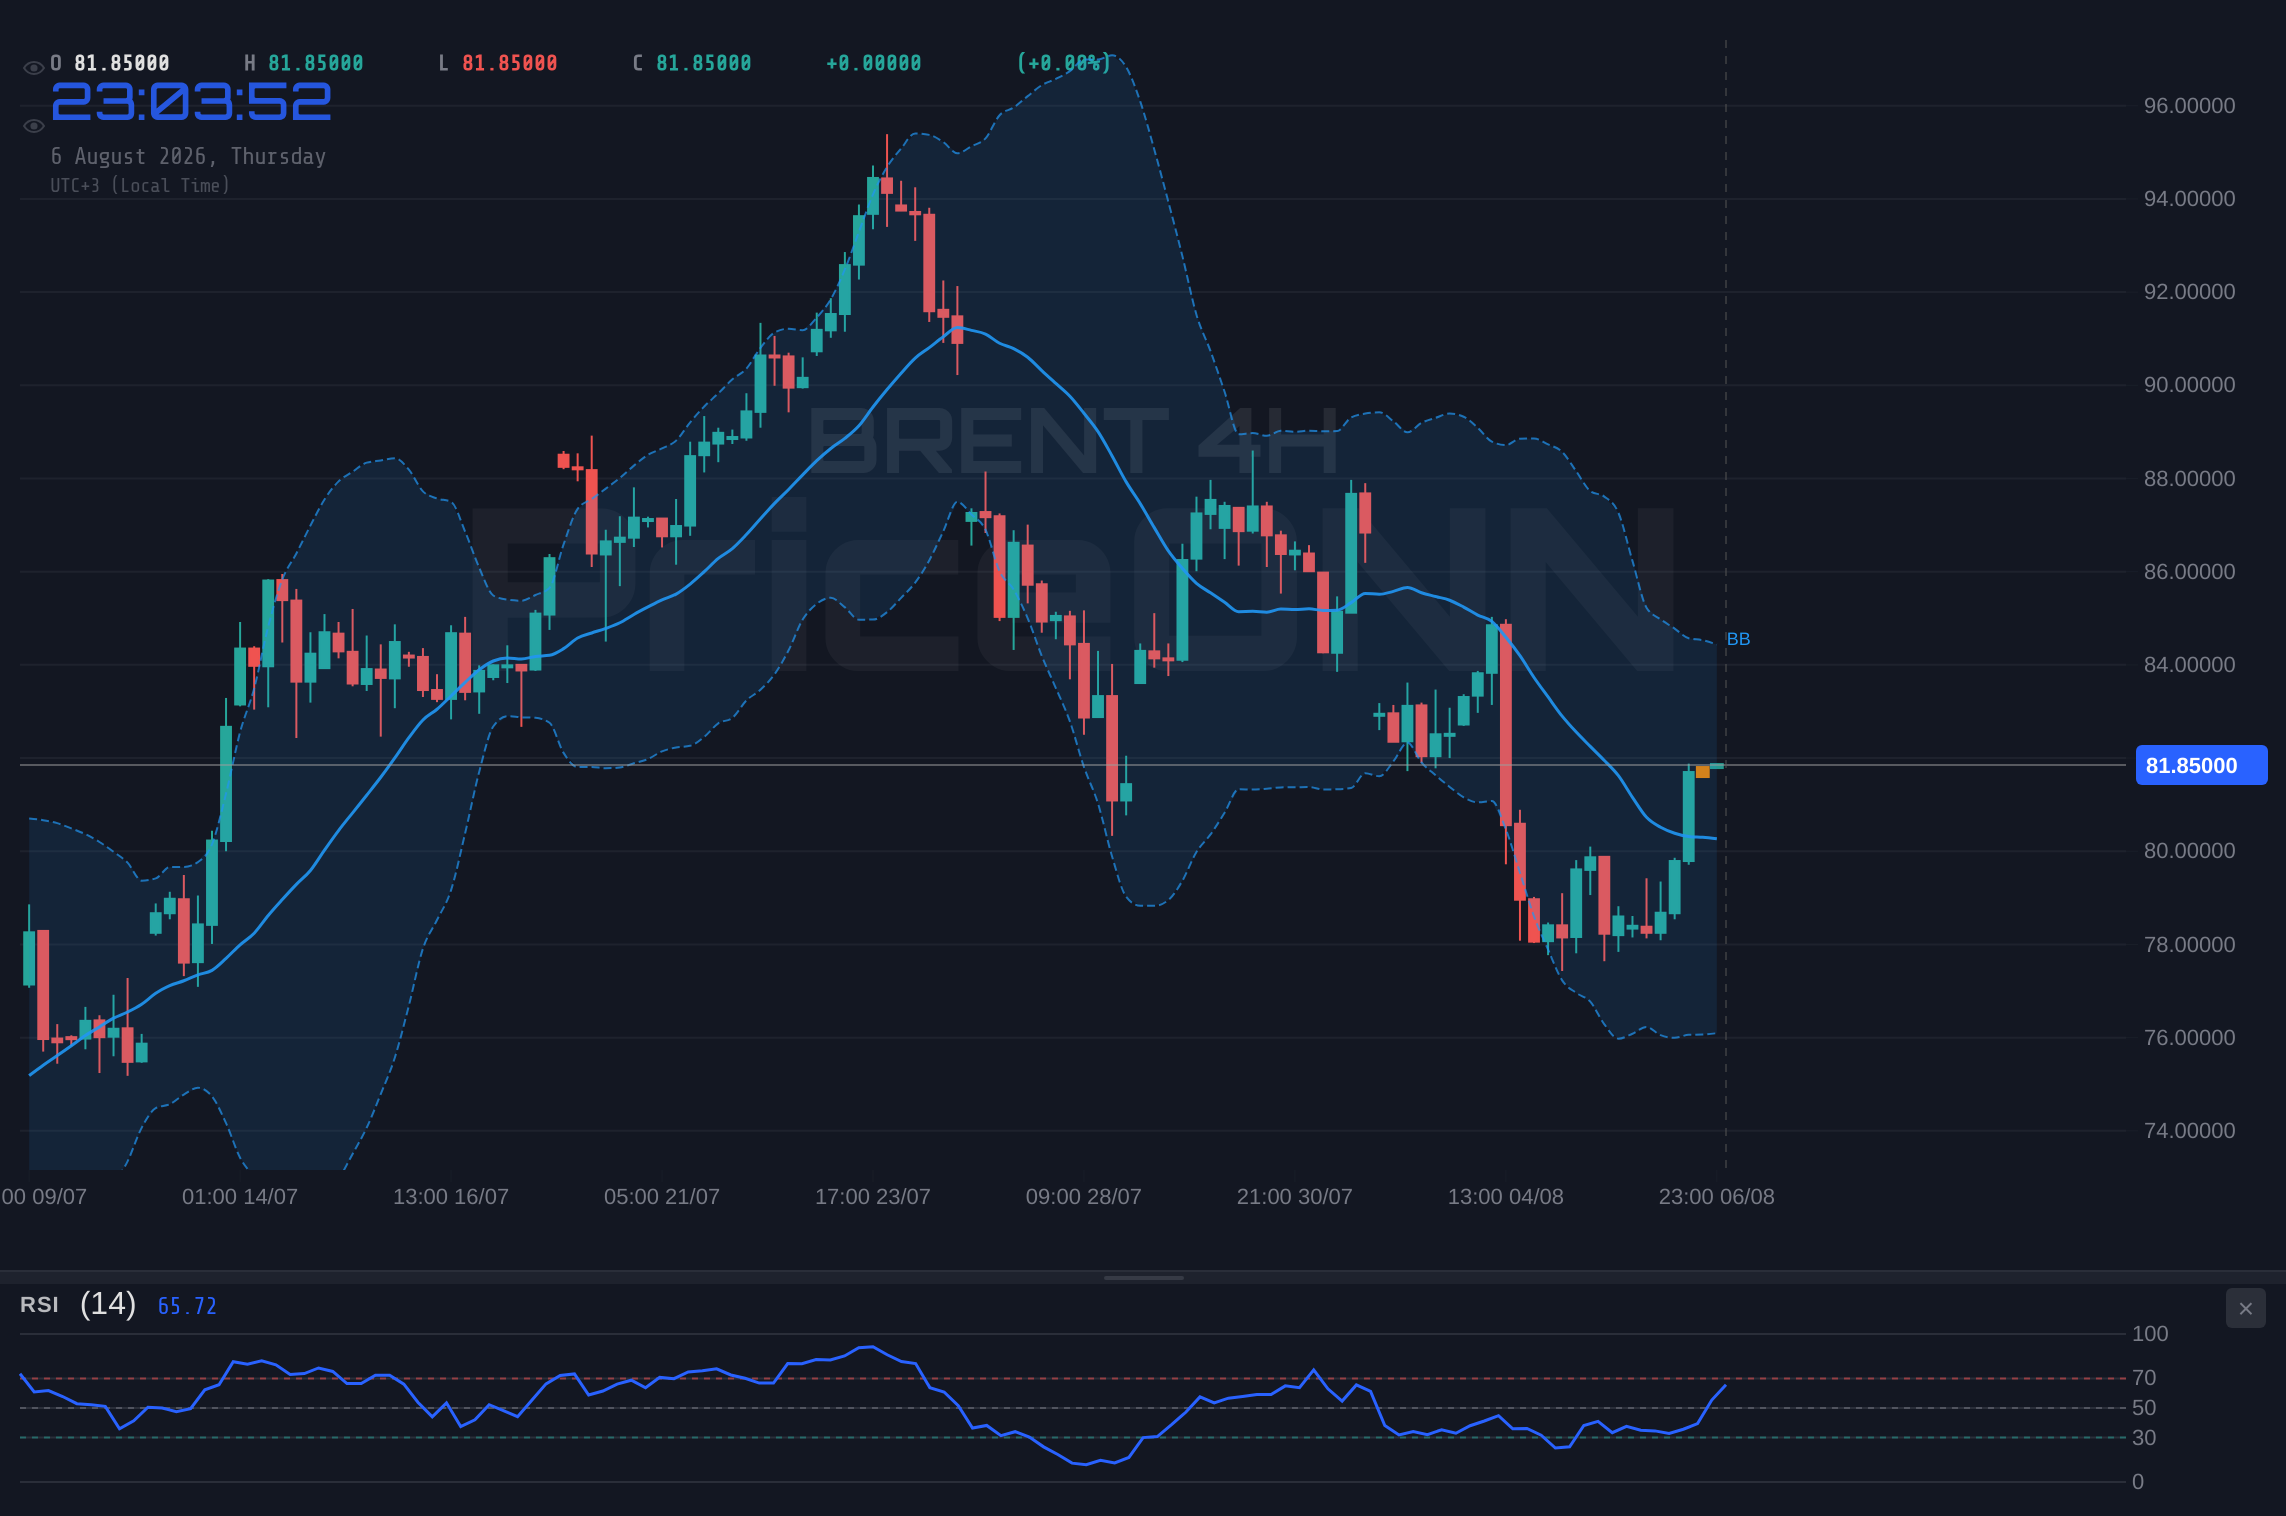
However, the daily chart presents the most cautionary signal. The RSI (14) at 47.32 is in neutral territory but shows a downward eğilim, suggesting that the recent rally might be losing steam at a critical juncture. The MACD is currently in negative momentum, below its signal line, a bearish sign that contradicts the intraday bullishness. Furthermore, the Bollinger Bands are contracting below the middle band, indicating a potential bearish bias or consolidation phase. The ADX at 22.43, while indicating a trend, lacks significant strength, making it susceptible to reversals. This daily perspective suggests that the recent price action might be more of a technical bounce within a larger potential downtrend or consolidation rather than the start of a sustained bull run. The Stochastic, with K=15.67 and D=26.86, is deeply oversold, hinting at a potential short-term bounce, but this alone is not enough to confirm a strong bullish reversal without further confluence.
The $81.89 Line in the Sand: Mapping the Scenarios
The current price action around $81.89 is a classic example of market indecision, where conflicting signals across different timeframes create a complex trading environment. For traders, understanding the potential pathways is paramount. We need to consider what conditions would validate a bullish continuation, what would signal a bearish reversal, and what might keep Brent Crude locked in a sideways range.
Bearish Reversal: Bears Pressing the Advantage
60% ProbabilityConsolidation Range: The Waiting Game
25% ProbabilityBullish Breakout: Momentum Carries Through
15% ProbabilityThe prevailing technical signals, particularly the divergence between intraday strength and the daily chart's bearish undertones, suggest that the bears have a higher probability of dictating terms in the short to medium term. The ADX on the daily chart, though not overwhelmingly strong at 22.43, still indicates a directional bias that is not strongly bullish. The negative MACD momentum on the daily timeframe is a significant headwind for any sustained rally. While the 1-hour and 4-hour charts show bullish potential, they are often subject to pullbacks if the broader daily trend doesn't confirm. Therefore, the scenario favoring a bearish move or at least a period of consolidation seems most likely. The market's reaction to the immediate resistance zone around $81.96 will be the key determinant.
The Geopolitical Undercurrent: Hormuz and Market Hopes
While technicals provide the roadmap, fundamental drivers often provide the fuel for significant price moves. The ongoing situation in the Strait of Hormuz, as reported by ForexLive, has been a background concern for oil markets. Initial optimism surrounding a potential de-escalation or breakthrough in the crisis seemed to stall gains across various markets, including oil, as concrete proof was awaited. This highlights the delicate balance: while geopolitical tensions typically support oil prices by threatening supply disruptions, any perceived easing can lead to profit-taking, especially if other market factors are less supportive. India's continued buying spree of West African crude, as noted by Reuters, also indicates a diversification of supply routes, potentially mitigating the immediate impact of Middle East disruptions but also showing continued demand. The market is thus caught between the immediate supply risk and the hope for resolution, creating a volatile environment where news flow can rapidly shift sentiment.
The correlation with the US Dollar Index (DXY) is also a critical factor. With the DXY currently trading around 99.97 and showing a mixed trend across timeframes (bullish on 1H, neutral on 4H, bearish on 1D), its influence on Brent Crude is complex. A strengthening dollar typically puts downward pressure on dollar-denominated commodities like oil, as they become more expensive for holders of other currencies. Conversely, a weakening dollar can provide a tailwind for oil prices. The DXY's current indecision mirrors the uncertainty in Brent, suggesting that currency markets are also at a crossroads. Traders must closely monitor how the DXY behaves around its key levels, as this will significantly impact the risk appetite for commodities.
Furthermore, the performance of major equity indices like the S&P 500 and Nasdaq 100 cannot be ignored. The S&P 500 is showing a bullish trend on the 1-hour and 4-hour charts but a bearish trend on the daily, closing at 6572.87 with a daily gain. The Nasdaq 100, however, shows a bearish trend on the 1-hour and mixed signals elsewhere. This divergence in equity markets reflects a broader uncertainty about economic growth prospects. A sustained risk-off environment, characterized by falling equity markets, would typically dampen demand for oil and put downward pressure on Brent prices. Conversely, a strong risk-on sentiment could boost oil demand and prices. The current mixed signals from equities add another layer of complexity to the Brent outlook.
What I'm Watching This Week: Key Triggers for Brent Crude
To navigate this complex market, focusing on specific triggers is essential. The immediate price action around the $81.89 to $82.35 resistance zone is the most critical short-term focus. A failure to break decisively above $82.35, especially on lower volume or with increasing bearish divergence on intraday charts, would strongly favor the bearish scenario. Conversely, a surge in volume and a sustained hold above $82.35 could open the door for further upside, targeting the $82.66 daily resistance.
Beyond the price action itself, keeping an eye on the geopolitical narrative surrounding the Strait of Hormuz is crucial. Any concrete news that either escalates or de-escalates the situation could trigger significant price swings. Similarly, the performance of the DXY and major equity indices will provide essential clues about overall market sentiment and risk appetite. If the DXY shows renewed strength, particularly around its 1D bearish trend confirmation levels, it would likely weigh on Brent. A sharp sell-off in the S&P 500 or Nasdaq 100 would also signal a risk-off environment, potentially leading to a pullback in oil prices.
Finally, a deeper look at the technical indicators across multiple timeframes is warranted. The conflicting signals between the hourly bullishness and the daily bearish undertones (particularly MACD and RSI on the daily chart) suggest that the current price level is a critical decision point. The ADX values also reflect this ambiguity, with strong intraday trends but weaker broader directional conviction. Traders should be looking for confirmation: either a sustained move above the daily resistance levels with increasing volume and positive daily MACD/RSI development, or a clear breakdown below the 1-hour support levels, confirmed by daily chart deterioration.
Frequently Asked Questions: Brent Crude Analysis
What happens if Brent Crude breaks decisively above $82.35 resistance?
A sustained break above $82.35, especially with increased volume, would invalidate the immediate bearish outlook and likely target the next daily resistance at $82.66. This could open the door for a move towards the psychological $83.00 level, indicating a stronger bullish sentiment taking hold.
Should I consider buying Brent Crude at current levels around $81.89 given the mixed signals?
Given the conflicting signals between intraday bullishness and daily bearish undertones, caution is advised. A bullish entry would ideally require confirmation of a breakout above $81.96 with strong volume, or a clear bounce from support levels like $81.30. Risk management is paramount here.
Is the RSI at 69.36 on the 1-hour chart a sell signal for Brent Crude?
An RSI of 69.36 on the 1-hour chart indicates strong bullish momentum but is not yet in extreme overbought territory (typically considered above 70-75). While it suggests the intraday rally is strong, it also warns that a pullback or consolidation is possible before any further sustained move, especially considering the daily chart's neutral-to-bearish lean.
How will the ongoing Hormuz situation affect Brent Crude prices this week?
The Hormuz situation remains a key geopolitical risk factor for oil prices. Any escalation could provide a strong tailwind for Brent, pushing prices towards higher resistance levels. Conversely, any signs of de-escalation or resolution, without confirmation from other market drivers, might lead to profit-taking and a temporary dip in prices.
| Indicator | Value | Signal | Interpretation |
|---|---|---|---|
| RSI (14) | 47.32 | Bearish lean | Daily chart RSI shows waning momentum. |
| MACD Histogram | [Negative value] | Bearish | Daily MACD below signal line, indicating negative momentum. |
| Stochastic | K=15.67, D=26.86 | Bullish Crossover | Deeply oversold on daily, suggesting short-term bounce potential. |
| ADX | 22.43 | Neutral Strength | Daily trend strength is moderate, lacking strong conviction. |
| Bollinger | Middle Band | Watch | Price currently below middle band on daily, indicating potential bearish bias. |
Track markets in real-time
AI-powered analysis, technical indicators and real-time price data.
Join Our Telegram Channel
Breaking market news, AI analysis and trading signals instantly.
Join Channel