

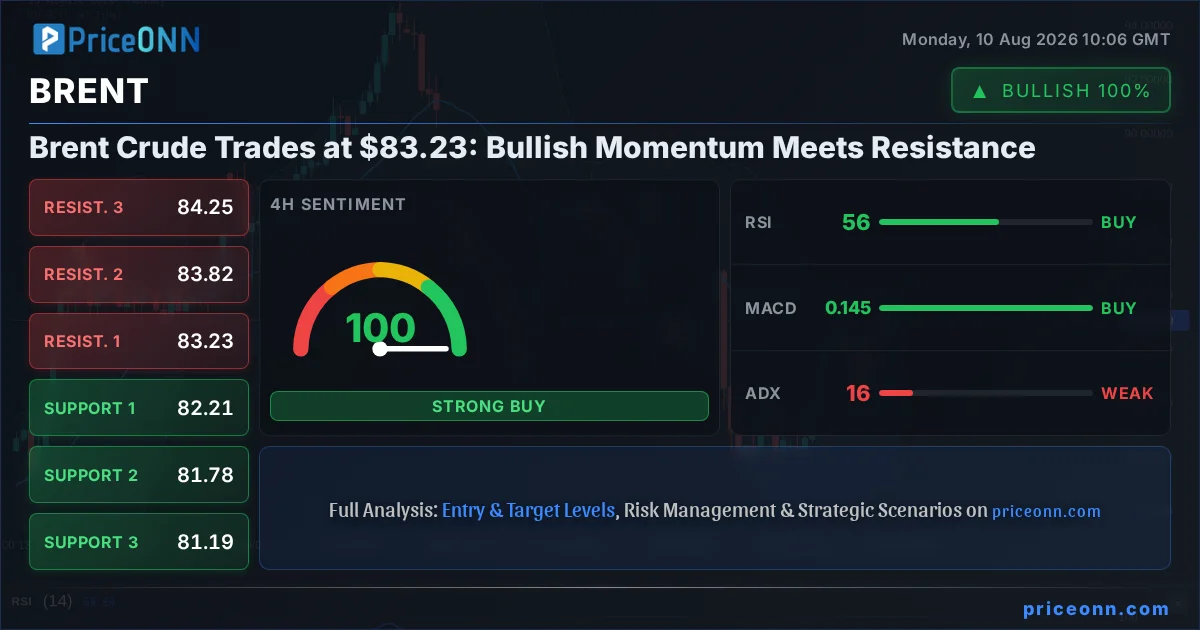
The energy markets are at a critical juncture as Brent Crude hovers around the $83.23 mark. For weeks, traders have been locked in a tug-of-war, with bulls attempting to push prices higher against persistent resistance, while bears defend key levels. This ongoing battle is creating a fascinating technical picture, demanding a close look at multiple timeframes and indicators to decipher the next likely move. Having tracked Brent through its recent volatility, it's clear that while short-term signals are mixed, the underlying trend on longer timeframes suggests underlying strength that could eventually break through current barriers. The question on everyone's mind is whether the current momentum has enough fuel to overcome the overhead supply.
- Brent Crude is trading at $83.23, showing a slight daily decline of 0.02% but strong upward momentum on longer timeframes.
- Key resistance is identified at $83.72 on the 1H chart and $84.25 on the 4H chart, with the daily resistance sitting at $85.33.
- Support levels are holding firm, with the 1H chart showing $82.67, 4H at $82.21, and daily at $80.11.
- Technical indicators present a nuanced view: RSI is in neutral territory across timeframes, while MACD shows positive momentum on higher timeframes, though it's negative on the 1H.
- The ADX reading suggests a weak trend on the 1H and 4H (19.31 and 16.22 respectively), indicating choppiness, but the daily ADX at 19.74 also points to a lack of strong conviction.
The current market sentiment for Brent Crude is a complex interplay of short-term caution and longer-term bullish undercurrents. On the 1-hour chart, we observe a neutral trend with a power rating of 50%, indicating a market that is currently consolidating or waiting for a catalyst. The price is trading above the middle Bollinger Band, hinting at upward pressure, and the Stochastic oscillator (K=77.95, D=67.63) is flashing a bullish signal, suggesting potential for further gains. However, the MACD is showing negative momentum on this timeframe, operating below its signal line, which tempers the bullish outlook. The RSI at 61.11, while in neutral territory, leans towards the upper half, indicating that buyers are present but not yet in full control. This short-term indecision is further underscored by the ADX at 19.31, a reading that signifies a weak trend, implying that the current price action might be more range-bound than directional.
Delving into the 4-hour timeframe reveals a more optimistic picture for the bulls. The trend is neutral but with a higher power rating of 50%, suggesting that the market is building momentum. Brent is trading above the middle Bollinger Band, and the Stochastic oscillator (K=85.47, D=74.76) is firmly in bullish territory, indicating strong buying interest. The MACD is also showing positive momentum, trading above its signal line. While the RSI at 56.11 remains in neutral territory, it leans towards the upper end, supporting the bullish inclination. However, the ADX at 16.22 continues to signal a weak trend, reinforcing the idea that despite positive indicators, the market lacks strong directional conviction. This suggests that while the path of least resistance might be upwards, significant resistance levels could cap immediate gains.
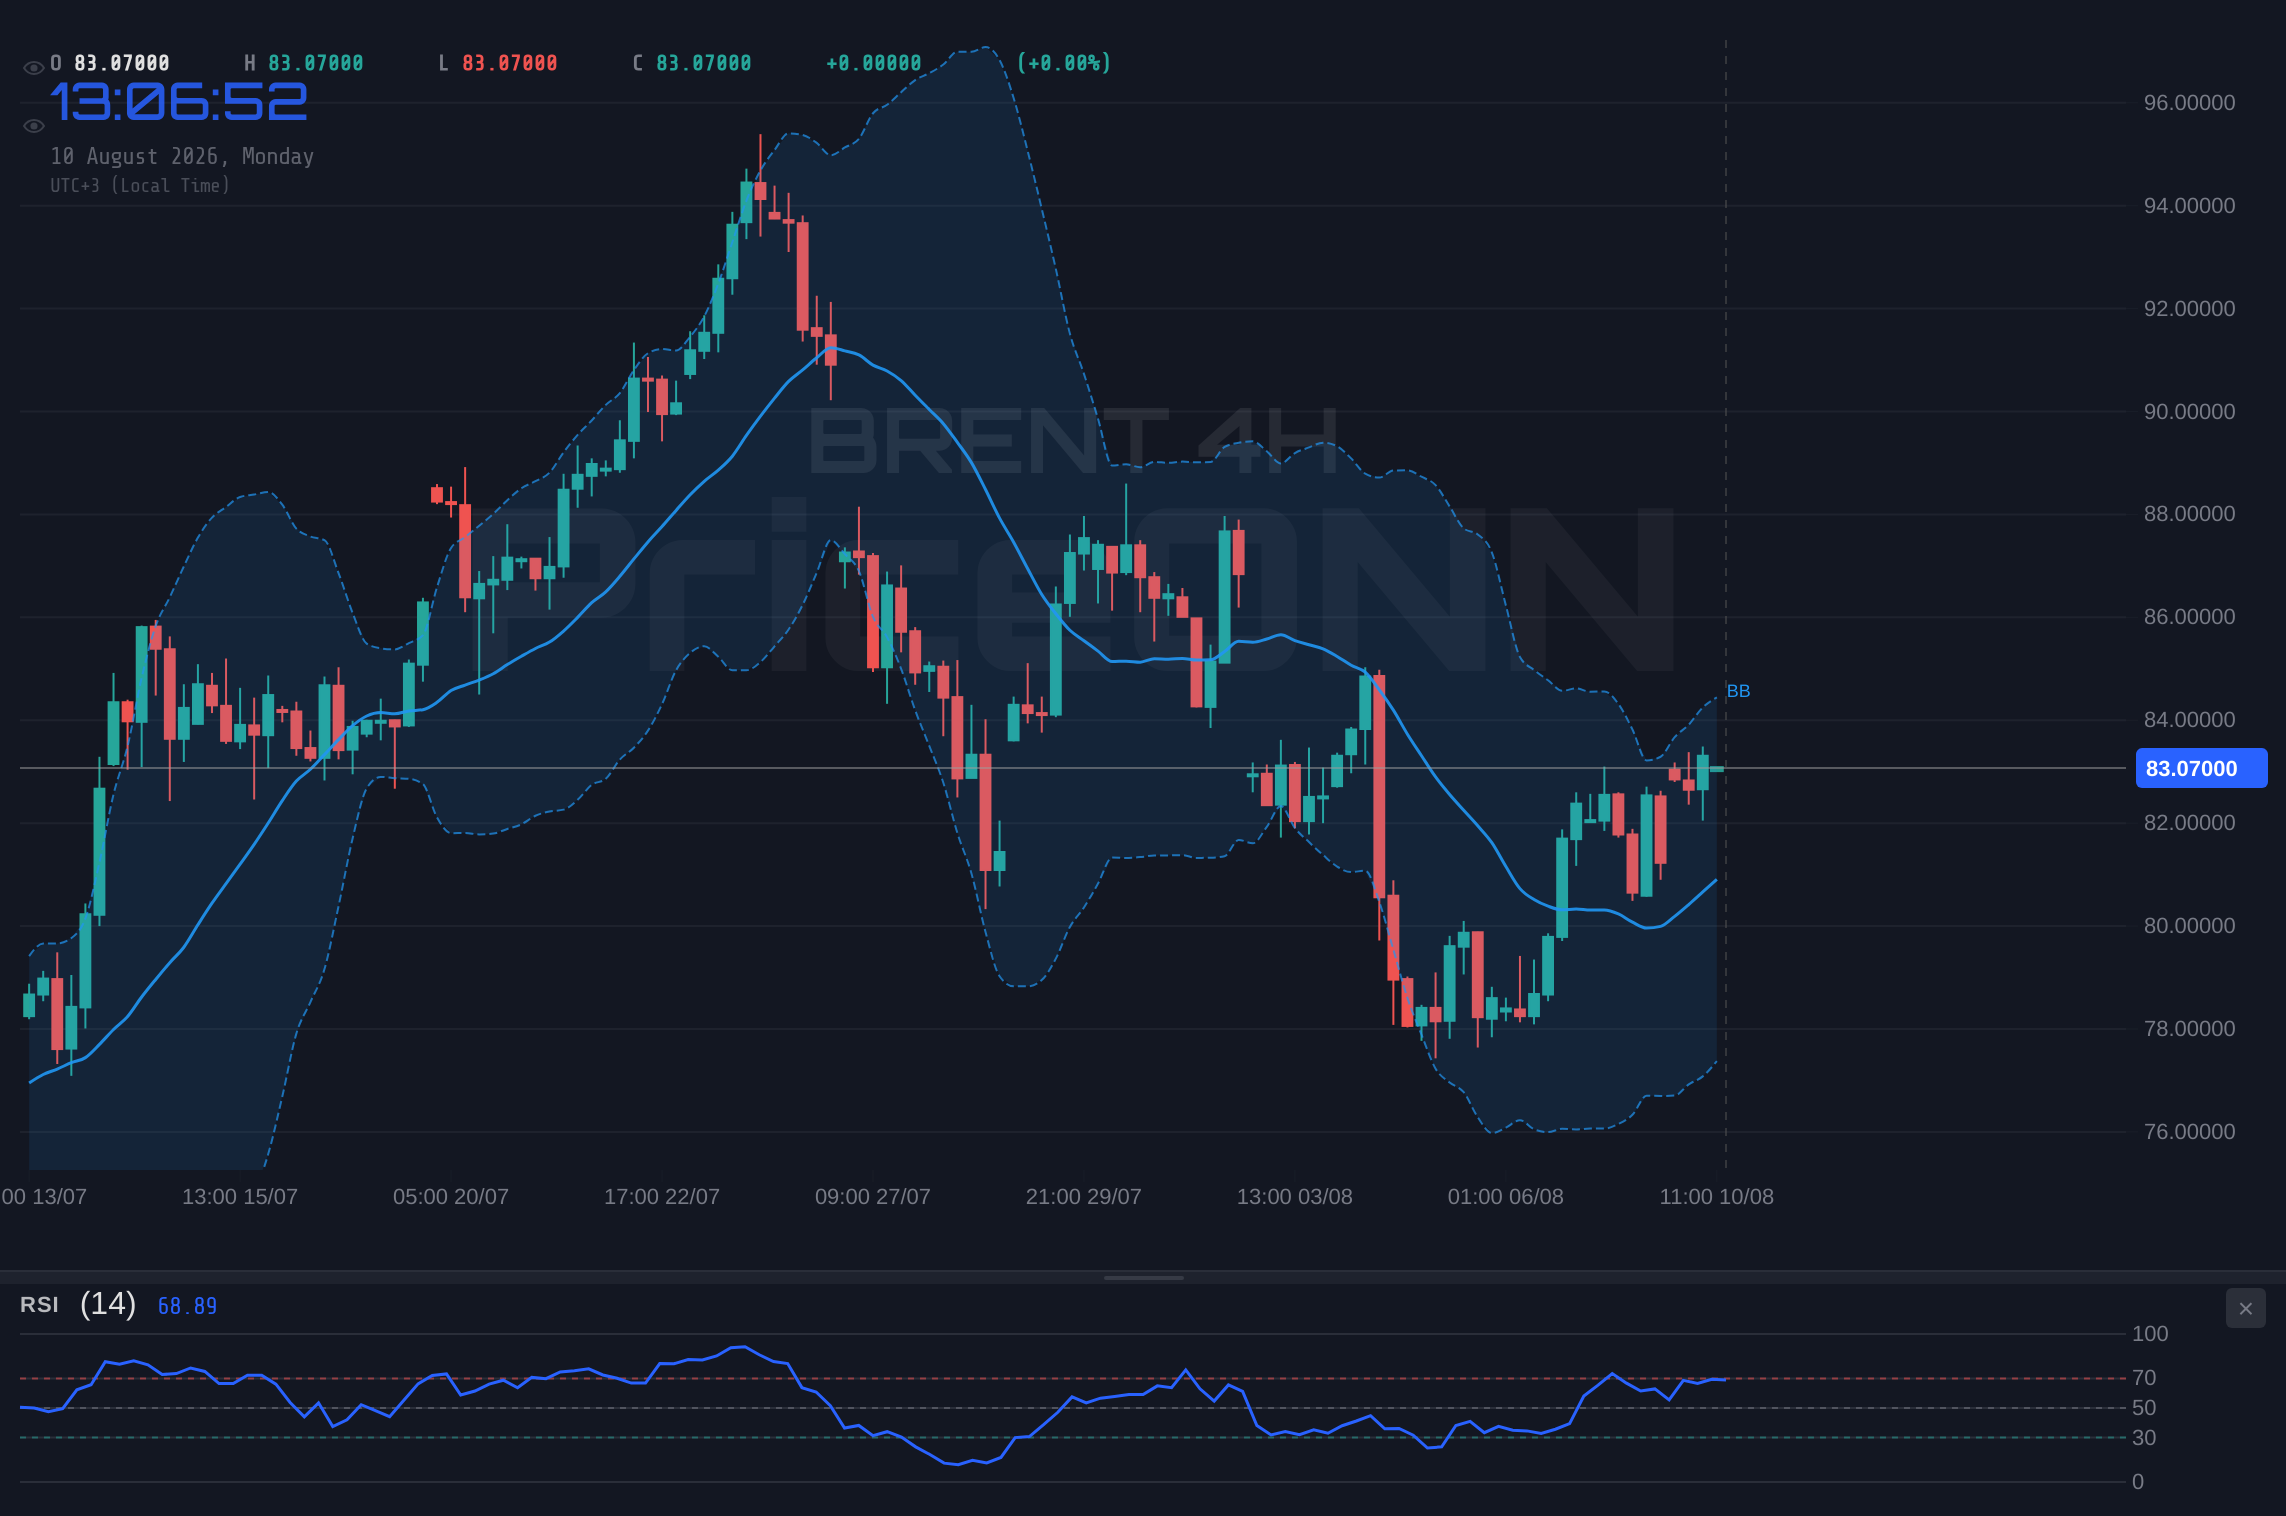
The daily chart paints a different story, one that requires careful interpretation. Here, the trend is classified as bullish with a power rating of 90%, indicating that the longer-term trajectory remains favorable for buyers. The price is trading below the middle Bollinger Band, which might seem contradictory, but this can also indicate a consolidation phase before a breakout. The Stochastic oscillator (K=43.4, D=25.85) is showing a bullish signal, having crossed upwards from oversold territory, suggesting potential for a reversal or continuation of an uptrend. Crucially, the MACD is exhibiting negative momentum, operating below its signal line, which is a bearish counter-signal on this timeframe. The RSI at 49.39 is in neutral territory, leaning slightly bearish. The ADX at 19.74 reinforces the notion of a weak trend, suggesting that the significant daily resistance levels are formidable.
The interplay between these timeframes highlights a market at a crossroads. While the daily chart provides a bullish backdrop, the short-term 1-hour and 4-hour charts show indecision and potential headwinds. The current price of $83.23 sits just below the 1-hour resistance of $83.72 and the 4-hour resistance of $83.23 (note: the current price is exactly at the 4H resistance). This confluence of resistance levels is a significant hurdle for the bulls. If Brent cannot decisively break above $83.72, we could see a pullback towards the 1-hour support at $82.67, or even lower towards the 4-hour support at $82.21. The weak ADX readings across all timeframes exacerbate this uncertainty, suggesting that any breakout might be followed by a sharp reversal if it lacks conviction.
The broader market context, including the Dollar Index (DXY) and equity markets, also plays a crucial role. The DXY is currently trading at 99.72, showing a 0.17% daily increase. A strengthening dollar typically exerts downward pressure on oil prices, as commodities priced in dollars become more expensive for holders of other currencies. The SP500 is trading at 6572.87, up 0.74% on the day, indicating a positive risk appetite. This generally supports commodity prices, creating a mixed signal. However, the recent news of weak Non-Farm Payroll (NFP) data, which flipped Fed rate cut odds, could introduce further volatility. While a weaker NFP might typically weaken the dollar, the market's reaction is complex, and the continued strength of the dollar index at 99.72 is a key factor to monitor for Brent's trajectory.
From a fundamental perspective, the energy market remains sensitive to geopolitical developments. While specific geopolitical events are not detailed in the provided data, the general context of potential supply disruptions, particularly concerning the Strait of Hormuz as hinted in the news, can create underlying support for oil prices. News reports indicate that U.S. energy production has helped cushion global supply shocks, suggesting a degree of stability, but the market remains susceptible to sudden shifts. The recent surge in Brent and WTI prices, up 2.46% and 2.29% respectively, indicates that the market is currently pricing in bullish factors, possibly related to supply concerns or robust demand expectations, despite the mixed technical signals on shorter timeframes.
The bullish case hinges on the strength observed in the longer daily timeframe and the potential for a breakout above current resistance levels. If Brent can decisively close above the 1-hour resistance at $83.72 and subsequently challenge the 4-hour resistance at $84.25, we could see a strong upward move. The daily chart's bullish trend (90% power) and the positive MACD momentum on the 4H chart provide a foundation for this scenario. Furthermore, if the dollar index were to weaken significantly from its current 99.72 level, it would remove a key headwind for oil prices. A sustained break above these resistance levels, supported by increasing volume and positive news flow, could pave the way for a test of the daily resistance at $85.33.
Conversely, the bearish case is supported by the immediate resistance levels and the mixed signals on shorter timeframes. The ADX readings across all timeframes (1H: 19.31, 4H: 16.22, 1D: 19.74) point towards a weak trend, suggesting that the current upward move may lack conviction and could easily falter. A failure to break above $83.72 on the 1H chart could lead to a decline towards the support at $82.67. If this level breaks, the next target would be the 4-hour support at $82.21. The negative MACD momentum on the 1-hour chart and the slightly bearish lean of the daily RSI at 49.39 also add weight to the bearish argument. Moreover, any significant strengthening of the DXY from 99.72 could put additional pressure on Brent.
The neutral scenario anticipates a period of consolidation or range-bound trading as bulls and bears fight for control around the current price of $83.23. Given the weak ADX readings, this scenario is highly plausible. The market might oscillate between the immediate support at $82.67 and resistance at $83.72 on the 1-hour chart for some time. This indecision could persist until a clearer fundamental catalyst emerges or until the technical indicators provide a more unified signal. During such periods, traders often look for confirmation on higher timeframes before committing to a directional trade. The lack of strong trend strength suggests that volatility might increase within a defined range rather than a sustained directional move.
Considering the data, the current setup for Brent Crude presents a 'Watch Zone' scenario. The ADX values across all timeframes are below 20, indicating a lack of a strong trend and suggesting that trading within this range carries higher risk. However, the bullish signals on the Stochastic oscillator and the positive MACD on the 4-hour and daily charts hint at potential upside. The critical level to watch is the 1-hour resistance at $83.72. A decisive close above this level, particularly on the 4-hour chart, would be a strong indication that the bulls are gaining control and could initiate a move towards higher resistance levels. Until then, caution is advised, and risk management should be paramount.
The path forward for Brent Crude will likely be dictated by the interplay of these technical signals and any emerging fundamental catalysts. While the longer-term outlook remains cautiously optimistic due to the bullish daily trend, the immediate hurdles at $83.72 and $84.25 cannot be ignored. Traders should remain vigilant, monitoring for a confirmed breakout above these levels, supported by increasing volume and stronger trend indicators. Conversely, a failure to overcome this resistance could lead to a retest of support levels, offering a different trading opportunity. The market's ability to digest these levels will ultimately shape the trajectory in the coming days.
Looking ahead, the economic calendar and geopolitical landscape will be key drivers. Any news impacting global oil supply, such as OPEC+ decisions or heightened tensions in oil-producing regions, could significantly influence Brent's price. Furthermore, shifts in central bank policies, particularly regarding interest rates which affect the DXY and overall market risk appetite, will be closely watched. For now, the $83.23 level represents a critical battleground where the bulls and bears are testing each other's resolve, and a clear directional bias is yet to be firmly established.
The analysis of Brent Crude at $83.23 reveals a market poised between short-term consolidation and a longer-term bullish undertone. While the daily trend remains favorable, immediate resistance levels present a challenge. The weak trend indicated by ADX across multiple timeframes suggests caution, but the bullish signals from Stochastic and MACD on higher timeframes warrant attention. The crucial factor will be a decisive break above the $83.72 resistance. Until then, expect continued choppiness, but keep an eye on the upside potential if key levels are conquered.
For traders, patience is key. Waiting for a confirmed breakout above the $83.72 resistance, ideally with increasing volume and a stronger ADX reading, would provide a higher probability setup. Alternatively, a clear breakdown below the $82.67 support could signal a short-term bearish move. Risk management remains paramount in this environment, especially given the weak trend signals. Always ensure your stop-loss orders are appropriately placed to protect against sudden market reversals.
The current technical setup for Brent Crude at $83.23 is characterized by a battle between short-term indecision and longer-term bullish sentiment. While the daily chart shows a strong upward trend, immediate resistance at $83.72 and $84.25 poses a significant challenge. The weak trend indicated by ADX readings across multiple timeframes suggests that any move higher may lack conviction until confirmed. Therefore, a 'Watch Zone' approach is recommended, focusing on a decisive breakout above resistance or a clear breakdown below support.
The market is at a critical juncture, with the $83.23 price point serving as a focal point for a tug-of-war between bullish momentum and bearish resistance. The technical indicators offer a mixed signal, with longer timeframes showing underlying strength while shorter timeframes exhibit indecision. A clear catalyst or a sustained break above key resistance levels will be needed to determine the next significant move in Brent Crude prices.
The key takeaway from this analysis is that while the long-term trend for Brent Crude remains bullish, the immediate path higher is fraught with resistance. The current price of $83.23 is a critical level where market participants are testing each other's resolve. Traders should be looking for a confirmed breakout above $83.72 as a signal for potential upside continuation, while also being prepared for a downside move if support at $82.67 fails.
The current price action around $83.23 suggests that Brent Crude is consolidating before a potential breakout. While the daily trend is bullish, the short-term charts show indecision. The market is waiting for a clear catalyst to break through resistance at $83.72 or support at $82.67. Traders should exercise caution and focus on risk management until a clearer trend emerges.
The energy market remains dynamic, and Brent Crude's current position around $83.23 is a testament to that. While the bulls have shown resilience, the overhead resistance is a formidable barrier. The coming days will be crucial in determining whether Brent can muster the strength to push higher or if it will retreat to consolidate further. Vigilance and disciplined trading will be key.
Frequently Asked Questions: BRENT Analysis
What happens if BRENT breaks above the $83.72 resistance level?
A confirmed close above $83.72, especially on the 4-hour chart with increasing volume, would likely trigger a bullish move towards the next resistance at $84.25 and potentially $85.33.
Should I buy BRENT at current levels of $83.23 given the mixed signals?
Caution is advised at current levels. The weak ADX readings suggest choppiness. A confirmed breakout above $83.72 offers a higher-probability bullish setup, while a break below $82.67 could signal a short opportunity.
Is the RSI at 61.11 a sell signal for BRENT right now?
An RSI of 61.11 on the 1-hour chart is in neutral territory, leaning towards bullish but not yet overbought. It suggests buyers are present but not dominant, indicating potential for further gains or consolidation rather than an immediate sell signal.
How will the strengthening DXY at 99.72 affect BRENT this week?
A strengthening DXY typically puts downward pressure on oil prices like Brent. However, the market is also influenced by supply concerns. Continued DXY strength could cap upside potential for Brent unless strong bullish supply-side news emerges.
Track markets in real-time
AI-powered analysis, technical indicators and real-time price data.
Join Our Telegram Channel
Breaking market news, AI analysis and trading signals instantly.
Join Channel