

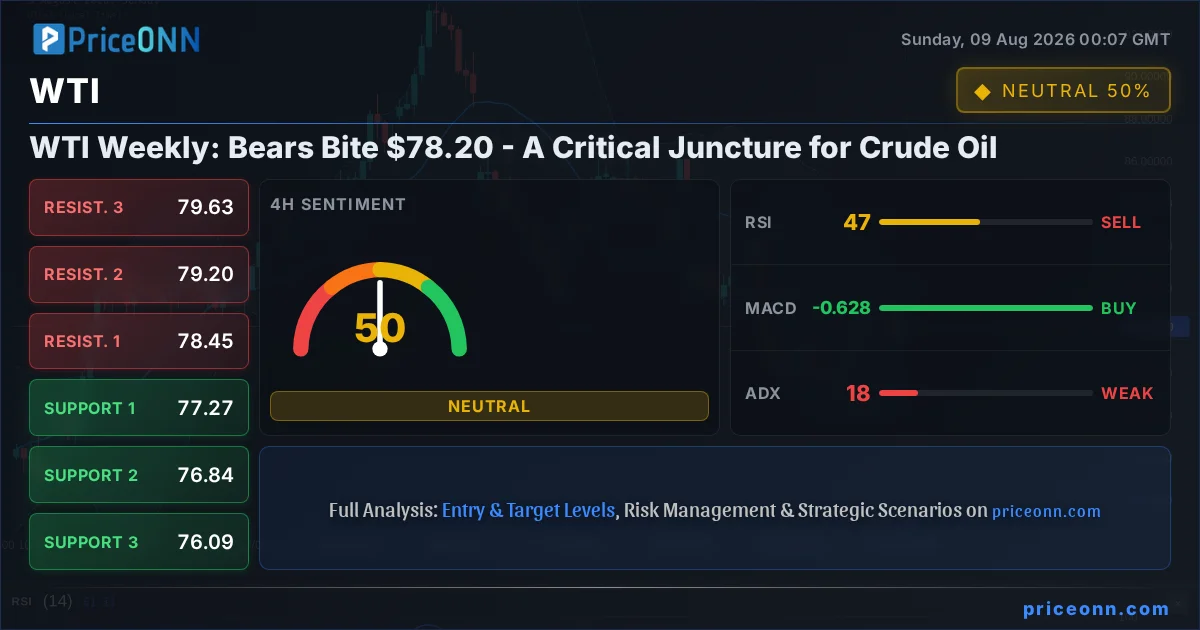
The past week saw WTI crude oil navigate choppy waters, ultimately closing near the critical $78.20 mark. This price point represents more than just a number; it's a battleground where recent bearish sentiment, fueled by a surprisingly weak US Non-Farm Payrolls (NFP) report, clashes with the underlying supply dynamics and geopolitical undercurrents that have supported crude prices for much of the year. As traders digest the implications of the unexpected job losses and their potential impact on Federal Reserve policy, the question on everyone's mind is whether $78.20 will hold as a support level, or if further downside awaits. This analysis delves into the technical signals, fundamental drivers, and the crucial economic events that will dictate WTI's trajectory in the coming week.
- WTI crude oil finished the week trading at $78.20, reflecting bearish pressure after a weak NFP report.
- Support at $76.71 is being watched closely; a break below could signal further declines.
- The ADX at 21.09 on the daily chart suggests a weakening trend, but a strong 91% daily trend strength for WTI indicates underlying upward potential if conditions change.
- Geopolitical risks and OPEC+ supply considerations remain key factors influencing crude prices, even amidst economic data concerns.
The dramatic shift in market sentiment following the July US Non-Farm Payrolls (NFP) report has undeniably cast a shadow over the crude oil market, with WTI futures closing the trading week at $78.20. The data, revealing an unexpected loss of 23,000 jobs against projections of an 83,000 gain, sent shockwaves through financial markets. This stark contrast between expectation and reality immediately recalibrated expectations for Federal Reserve monetary policy, with rate-hike odds for the September meeting plummeting. For commodities like WTI, which are sensitive to both economic growth prospects and interest rate environments, this data presents a complex picture. A weaker economy typically implies lower demand for energy, while a Fed perceived as less likely to hike rates could, in theory, support risk assets. However, the immediate reaction saw WTI dip, highlighting the dominant concern over demand destruction in the short term.
This recent price action is particularly noteworthy given the backdrop of sustained geopolitical tensions and the strategic decisions made by OPEC+. For months, the market has been grappling with supply constraints, primarily driven by production cuts from major oil-exporting nations. These factors have provided a floor under crude prices, often counteracting concerns about global economic slowdowns. The NFP report, however, has introduced a fresh layer of uncertainty. The implied slowdown in the US economy, the world's largest consumer of oil, directly challenges the demand-side narrative. Traders are now weighing whether the impact of reduced economic activity will outweigh the persistent supply tightness, creating a tug-of-war that is likely to define price action in the immediate future. The $78.20 level, therefore, becomes a crucial psychological and technical marker.
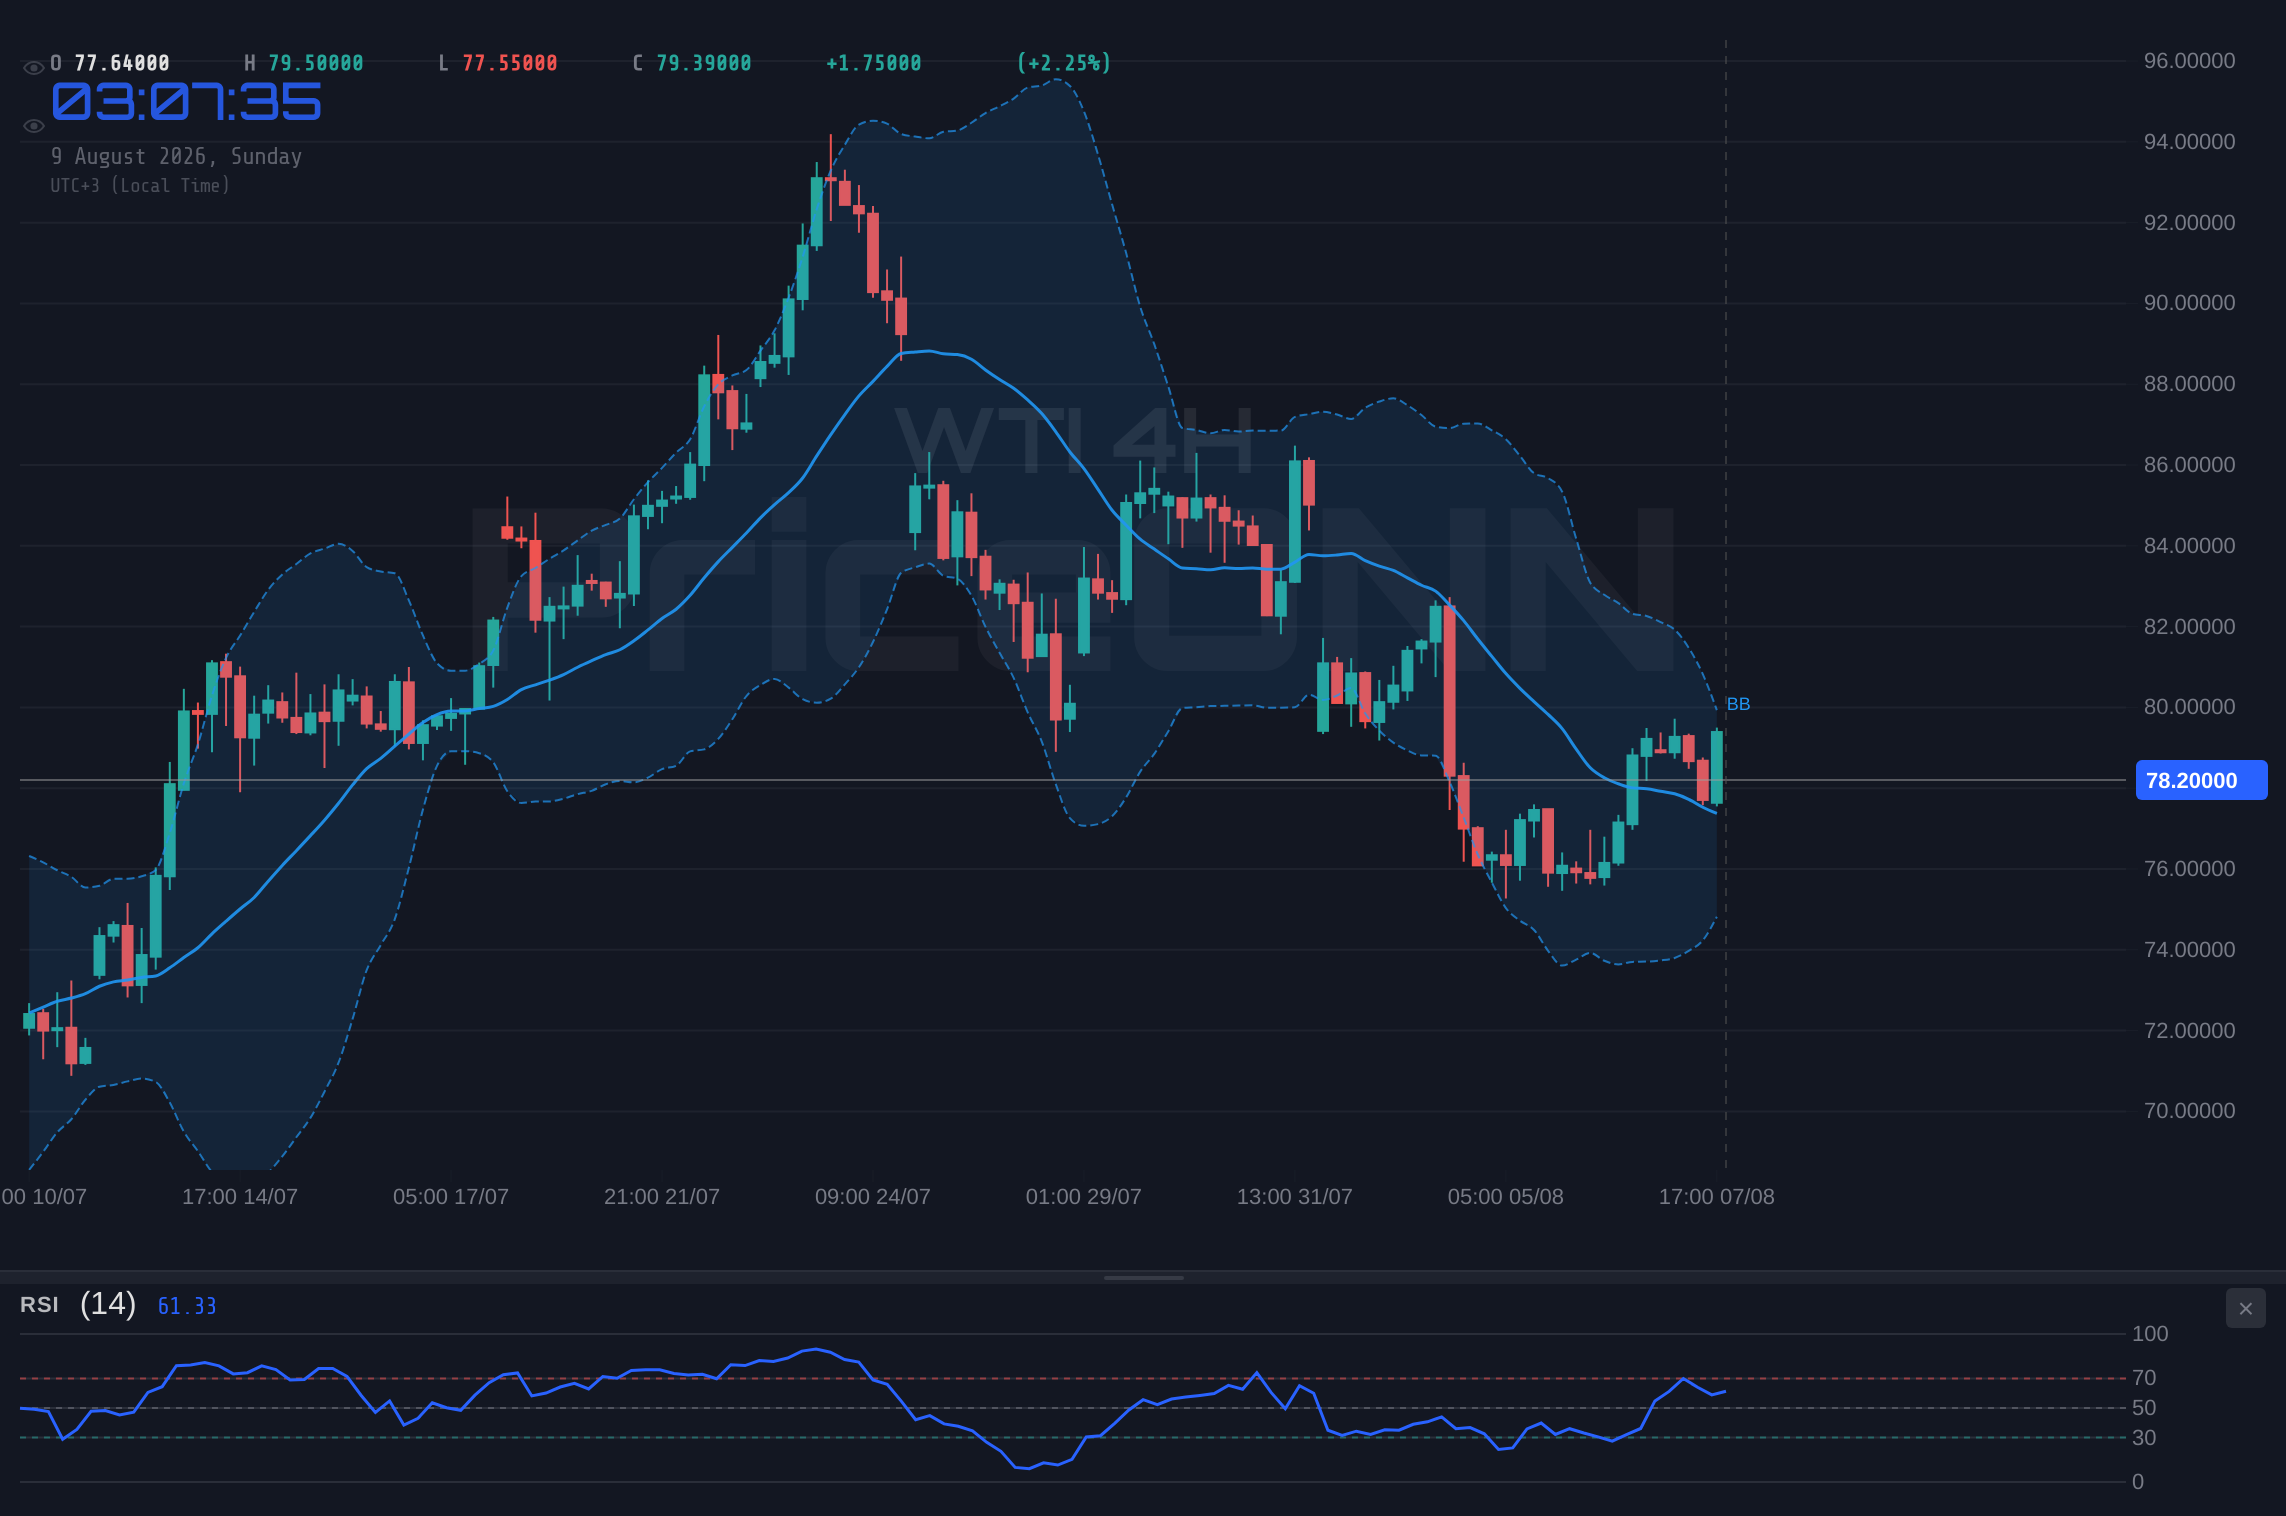
Navigating the Technical Landscape: WTI's Chart Tells a Tale
Examining the technical indicators for WTI reveals a market at a potential inflection point. On the 1-hour timeframe, the Relative Strength Index (RSI) sits at 46.57, indicating a slight bearish lean and suggesting that momentum is currently favoring sellers. This is further echoed by the MACD, which shows negative momentum with the MACD line below its signal line, painting a picture of downward pressure in the very short term. The Stochastic Oscillator, with %K at 66.34 and %D at 76.92, also signals a bearish crossover, reinforcing the idea of potential further losses in the intraday trading. The Average Directional Index (ADX) at 29.61 points to a strong downtrend on this timeframe, suggesting that any counter-trend moves might be short-lived if the bearish momentum continues.
However, a broader perspective from the 4-hour and daily charts paints a more nuanced, and perhaps more telling, story. The 4-hour chart shows the ADX at 17.5, a reading that signifies a weak trend. This suggests that the current downward move might be part of a larger consolidation rather than a definitive trend change. While the 1-hour chart leans bearish, the 4-hour chart's MACD is showing positive momentum, with the MACD line above its signal line, and Bollinger Bands are above the middle band, indicating a potential for upward movement. This divergence between the short-term and medium-term technicals highlights the indecision in the market. The Stochastic on the 4-hour chart is also in a bearish crossover (%K: 63.04, %D: 81.4), but its position suggests it's moving away from overbought territory, not necessarily initiating a strong sell-off.
The daily timeframe offers the most compelling insight into WTI's underlying strength, despite the recent bearish price action. The daily trend strength is remarkably high at 91%, suggesting that underlying bullish forces remain potent, even if short-term momentum has faltered. The ADX on the daily chart is 21.09, indicating a moderately strong trend, which, when combined with the high trend strength, implies that the recent dip might be a retracement within a larger upward move. The RSI(14) at 46.22 is in neutral territory, showing room for both upside and downside, but the MACD is displaying negative momentum, and the Stochastic Oscillator (%K: 21.95, %D: 22.44) is in oversold territory with a bullish crossover forming. This mixed signal environment, particularly the strong daily trend strength, suggests that the bearish sentiment from the NFP report might not be enough to completely derail the longer-term bullish outlook, provided key support levels hold.
The Economic Data Conundrum: NFP's Ripple Effect
The July US Non-Farm Payrolls report was undeniably the economic headline of the week, and its implications for WTI are multifaceted. The unexpected contraction of 23,000 jobs, a significant miss from the projected 83,000 increase, has injected considerable uncertainty into the economic outlook. This data directly challenges the narrative of a robust US economy that has, until now, supported demand for risk assets and commodities. The immediate consequence was a sharp repricing of Federal Reserve policy expectations. Futures markets rapidly adjusted, significantly increasing the probability of the Fed holding interest rates steady at its September meeting, and even introducing some speculation about potential rate cuts later in the year. This dovish shift in Fed expectations can be a double-edged sword for crude oil. On one hand, lower interest rates and a less restrictive monetary policy environment could theoretically boost economic activity and, consequently, oil demand. On the other hand, the very reason for the Fed's potential pivot - a weakening economy - is itself a headwind for crude prices.
The market's reaction to the NFP data underscores this tension. While the prospect of lower-for-longer interest rates might typically buoy commodities, WTI experienced a price decline. This suggests that the immediate concern for oil traders is the demand destruction implied by a faltering US economy. The correlation between the US Dollar Index (DXY) and WTI is also critical here. With the DXY at 99.55, showing a recent decline, one might expect support for commodities. However, the NFP's impact on Fed policy could be a more dominant driver. A less hawkish Fed might weaken the dollar, which could provide some underlying support for dollar-denominated commodities like WTI. Yet, if the economic slowdown narrative takes hold, this dollar weakness might not be enough to offset the drag on oil demand. The upcoming Consumer Price Index (CPI) data and the Federal Reserve's meeting minutes will be crucial in determining whether the market's interpretation of the NFP shock translates into a sustained shift in Fed policy or if other factors, like inflation persistence, will reassert their dominance.
Geopolitical Tensions and Supply-Side Dynamics: The Unseen Hand
While economic data often grabs the headlines, the fundamental supply and demand picture for crude oil remains heavily influenced by geopolitical factors and the strategic decisions of major producers. The ongoing supply cuts orchestrated by OPEC+ have been a cornerstone of the oil market's resilience, acting as a significant buffer against demand-side concerns. With Brent crude still trading above $80 and WTI hovering around $78.20, it's clear that the market has been pricing in a supply deficit. Any disruption to this delicate balance, whether through unexpected production increases or geopolitical flare-ups, can have an outsized impact. The recent warnings from Saudi Arabia and continued tensions in the Strait of Hormuz serve as stark reminders of the fragility of global oil supply routes. These factors create a persistent undercurrent of risk premium in crude prices, providing a level of support that is independent of short-term economic data fluctuations.
The market's ability to absorb the bearish implications of the NFP report without a more significant price collapse speaks to the market's awareness of these supply-side constraints. Traders are likely caught between the immediate fear of economic slowdown and the longer-term reality of constrained supply. This dynamic creates opportunities for volatility, as news related to either factor can trigger sharp price swings. For instance, any further escalation of geopolitical tensions in the Middle East could quickly push WTI prices higher, irrespective of the recent economic data. Conversely, a persistent trend of weak economic data globally could eventually erode the impact of supply cuts, leading to a more sustained downturn. The upcoming week will be crucial in assessing which narrative gains dominance – the demand destruction fears sparked by the NFP or the persistent supply tightness amplified by geopolitical risks.
Key Levels to Watch: The $78.20 Line and Beyond
As we dissect the technical and fundamental landscape for WTI, identifying key price levels is paramount for understanding potential trading ranges and pivot points. The current price of $78.20 serves as an immediate focal point. On the 1-hour chart, immediate resistance is seen at $78.41, followed by $78.66 and $79.01. Conversely, immediate support lies at $78.01, $77.80, and $77.60. However, these short-term levels are less critical than the broader daily support and resistance zones.
Looking at the daily chart, the support levels are $76.71, $74.20, and $72.81. The $76.71 level is particularly important. A decisive close below this point would signal a significant bearish development, potentially opening the door for a deeper correction towards $74.20. This level has acted as a significant floor in recent price action, and a failure to hold it could trigger stop-loss orders and accelerate selling pressure. On the upside, resistance levels to watch are $80.61, $82.00, and $84.51. The $80.61 level represents the first significant hurdle for any potential bullish recovery. A break and sustained hold above this resistance could signal a resumption of the prior uptrend, targeting higher levels. The interplay between these support and resistance zones, especially in light of the conflicting signals from economic data and geopolitical risks, will be crucial in determining WTI's short-to-medium term direction.
The Week Ahead: Economic Calendar and Market Expectations
As we look towards the upcoming trading week, the economic calendar is packed with events that could significantly influence WTI's price action. Following the shock of the NFP report, all eyes will be on upcoming inflation data, particularly the US Consumer Price Index (CPI). If inflation proves to be stickier than anticipated, it could force the Fed to maintain a more hawkish stance, potentially strengthening the dollar and pressuring crude prices. Conversely, signs of cooling inflation would further bolster expectations of a Fed pause or even cuts, which could support WTI, provided the underlying economic growth narrative doesn't deteriorate further.
The minutes from the last Federal Reserve meeting will also be a key focus, providing deeper insights into the central bank's deliberations and forward guidance. Any hints about the Fed's reaction function to the current economic data, especially concerning inflation and employment, will be closely scrutinized. Beyond US economic data, developments from OPEC+ meetings or statements from member nations regarding production levels will remain critically important. Any indication of changes to supply management strategies could quickly override broader macroeconomic concerns. Furthermore, any significant geopolitical developments, particularly in the Middle East, could introduce substantial volatility and add a risk premium to crude prices, irrespective of the economic calendar.
Scenario Analysis: Charting the Potential Paths for WTI
Bearish Scenario: Demand Concerns Dominate
65% ProbabilityConsolidation Scenario: Data Conflict Continues
25% ProbabilityBullish Scenario: Supply Fears Reignite
10% ProbabilityFrequently Asked Questions: WTI Analysis
What happens if WTI breaks below the $76.71 support level?
A decisive break below the $76.71 support level on the daily chart would invalidate the current range-bound outlook and suggest further downside. This could trigger stop-losses and accelerate a move towards the next support target at $74.20, indicating that demand concerns are outweighing supply tightness.
Should I consider buying WTI at current levels around $78.20 given the weak NFP data?
Buying at current levels carries significant risk due to the bearish sentiment from the NFP report and the proximity to daily support at $76.71. A more prudent approach might be to wait for confirmation, such as a hold above $78.20 with bullish divergence on shorter timeframes, or a clear bounce from the $76.71 support level.
Is the RSI at 46.22 on the daily chart a sell signal for WTI?
An RSI reading of 46.22 is in neutral territory and not a direct sell signal. While it indicates a slight bearish lean on the daily timeframe, it doesn't confirm a strong downtrend. The overall strong daily trend strength (91%) suggests this level is more indicative of a temporary pullback within a larger bullish structure rather than a definitive trend reversal.
How will upcoming US CPI data and Fed meeting minutes affect WTI this week?
Upcoming US CPI data and Fed minutes are crucial. If inflation remains high, it could lead to a more hawkish Fed, potentially strengthening the dollar and pressuring WTI. Conversely, falling inflation could support WTI by increasing expectations for Fed rate cuts, but only if the underlying economic growth concerns do not worsen significantly.
| Indicator | Value | Signal | Interpretation |
|---|---|---|---|
| RSI (14) | 46.22 | Neutral | Slight bearish lean, room for movement |
| MACD | Negative Momentum | Bearish | Downward pressure indicated |
| Stochastic | %K: 21.95, %D: 22.44 | Bullish Crossover | Oversold territory, potential bounce |
| ADX | 21.09 | Moderate Trend | Suggests a developing or consolidating trend |
| Daily Trend Strength | 91% | Strong | Underlying bullish forces remain potent |
Track markets in real-time
AI-powered analysis, technical indicators and real-time price data.
Join Our Telegram Channel
Breaking market news, AI analysis and trading signals instantly.
Join Channel