

The Tug-of-War at $83: WTI Caught Between Bullish Momentum and Looming Overbought Signals
WTI crude oil is currently navigating a critical juncture, trading near the $83.19 mark. The relentless upward march of the past few sessions has propelled prices higher, fueled by a confluence of factors ranging from geopolitical tensions to a perceived shift in market sentiment. However, as WTI approaches key resistance levels, a debate is intensifying among traders and analysts: is this the start of a sustained rally towards new highs, or are we on the cusp of a significant correction? The intraday and daily charts present a complex picture, with strong bullish signals clashing with increasingly overbought conditions. This analysis delves into the intricate dance between the bulls and bears at this pivotal price point, examining the underlying drivers and potential scenarios shaping WTI's near-term trajectory.
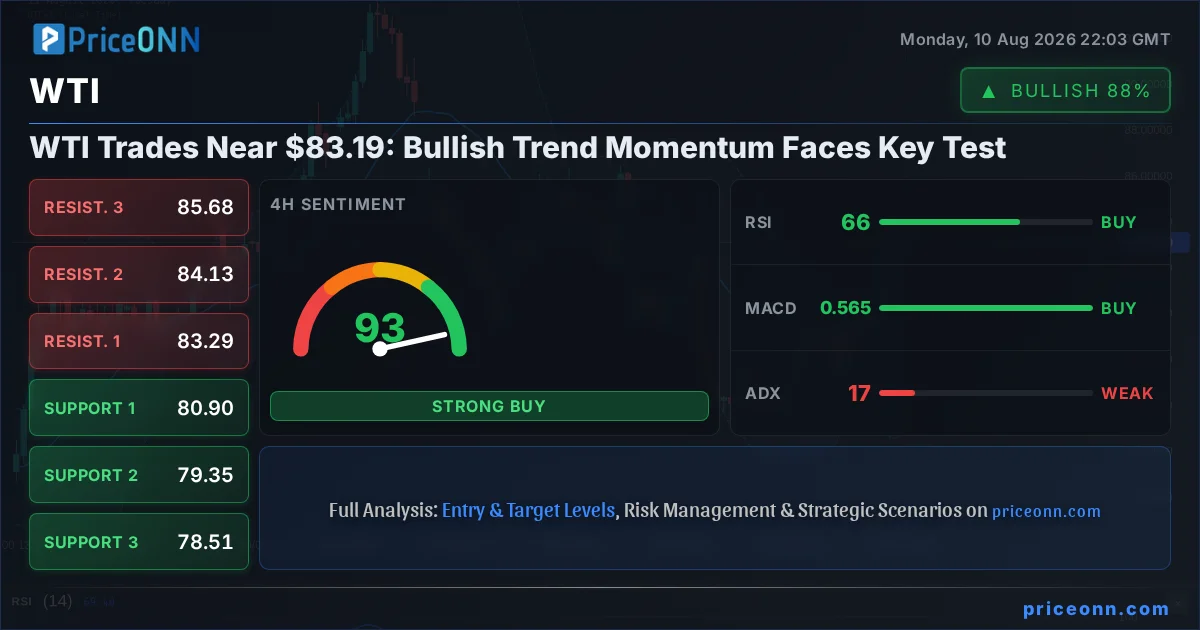
- WTI is trading near $83.19, showing strong bullish momentum on 1H and 4H charts, but daily trend strength is only 50%.
- Key resistance is at $83.28, while immediate support lies at $82.82; a break below this could signal a pullback.
- RSI readings are approaching overbought territory (79.66 on 1H, 65.42 on 4H, 53.61 on 1D), suggesting potential for profit-taking.
- The ADX at 37.63 on the 1H chart indicates a strong trend, but lower ADX values on longer timeframes suggest waning trend conviction.
- Geopolitical risks and supply concerns remain elevated, providing a supportive backdrop for oil prices.
The Bull Case: Riding the Wave of Supply Concerns and Risk Appetite
Momentum on the 1-Hour Chart: A Clear Uptrend
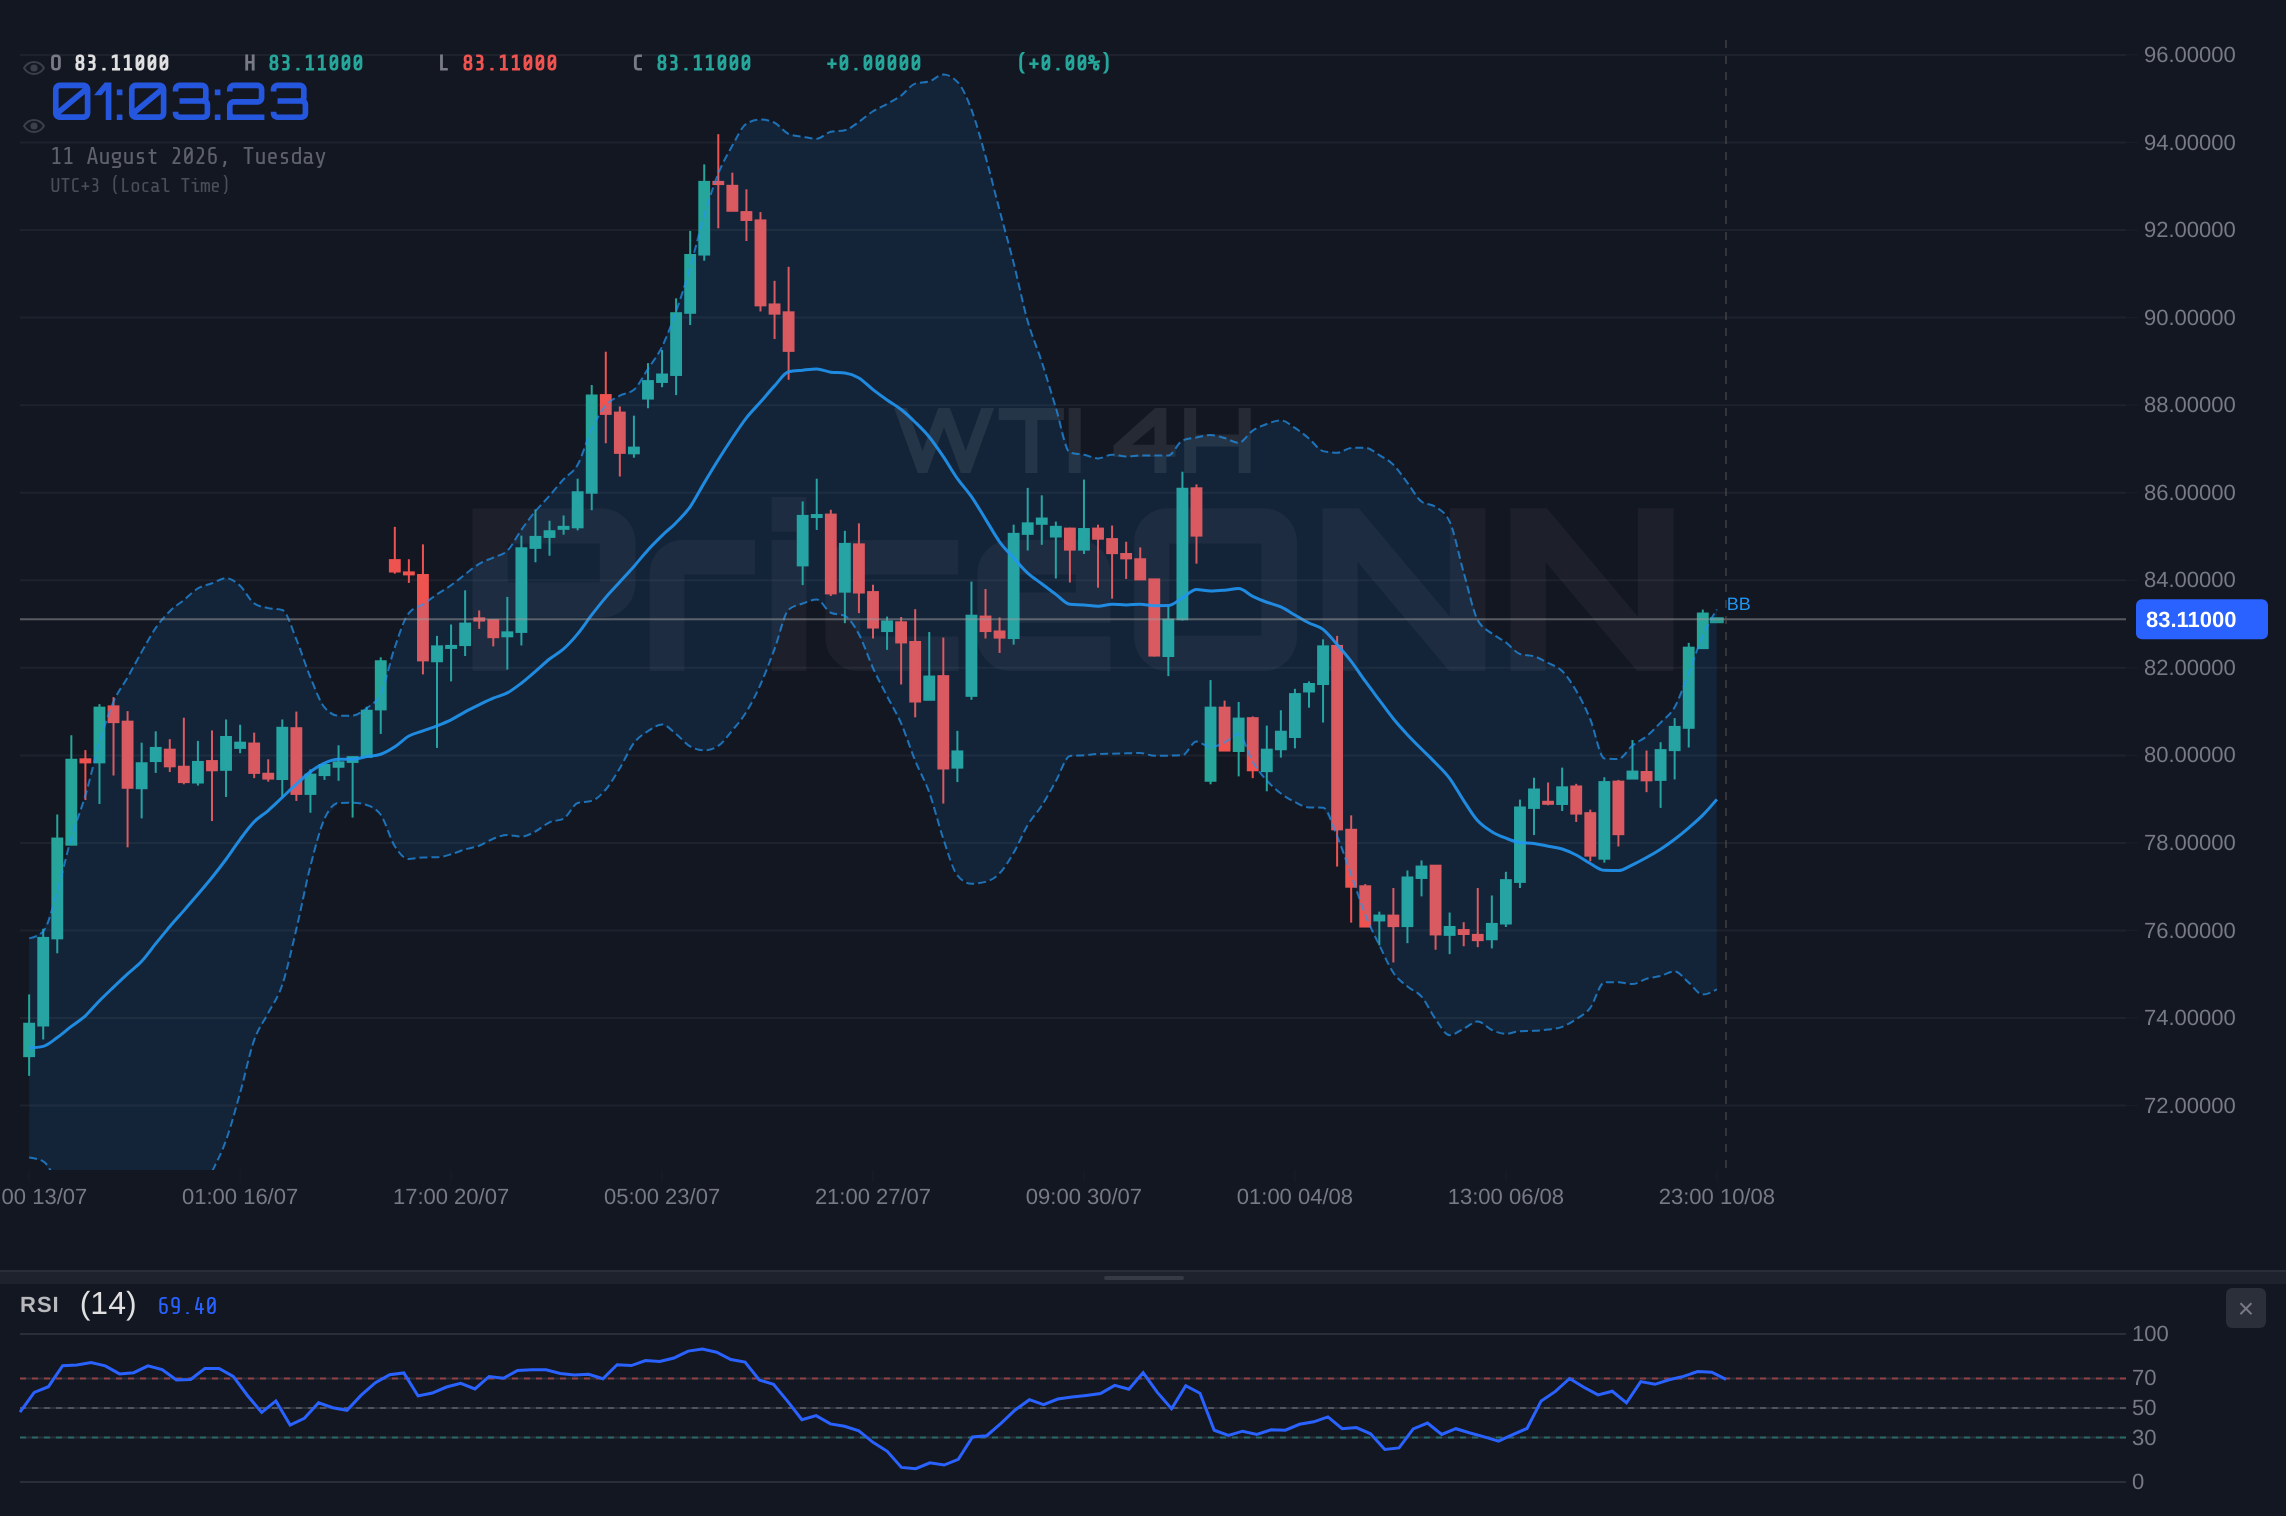
Looking at the 1-hour timeframe for WTI, the technical picture is overwhelmingly bullish. The trend is firmly established with a strength of 100%, and momentum indicators are largely aligned. The MACD is trading above its signal line, indicating positive momentum, while the Stochastic Oscillator is showing %K (92.69) above %D (94.32) in the overbought zone, albeit with %K slightly below %D, hinting at a potential stall. The ADX at 37.63 further reinforces the notion of a strong, trending market. Immediate support is identified at $82.82, followed by $82.51 and $82.36. On the upside, resistance is being tested at $83.28, with further levels at $83.43 and $83.74. The RSI, currently at 79.66, is deeply in overbought territory, flashing a warning sign that a short-term pullback or consolidation is likely. However, in a strong trend, overbought conditions can persist, and bulls may be looking to add to positions on any minor dips.
4-Hour Chart Strength: Sustaining the Rally
The 4-hour chart offers a slightly more nuanced, yet still predominantly bullish, perspective. While the trend strength is rated at 50% (neutral on this timeframe), the overall signal leans towards BUY. The MACD is positive, and the Stochastic Oscillator is still in the overbought region, with %K at 96.44 and %D at 83.13, suggesting continued upward pressure, though the gap is widening. The RSI at 65.42 is in the upper half of the neutral zone, indicating room for further upside before reaching extreme overbought levels on this timeframe. Support levels are more distant here, starting at $80.90, then $79.35, and $78.51. Resistance appears at $83.29, $84.13, and $85.68. The ADX at 17.15 suggests a weaker trend on this timeframe compared to the 1-hour chart, implying that the recent surge might be losing some of its trending power, potentially leading to more range-bound activity or a consolidation before the next directional move.
Fundamental Tailwinds: Geopolitics and Supply Dynamics
The bullish case for WTI is significantly bolstered by ongoing geopolitical risks and supply-side dynamics. Recent reports, such as those from Reuters and Foreks Haber, have highlighted persistent tensions in key oil-producing regions. The Strait of Hormuz remains a focal point for potential supply disruptions, and the ongoing situation in Eastern Europe continues to cast a shadow over global energy security. The fact that U.S. energy infrastructure has been instrumental in mitigating supply shocks from the Middle East, as reported by Dow Jones, underscores the critical role of American production in balancing the global market. Furthermore, the recent news about Trump facing growing pressure to restrict U.S. oil exports, as reported by Energy Intelligence, adds another layer of complexity. While such a move could tighten domestic supply and theoretically boost prices, it also risks broader market implications. Money managers have been reducing bullish bets on Brent and WTI futures for two consecutive weeks, according to COT data cited by Investing.com, despite the price rally. This suggests that while the trend is currently up, institutional sentiment is becoming more cautious, perhaps anticipating a shift or waiting for clearer signals.
The Bear Case: Overbought Conditions and Diverging Signals
Daily Chart Nuances: Trend Weakness and Caution
The daily timeframe introduces a significant counterpoint to the short-term bullish narrative. While the overall signal is still BUY (7 buys, 1 sell), the trend is categorized as neutral with only 50% strength. This suggests that the longer-term conviction behind the current move may be wavering. The RSI at 53.61 is comfortably in neutral territory, showing room for further upside but also indicating no immediate signs of exhaustion. However, the MACD is showing negative momentum, with the histogram below the signal line, a divergence from the shorter timeframes. The Stochastic Oscillator's %K (44.01) is below %D (22.63), hinting at a potential bullish crossover from oversold, but the ADX at 20.15 indicates a moderate, not strong, uptrend. Support levels are more significant on the daily chart, starting at $77.26, then $76.32, and $75.00. Resistance levels are at $82.72, $84.22, and $85.33. The Bollinger Bands are hugging the middle band, suggesting a lack of strong directional conviction on this timeframe.
RSI Divergence and Stochastic Signals: Potential for Reversal
Across multiple timeframes, the RSI is approaching or has entered overbought territory. On the 1-hour chart, it stands at 79.66, and on the 4-hour chart, it's at 65.42. While these levels don't necessarily signal an immediate sell, they indicate that the market is becoming expensive and vulnerable to pullbacks. The Stochastic Oscillator on the 1-hour chart is at extreme levels (92.69 / 94.32), and while it's not yet showing a bearish cross, its position suggests that any further upside might be limited without a significant increase in buying pressure. The fact that the Stochastic %K is slightly below %D on the 1-hour chart, and %K is below %D on the 4-hour chart, suggests that momentum might be starting to wane. A key bearish signal would be a close below the immediate support at $82.82, which could trigger a cascade of sell orders as traders cut their long positions. The divergence between the strong short-term uptrend and the weaker daily trend strength, coupled with overbought indicators, forms the core of the bear argument.
Macroeconomic Cross-Currents: DXY and Inflation Expectations
The broader macroeconomic environment presents a mixed bag for WTI. The DXY (Dollar Index) is showing signs of strength, currently trading around 99.84. A stronger dollar typically puts downward pressure on oil prices, as dollar-denominated commodities become more expensive for holders of other currencies. The 1-hour DXY chart shows a bullish signal, while the 4-hour chart is also leaning bullish. However, the daily DXY chart is bearish, indicating a potential conflict in signals. If the dollar continues to strengthen across the board, it could act as a headwind for WTI. Furthermore, while high oil prices contribute to inflation, the market is also sensitive to the Federal Reserve's policy stance. If inflation data, such as CPI, were to cool significantly, it could lead to expectations of a Fed pause or even rate cuts, which might initially support risk assets and oil, but could also signal slowing economic growth, a negative for oil demand in the longer term. The recent weak jobs report, as mentioned in Forex news, already created a narrative for a Fed hold, but the upcoming CPI data will be crucial. The interplay between oil supply, geopolitical events, dollar strength, and inflation expectations creates a complex web of factors that can quickly shift market sentiment.
The Verdict: Navigating the Choppy Waters Around $83.19
Technical Confluence: A Cautionary Signal
The technical indicators present a divided picture. The 1-hour and 4-hour charts scream 'bullish momentum,' with strong uptrends and positive MACD readings. However, the daily chart's neutral trend strength and the RSI readings nearing overbought levels on shorter timeframes cannot be ignored. The ADX values also paint a conflicting story: a strong 37.63 on the 1H chart suggests a committed trend, but the lower values on the 4H (17.15) and 1D (20.15) charts indicate that this trend might be losing steam or becoming more range-bound. This divergence suggests that while the path of least resistance has been upwards, the market is becoming increasingly vulnerable to a correction. The immediate support at $82.82 is a critical level to watch. A decisive break below this could invalidate the short-term bullish thesis and initiate a move towards the next support levels. Conversely, holding above $83.28 resistance could signal a continuation, but the overbought indicators suggest such a move might be met with profit-taking.
Fundamental Undercurrents: Support Remains Strong
Despite the technical cautionary signals, the fundamental backdrop for oil prices remains supportive. Geopolitical risks, particularly concerning supply routes and production stability in key regions, continue to underpin prices. OPEC+ decisions, while not explicitly detailed in the provided data, are always a significant factor influencing supply. The recent reduction in bullish bets by money managers, as reported, could be interpreted in two ways: either they are anticipating a top and reducing exposure, or they are waiting for a better entry point after a potential pullback. Given the persistent supply concerns, it's unlikely that oil prices will collapse without a significant shift in geopolitical stability or a drastic change in global demand forecasts. The narrative of tight supply, coupled with a resilient, albeit cautious, global demand picture, provides a solid floor for WTI prices, even if short-term technicals suggest a pause.
Strategic Considerations: Patience and Risk Management
For traders and investors, the current environment around $83.19 for WTI calls for a strategy of patience and vigilant risk management. The strong short-term bullish momentum is tempting, but the overbought indicators and the neutral daily trend suggest that chasing the rally might be risky. A more prudent approach could be to wait for a clearer signal. This could involve waiting for a decisive break above the $83.28 resistance, confirming further upside potential, or waiting for a pullback to a key support level, such as $82.82 or even lower, to assess buying opportunities with better risk-reward ratios. The conflicting signals across different timeframes and indicators highlight the choppiness of the market, making it crucial to define risk parameters clearly. Stop-loss orders below immediate support levels would be essential for any positions taken. The market is not providing a clean directional signal at this exact moment; rather, it's presenting a battleground where bulls and bears are testing each other's resolve.
The Road Ahead: Key Levels and Potential Catalysts
Looking forward, the price action around $83.19 will be closely watched. The immediate focus will be on whether WTI can sustain its momentum above the $83.28 resistance or if it succumbs to profit-taking pressure, testing the $82.82 support. A break below $82.82 could open the door to lower levels, potentially testing the $80.90 support on the 4-hour chart. Conversely, a strong hold above $83.28, especially with increasing volume, could signal a continuation towards the $84.13 and $84.96 resistances. Key catalysts to monitor include any significant geopolitical developments, OPEC+ announcements, and crucial economic data releases, particularly inflation figures and central bank commentary, which will influence the DXY and overall risk sentiment. The market is at an inflection point, and the next few trading sessions will be crucial in determining whether the bullish trend can overcome the overbought technicals and continue its ascent.
Frequently Asked Questions: WTI Analysis
What happens if WTI breaks below the $82.82 support level?
A decisive break below the $82.82 support level would likely invalidate the short-term bullish momentum, potentially triggering a sell-off towards the $80.90 support on the 4-hour chart. This scenario would signal that profit-taking is intensifying and bears are gaining control.
Should I buy WTI at current levels near $83.19 given the RSI is at 79.66?
Buying at current levels near $83.19, with the 1-hour RSI at 79.66, carries significant risk due to overbought conditions. A more prudent approach might be to wait for a pullback to support levels like $82.82 or a confirmed breakout above $83.28 resistance, ideally with confirmation from other indicators.
Is the ADX reading of 37.63 on the 1H chart a buy signal for WTI?
An ADX of 37.63 on the 1-hour chart indicates a strong trend, which is generally bullish when aligned with price direction. However, it should be considered alongside other indicators; on its own, it simply confirms trend strength, not necessarily direction or entry timing, especially when RSI is overbought.
How will the upcoming CPI data affect WTI prices this week?
Upcoming CPI data will be crucial. If inflation comes in hotter than expected, it could support oil prices by reinforcing supply concerns and potentially leading to higher interest rates, which can also increase oil demand hedging. Conversely, cooler inflation might lead to dollar strength and risk-off sentiment, pressuring WTI.
Track markets in real-time
AI-powered analysis, technical indicators and real-time price data.
Join Our Telegram Channel
Breaking market news, AI analysis and trading signals instantly.
Join Channel