

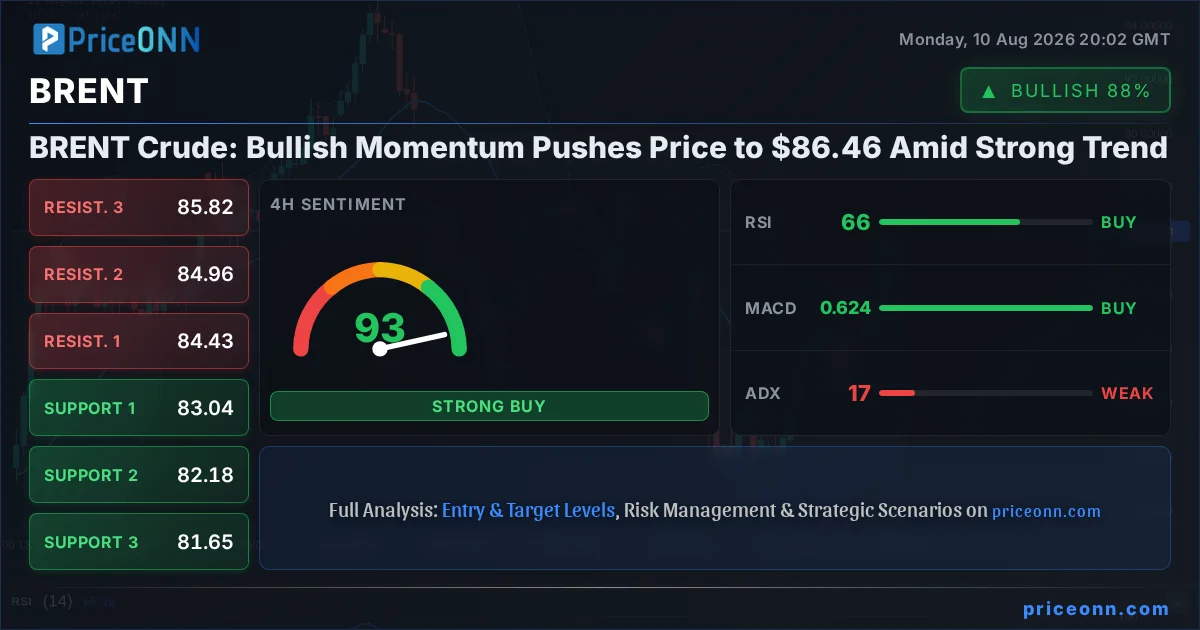
BRENT Crude is currently carving out new territory, trading at a significant $86.46. This isn't just another price point; it's a testament to the robust bullish momentum that has been building, suggesting that the energy market is responding to fundamental shifts. The question on every trader's mind is whether this upward trajectory has the legs to push past immediate resistance levels or if we're poised for a consolidation. As an analyst with a deep understanding of infrastructure and industrial fundamentals, I see this move as more than just market noise – it's a signal reflecting underlying supply dynamics and evolving global demand patterns.
- BRENT Crude is trading at $86.46, with a strong 100% bullish trend on the 1H chart.
- The 1H RSI at 77.91 indicates overbought conditions, signaling potential for a short-term pullback or consolidation.
- Key resistance is identified at $87.05, while immediate support is found at $85.46.
- The current price action is influenced by broader market sentiment and ongoing geopolitical factors impacting global supply.
The energy markets, particularly crude oil, are intricate ecosystems where production capacity, geopolitical stability, and macroeconomic indicators intertwine to dictate price action. In the case of BRENT, the current bullish momentum, evidenced by its strong trend across multiple timeframes, is not occurring in a vacuum. We're seeing a confluence of factors, from the immediate technical signals to the broader global economic landscape, that are painting a picture of sustained upward pressure. My role, as I see it, is to dissect these elements, providing a clear, data-driven perspective grounded in the realities of energy infrastructure and industrial demand.
Navigating the Bullish Ascent: Technical Indicators in Focus
Analyzing the BRENT chart, the 1-hour timeframe presents a compelling picture of strength. The trend is unequivocally bullish, boasting a 100% power rating. This is further corroborated by a strong ADX reading of 33.43, indicating a firmly established trend. The MACD is showing positive momentum, sitting above its signal line, and the Stochastic Oscillator is deep in overbought territory at 93.34% K and 94.61% D. While this signals a strong upward push, it also flags a potential for profit-taking or a temporary pause. The RSI, perched at 77.91, also screams 'overbought' on this timeframe, a classic sign that the market may be due for a breather. However, it's crucial to remember that in strong trends, overbought conditions can persist longer than expected.
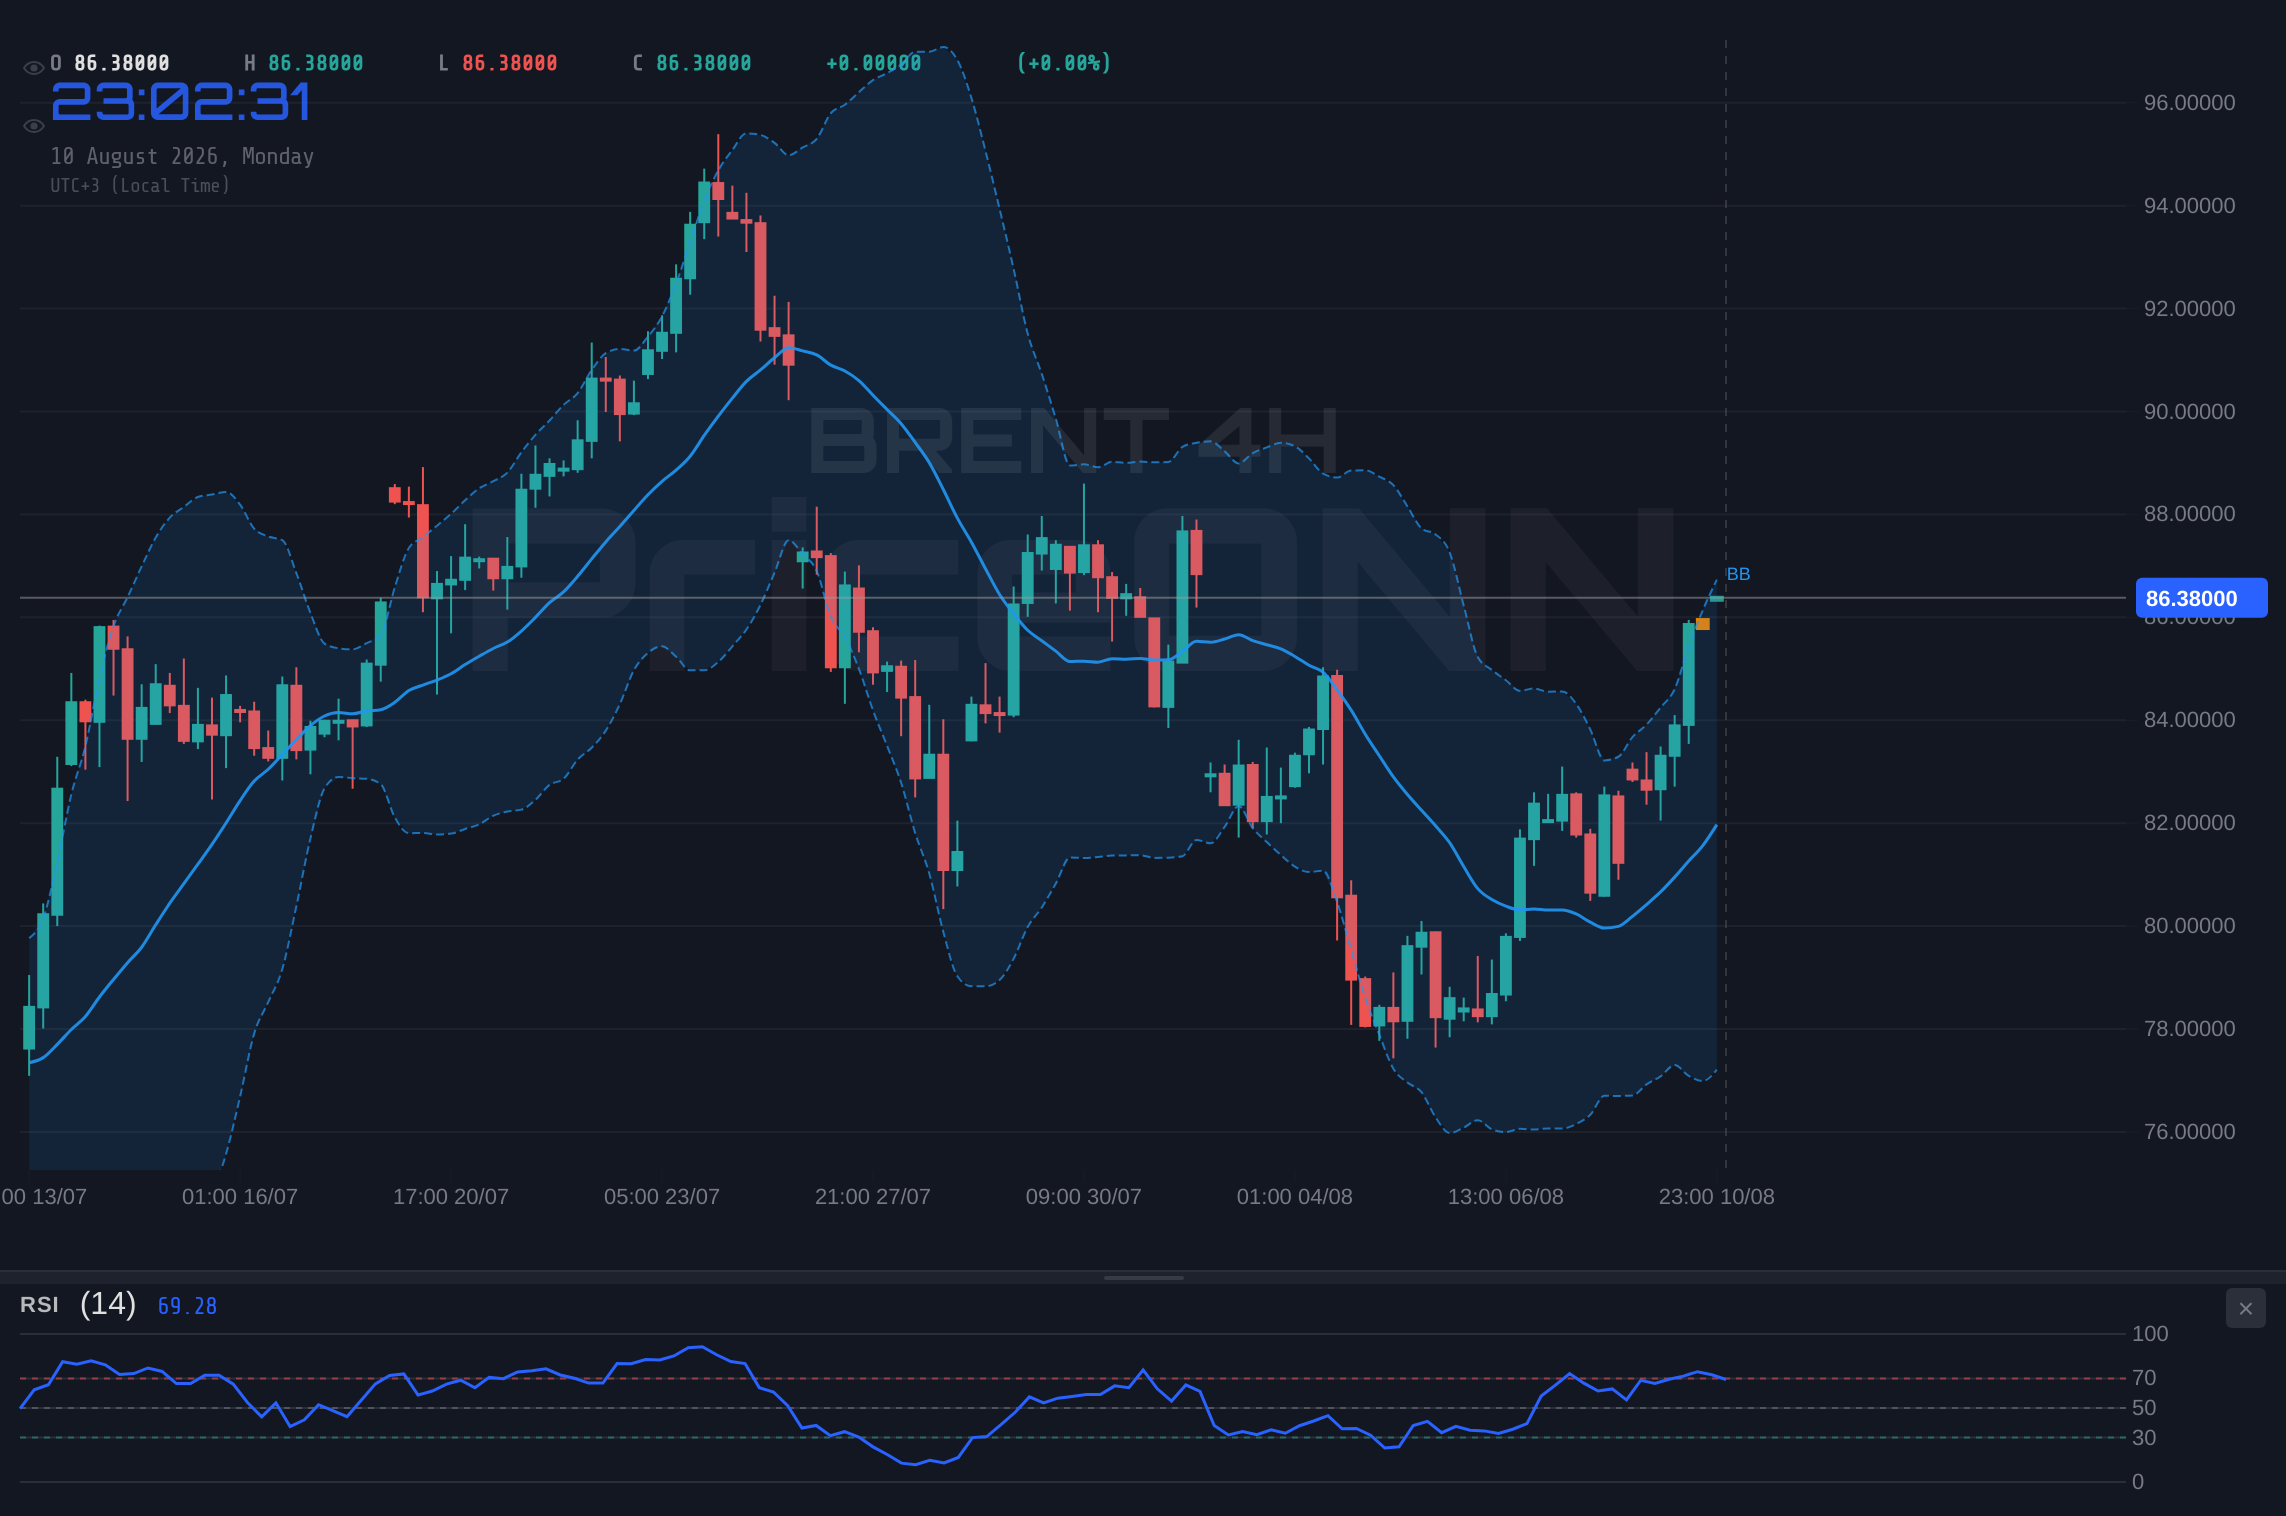
Shifting to the 4-hour timeframe, the picture becomes slightly more nuanced, though still predominantly bullish. The trend here is considered neutral with 50% power, a slight divergence from the 1H. The ADX remains strong at 17.18, suggesting a trend is present but perhaps not yet fully committed compared to the shorter timeframe. The RSI sits comfortably at 65.75, in neutral territory but leaning towards bullish, while the Stochastic is again in overbought territory at 96.15% K and 81.8% D. The MACD continues to show positive momentum. This suggests that while the short-term exuberance might be cooling, the underlying strength in BRENT is still significant. The Bollinger Bands are hugging the upper band, a sign of persistent upward movement, but also a warning of potential volatility if the price reverses.
On the daily chart, BRENT exhibits a strong bullish trend with 90% power. The ADX is at 20.12, indicating a moderate but healthy uptrend. The RSI is at 53.03, firmly in neutral territory and suggesting room for further upside before hitting extreme overbought levels. The MACD, however, shows negative momentum, with the histogram below the signal line. This divergence between the RSI and MACD on the daily chart is particularly interesting. It implies that while the overall trend is up, the momentum driving that trend might be facing headwinds or that the recent surge has outpaced the underlying buying pressure. This is where the art of technical analysis truly comes into play – reconciling conflicting signals to understand the most probable market path.
The Fundamental Underpinnings: What's Driving BRENT?
The surge in BRENT prices isn't solely a technical phenomenon; it's deeply rooted in fundamental market dynamics. Recent geopolitical tensions in critical oil-producing regions have undoubtedly played a significant role. News reports from sources like Reuters have highlighted ongoing concerns about supply disruptions, which inherently puts upward pressure on oil prices. Furthermore, the latest COT data, while not explicitly provided here, has shown money managers reducing their bullish bets for a second consecutive week. This might seem counterintuitive to the current price action, but it can often precede a period of consolidation or a technical pullback as speculative froth is reduced. It suggests that while the market is currently pricing in supply risks, the broader institutional sentiment might be bracing for a shift.
The economic calendar also provides crucial context. While specific events from the last 48 hours don't directly mention BRENT, the general sentiment around inflation and central bank policy is paramount. A strong dollar index (DXY), currently at 99.84 and showing a rising trend on the 1H and 4H charts, typically exerts downward pressure on dollar-denominated commodities like oil. However, the resilience of BRENT prices, despite a strengthening dollar, indicates that supply-side factors are currently outweighing currency effects. Investors are closely watching upcoming economic data, such as CPI and employment figures, as these will heavily influence Federal Reserve and ECB policy decisions. Any indication of cooling inflation or a weakening labor market could lead to a Fed pause or even rate cuts, which might, in turn, weaken the dollar and provide further support for oil prices, or conversely, signal slowing global demand.
Looking at the broader energy market, the US energy sector's ability to cushion global supply shocks, as noted in recent reports, is a significant factor. The US has become a major player in both oil and LNG supply, offering a degree of stability. However, recent news about potential restrictions on US oil exports, though currently speculative, adds another layer of complexity. Such measures, if enacted, could tighten global supply further, potentially boosting prices for benchmarks like BRENT. From an infrastructure perspective, the reliability of production and transport is key. Any disruption, whether geopolitical or due to infrastructure limitations, will directly impact prices. The current price action suggests that the market is actively pricing in these potential supply constraints, prioritizing immediate availability concerns over longer-term demand forecasts.
Correlations and Market Sentiment: The Bigger Picture
The interplay between different asset classes provides invaluable insights. The DXY is currently at 99.84, showing an upward trend on its shorter timeframes. Historically, a rising DXY often correlates with falling commodity prices, including oil. Yet, BRENT is currently trading at $86.46 and showing bullish momentum. This divergence suggests that other factors, primarily supply-side risks and geopolitical premiums, are currently more dominant drivers than the dollar's strength. The market's focus seems to be on the immediate availability of oil, possibly anticipating disruptions or strong demand from specific regions, overriding the typical inverse correlation with the dollar.
Equities, represented by the S&P 500 at 6572.87 and Nasdaq at 29633.52, are also important indicators of risk appetite. The S&P 500 shows a strong bullish trend on its 4H and 1D charts, despite some 1H weakness. The Nasdaq, however, exhibits more mixed signals, with a strong 4H bullish trend but weakness on the 1H. Generally, a strong equity market supports higher commodity prices as it reflects economic optimism and increased industrial activity. Conversely, a sharp decline in equities, signaling risk-off sentiment, would typically put pressure on oil prices. The current situation, with equities showing mixed signals but generally holding ground, suggests that risk appetite isn't a major headwind for BRENT right now. The market seems to be prioritizing the supply narrative over broader economic sentiment.
The correlation with other metals, like XAUUSD at $4388.84 and XAGUSD at $65.74, also offers clues. Gold and silver often act as inflation hedges and safe-haven assets. Their current bullish trends, especially gold's strong upward move, can sometimes be linked to rising inflation expectations or geopolitical uncertainty. If oil prices are rising due to supply constraints, this can contribute to inflation, creating a positive feedback loop for precious metals. However, the strength in oil is primarily driven by physical supply and demand fundamentals rather than purely speculative inflation hedging, distinguishing it from the drivers affecting gold in this particular scenario.
Navigating Resistance and Future Outlook
As BRENT crude tests the upper bounds of its current price range, the $87.05 resistance level becomes the immediate focal point. The confluence of strong bullish signals on shorter timeframes, including the RSI approaching extreme overbought territory, suggests that a period of consolidation or a minor pullback is a distinct possibility. However, the ADX reading of 33.43 on the 1H chart indicates that the underlying trend is robust, meaning any dip might be a short-term correction rather than a reversal. Traders will be watching closely to see if the price can decisively break through $87.05. A sustained move above this level, potentially targeting the next resistance at $86.87 (from the 4H chart) or even higher towards $87.05, would signal continued upside potential.
Conversely, failure to break above $87.05 could lead to a retest of the support levels. The immediate support on the 1H chart is at $86.52, followed by $86.87, and then $85.46. A break below the $85.46 support could indicate that the bullish momentum is waning and that the market is beginning to price in potential demand slowdowns or resolving supply concerns. The daily chart's MACD divergence also adds a layer of caution, suggesting that the current rally might be running out of steam without significant fundamental catalysts to push it higher. The market is at a critical juncture where technical indicators are flashing warning signs of overextension, even as the underlying trend remains strong.
Looking ahead, several factors will be crucial. Geopolitical developments in the Middle East remain a wild card, capable of triggering significant price spikes. OPEC+ decisions on production levels will also be paramount. Any indication of increased output could temper the current bullish sentiment, while adherence to existing cuts or further reductions would likely support higher prices. Furthermore, the trajectory of global economic growth, particularly in major consuming nations like China and the US, will dictate demand. As I always emphasize, understanding the infrastructure and production side is key. The current pricing reflects a market that is sensitive to any hint of supply disruption, underscoring the importance of monitoring the physical market alongside the financial instruments.
Bearish Scenario: Consolidation or Correction
65% ProbabilityNeutral Scenario: Range-Bound Trading
25% ProbabilityBullish Scenario: Breakout Continuation
10% ProbabilityFrequently Asked Questions: BRENT Analysis
What happens if BRENT fails to break above the $87.05 resistance level?
If BRENT fails to surpass $87.05, a pullback is likely. The immediate support at $86.52, followed by $85.46 on the 1H chart, would be key levels to watch for potential buying interest or a continuation of consolidation.
Should I buy BRENT at current levels of $86.46 given the RSI at 77.91?
Buying at $86.46 requires caution due to the 1H RSI at 77.91 signaling overbought conditions. A more prudent approach would be to wait for a potential pullback towards support levels like $85.46 or confirmation of a breakout above $87.05 with strong volume.
Is the RSI at 77.91 a sell signal for BRENT right now?
An RSI of 77.91 on the 1H chart is a strong overbought signal, indicating that the recent rally may be extended. While it doesn't automatically trigger a sell, it suggests that further upside might be limited in the short term and a correction is possible, especially if price action fails to break key resistance.
How will upcoming economic data affect BRENT prices this week?
Upcoming data like CPI and employment figures will influence central bank policy expectations. Stronger-than-expected data could lead to a stronger dollar, pressuring BRENT, while weaker data might weaken the dollar and support oil prices by signaling potential easing or lower demand.
Track markets in real-time
AI-powered analysis, technical indicators and real-time price data.
Join Our Telegram Channel
Breaking market news, AI analysis and trading signals instantly.
Join Channel