

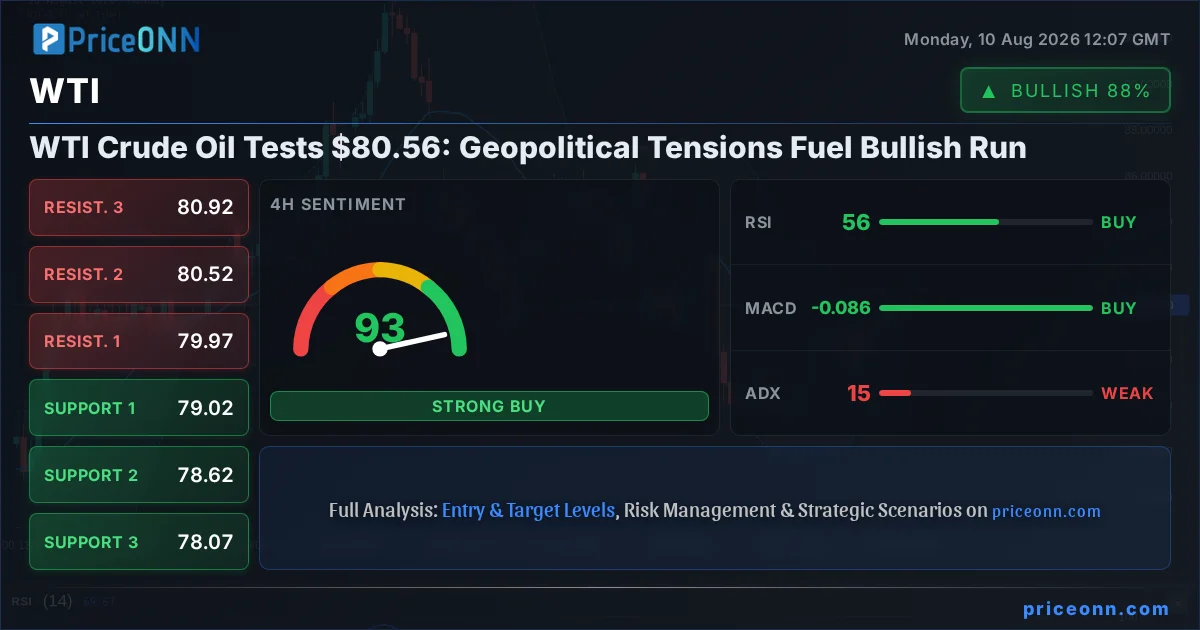
The global energy landscape is currently a complex tapestry woven with threads of geopolitical tension, shifting central bank policies, and fluctuating risk appetite. Amidst this intricate environment, WTI crude oil finds itself navigating crucial price levels, currently trading near the significant psychological mark of $80.56. This juncture is not merely a number; it represents a critical battleground where the forces of supply disruption fears, macroeconomic data, and the ever-present influence of the US Dollar Index (DXY) clash. Understanding the interplay between these factors is paramount for any trader seeking to decipher the immediate future of oil prices.
- WTI crude oil is trading near $80.56, influenced by geopolitical concerns and macroeconomic data.
- The Dollar Index (DXY) at 99.75 presents a headwind, while a neutral 1H trend for WTI suggests caution.
- Strong 4H and 1D bullish signals for WTI, with ADX at 21.58 and 19.63 respectively, indicate underlying upward momentum despite short-term consolidation.
- Upcoming economic events, particularly inflation and employment data, will be critical in shaping the Federal Reserve's policy and, consequently, oil price direction.
Navigating the Geopolitical Crosscurrents: Why Oil Prices Are on Edge
The Shadow of Supply Disruptions
The recent surge in WTI crude oil prices, pushing it towards the $80.56 level, is undeniably amplified by persistent geopolitical anxieties. The ongoing instability in key oil-producing regions, particularly the Middle East, continues to cast a long shadow over global supply chains. Any escalation of tensions, or even the perception of impending disruption, can trigger immediate and significant price reactions as traders price in a risk premium. This isn't merely theoretical; historical precedents have shown how swiftly oil prices can react to geopolitical flare-ups, impacting everything from industrial production costs to consumer inflation. The market's sensitivity to these events means that even minor developments can lead to outsized price movements, creating a volatile but potentially rewarding environment for those who can anticipate these shifts. The current ADX readings, particularly the 21.58 on the 1D chart, suggest that while a trend is present, it lacks overwhelming conviction, leaving room for geopolitical news to act as a strong catalyst.
The Federal Reserve's Tightrope Walk: Policy vs. Inflation
At the heart of global financial markets lies the Federal Reserve's monetary policy stance. With WTI trading around $80.56, the Fed's actions - or inactions - play a pivotal role. While the latest data might not be screaming for immediate rate hikes, the persistent concerns around inflation mean the Fed remains in a delicate balancing act. Should inflation prove stickier than anticipated, the Fed might be compelled to maintain a hawkish tone, potentially leading to higher interest rates for longer. This scenario typically strengthens the US Dollar, acting as a headwind for dollar-denominated commodities like oil. Conversely, any signs of inflation cooling could embolden the Fed to signal a pause or even future cuts, which would likely weaken the dollar and provide a tailwind for WTI. The MACD on the 1H chart is currently showing negative momentum, indicating a short-term bearish bias that could be exacerbated by hawkish Fed rhetoric. However, the positive momentum on the 4H and 1D charts suggests that the broader trend remains resilient, awaiting clearer policy signals.
Technical Signals: Decoding WTI's Price Action
Short-Term Oscillations: A Neutral Stance on the Hourly Chart
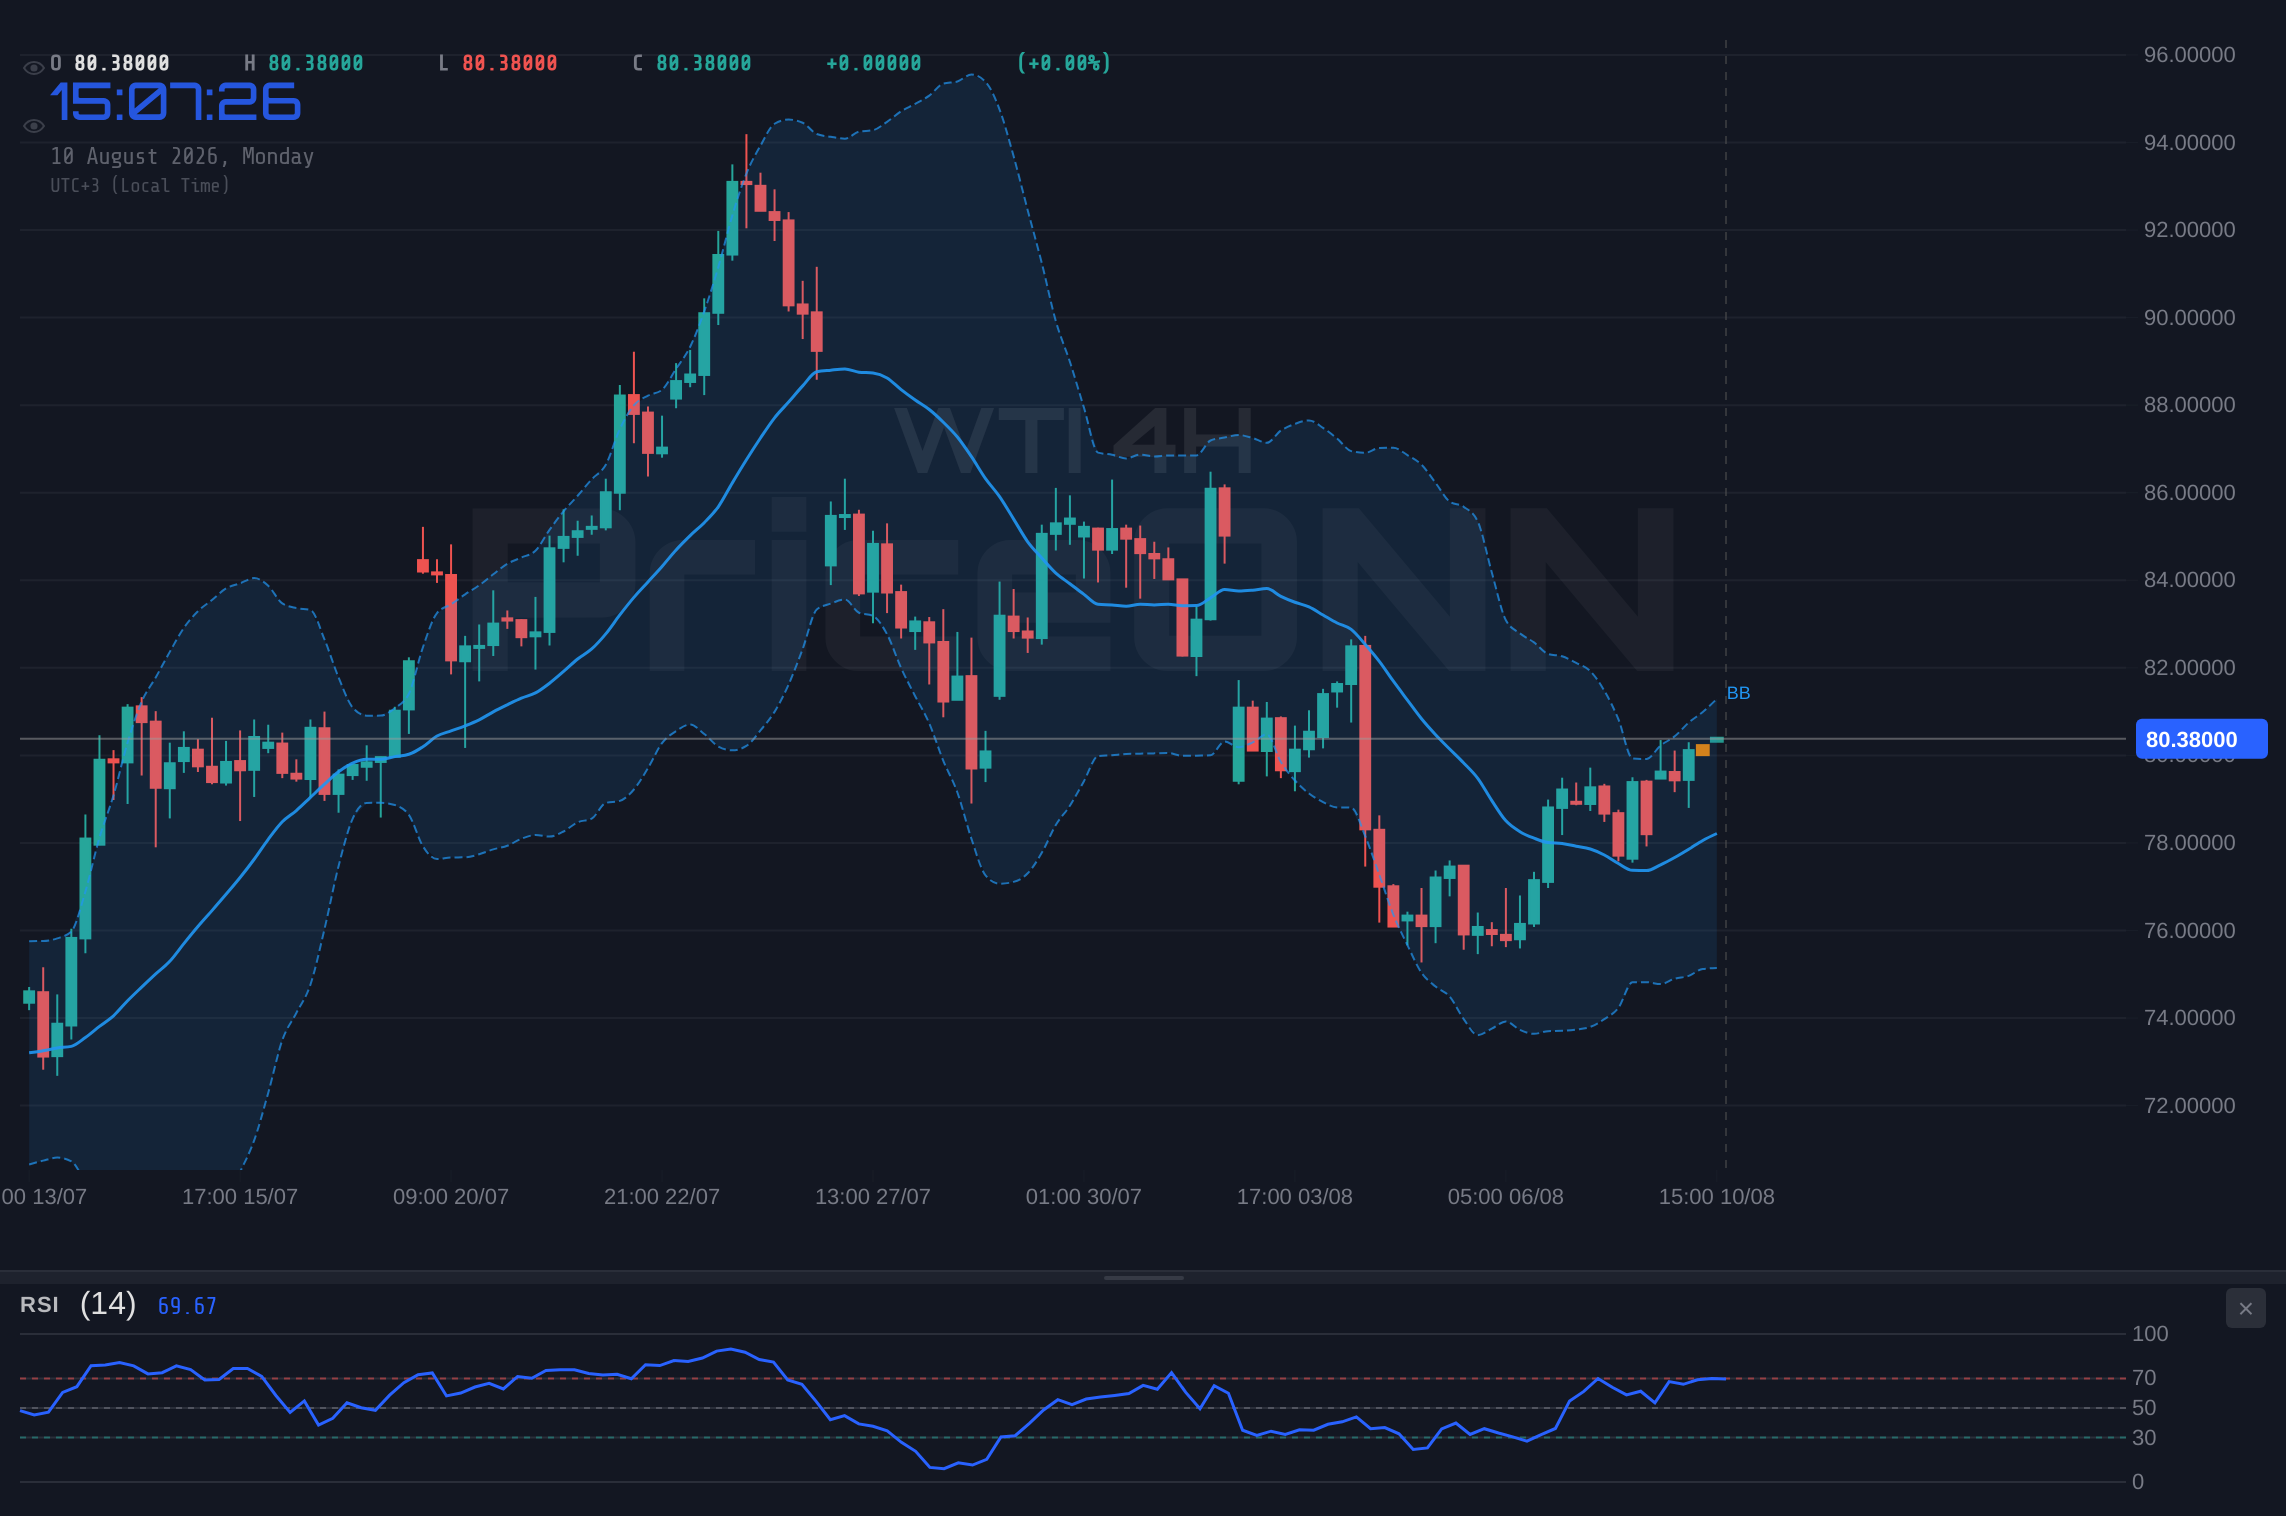
Examining the 1-hour chart for WTI, the picture is one of near-term equilibrium. The trend is currently classified as neutral, with a strength of 50%, reflecting a market in consolidation. The RSI(14) at 53.38 hovers in the neutral zone, showing a slight upward inclination, but not yet signaling any extreme overbought or oversold conditions. Similarly, the Stochastic oscillator, with K=44.91 and D=74.69, suggests a potential bearish signal as %K
Medium-Term Momentum: Bullish Undercurrents on the 4-Hour Chart
Stepping back to the 4-hour timeframe, the technical indicators paint a more constructive picture for WTI, currently priced at $80.56. The trend is identified as bullish with a robust strength of 100%. The RSI(14) is at 68.17, firmly in the neutral-to-bullish zone, suggesting upward momentum is present without being excessively overextended. The MACD is exhibiting positive momentum, with the MACD line positioned above the signal line, a classic bullish signal. Bollinger Bands are trading above the middle band, further supporting the bullish inclination. The Stochastic oscillator, while showing a potential dip with K=74.69 and D=78.28 (%K
Daily Perspective: Sustained Strength and Potential Upside
The daily chart provides a broader context for WTI's movements around the $80.56 mark. Here, the trend is also classified as neutral, with a strength of 50%, indicating that while the longer-term picture is not definitively bearish, it lacks the strong conviction seen on the 4-hour chart. However, several indicators point towards underlying bullish potential. The RSI(14) is at 64.77, well within the neutral zone and showing a clear upward eğilimi. The MACD is positive, with the MACD line above the signal line, reinforcing the bullish bias. The Bollinger Bands are trading above the upper band, which can sometimes signal an overbought condition, but in a strong trend, it can also indicate a powerful rally in progress. The Stochastic oscillator is showing a clear bullish signal with K=87.08 and D=65.97 (%K > %D), indicating strong buying pressure and potentially entering overbought territory, but still favoring upside. The ADX at 27.7 suggests a strong uptrend is developing or has been maintained. This daily view, despite the neutral trend classification, leans towards upside potential, suggesting that $80.56 could be a launching pad for further gains if key resistance levels are breached.
Economic Drivers and Correlations: The DXY Factor
The Dollar's Dominance: A Constant Companion to Oil
The US Dollar Index (DXY), currently trading around 99.75, acts as a crucial barometer for WTI crude oil's price trajectory. The inverse correlation is well-established: as the dollar strengthens, commodities priced in dollars, like oil, tend to become more expensive for holders of other currencies, potentially dampening demand and putting downward pressure on prices. Conversely, a weaker dollar typically makes oil cheaper, stimulating demand and supporting price increases. Currently, the DXY is showing a rising trend on the 1-hour chart (RSI 54.78, MACD positive) and a neutral stance on the 4-hour chart (RSI 45.67, MACD positive), but a strong bearish signal on the daily chart (RSI 38.85, MACD negative). This mixed picture suggests that while the dollar has shown some strength recently, its longer-term outlook might be softening. If the dollar begins to weaken significantly, especially on the daily timeframe where it shows a strong bearish trend with ADX at 28.34, it could provide a substantial tailwind for WTI, potentially pushing prices above the $80.56 level and beyond.
Correlation with Equities: Risk Appetite Matters
The relationship between oil prices and broader equity markets, such as the S&P 500 (currently at 6572.87) and Nasdaq 100 (at 29763.32), offers another layer of insight. Typically, a strong risk appetite, reflected in rising stock indices, often correlates with higher oil prices as investors anticipate increased economic activity and demand for energy. Conversely, a decline in equity markets can signal a 'risk-off' sentiment, leading investors to shed riskier assets, including oil, and seek refuge in safer havens. The current data shows the S&P 500 exhibiting a strong bullish trend on the 1H and 4H charts but a bearish trend on the daily, while Nasdaq 100 shows a strong bullish trend on the 4H and 1D. This divergence suggests underlying strength in tech but potential weakness in the broader market. If the equity markets were to experience a significant downturn, it could spill over into the oil market, creating selling pressure on WTI even if geopolitical supply concerns remain elevated. The current daily bearish trend for the S&P 500 warrants attention, as a sustained decline could challenge the bullish narrative for oil.
Upcoming Economic Catalysts: What to Watch
Inflation Data: The Fed's Main Concern
The upcoming inflation reports will be a critical determinant of WTI's near-term direction. Data such as the Consumer Price Index (CPI) and Personal Consumption Expenditures (PCE) price index are closely watched by the Federal Reserve for signs of persistent inflationary pressures. If these figures come in hotter than expected, it could reinforce the Fed's resolve to maintain higher interest rates, strengthening the dollar and potentially capping oil gains around the $80.56 level. Conversely, a significant cooling in inflation would increase the likelihood of a Fed pivot, weakening the dollar and providing a strong bullish catalyst for WTI. Traders will be dissecting not just the headline numbers but also the core inflation readings and underlying components to gauge the true state of price pressures.
Employment Figures: Gauging Economic Health
Alongside inflation, employment data, including Non-Farm Payrolls (NFP) and unemployment rate figures, are crucial for assessing the overall health of the economy. Strong employment numbers can signal robust economic activity, potentially boosting oil demand and supporting prices. However, exceptionally strong jobs reports could also raise inflation concerns, leading to a hawkish Fed response and a stronger dollar, creating a mixed signal for oil. Weak employment data, on the other hand, might signal an economic slowdown, which could dampen oil demand. The recent NFP news mentioned in the provided context suggests a potential weakening, which could influence Fed bets. Traders will be analyzing these reports for clues about consumer spending power and the overall economic trajectory, which directly impacts energy consumption.
Scenario Analysis for WTI Crude Oil
Bearish Scenario: Dollar Strength and Macro Headwinds
55% ProbabilityBullish Scenario: Geopolitical Fears and Favorable Data
35% ProbabilityNeutral Scenario: Consolidation and Waiting Game
10% ProbabilityExpert's Take: Balancing Risk and Opportunity
Frequently Asked Questions: WTI Analysis
What happens if WTI breaks above the $80.76 resistance level?
A decisive break above $80.76, especially with strong volume and escalating geopolitical concerns, could trigger a bullish run. This scenario might target the daily resistance at $82.72, potentially extending towards the 4H resistance at $83.82 if momentum persists.
Should I buy WTI at current levels of $80.56 given the mixed technical signals?
Buying at $80.56 requires careful risk management. The 4H and 1D charts show bullish undertones with ADX readings of 21.58 and 19.63, respectively, but the 1H chart is neutral. A more prudent approach might be to wait for confirmation, such as a hold above $80.76 or a pullback to a stronger support level like $80.11, before entering a long position.
Is the RSI at 64.77 on the daily chart a buy or sell signal for WTI?
An RSI of 64.77 on the daily chart is considered neutral, leaning towards bullish. It indicates upward momentum without being excessively overbought. This reading suggests the current trend has room to continue, but it doesn't provide a definitive buy signal on its own and should be considered alongside other indicators and price action.
How will upcoming inflation data affect WTI crude oil prices around $80.56?
Higher-than-expected inflation data could lead to a stronger dollar and cap oil gains around $80.56, as the Fed might maintain a hawkish stance. Conversely, cooling inflation could weaken the dollar, providing a bullish catalyst for WTI to potentially break higher, targeting resistance levels above $80.76.
Track markets in real-time
AI-powered analysis, technical indicators and real-time price data.
Join Our Telegram Channel
Breaking market news, AI analysis and trading signals instantly.
Join Channel