

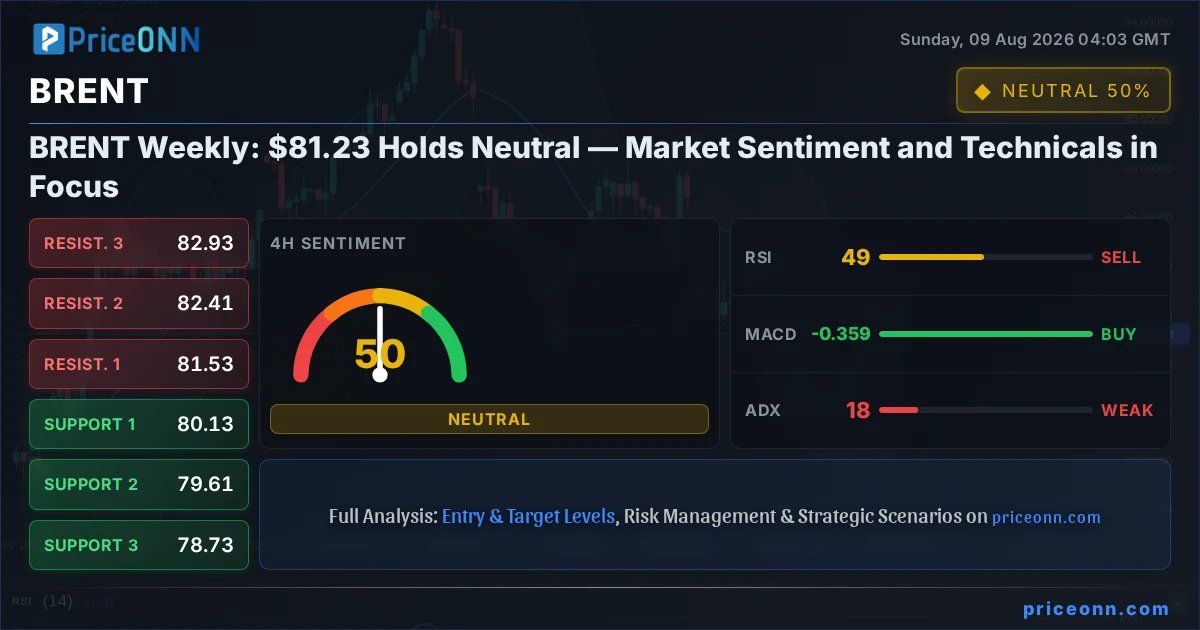
As the market digests a turbulent week marked by a surprising US jobs report and shifting Federal Reserve expectations, the oil complex, particularly BRENT crude, finds itself at a critical juncture. Last Friday's close saw BRENT settling around the $81.23 mark, a level that has become a focal point for traders navigating a landscape of geopolitical tensions and evolving macroeconomic narratives. The July Non-Farm Payrolls (NFP) report, which unexpectedly showed job losses, sent ripples through financial markets, impacting everything from currency valuations to commodity prices. This data point not only flipped some bets on September Fed rate hikes but also underscored the complex interplay between economic data, central bank policy, and the price of black gold. Understanding where BRENT goes from here requires a deep dive into the confluence of these factors, examining not just the technical charts but the underlying fundamental forces shaping the energy market's outlook.
- BRENT crude is holding the $81.23 level after a week of mixed signals, with the ADX at 18.16 indicating a ranging market.
- The recent US Non-Farm Payrolls report showed a surprising loss of 23,000 jobs, impacting Fed rate hike expectations and the US Dollar Index (DXY), currently at 99.55.
- Geopolitical risks, particularly surrounding the Strait of Hormuz and US-Iran relations, remain a background support for oil prices, despite easing peace deal optimism.
- Key support for BRENT lies near $80.13, while resistance is eyed around $81.53, as per the provided market data.
Navigating the Crosscurrents: Macro Drivers and BRENT's Correlation
The past week has been a masterclass in market correlation, with the US Dollar Index (DXY) at 99.55 acting as a primary barometer for risk sentiment and commodity price direction. The unexpected weakness in the July NFP report, which saw a decline of 23,000 jobs against forecasts of an 83,000 increase, sent the DXY lower. This inverse relationship is a cornerstone of commodity trading; as the dollar weakens, assets priced in dollars, like BRENT crude, tend to become more attractive to foreign buyers, potentially driving up demand and prices. However, the narrative is rarely that simple. While the weak jobs data might suggest a softer US economy, potentially dampening oil demand, it simultaneously reduces the immediate pressure on the Federal Reserve to continue aggressive interest rate hikes. This nuanced effect means that while a weaker dollar might offer some support to BRENT, concerns about global economic growth could cap any significant upward momentum.
This delicate balance was evident in the market's reaction. While the dollar dipped, the anticipated impact on oil prices was somewhat muted, reflecting underlying concerns about demand sustainability. The market's interpretation of the NFP report was not a straightforward 'risk-on' signal that would typically boost commodities. Instead, it highlighted a growing divergence between the equity markets, where the S&P 500 at 6572.87 and Nasdaq 100 at 29708.86 showed resilience, and the bond market, which re-priced Fed rate hike probabilities. This divergence suggests that while equities might be driven by other factors, such as corporate earnings or specific sector strength, commodities like BRENT are more sensitive to the broader economic growth outlook and the implied path of monetary policy. The ADX on the 1-hour chart for BRENT at 29.28 indicates a strong downtrend, but this is countered by the 4-hour ADX of 18.16, signaling a weaker, more range-bound environment, highlighting the indecision.
Furthermore, the relationship between oil prices and inflation expectations cannot be overstated. While lower interest rates could theoretically spur economic activity and thus demand for energy, the lingering specter of inflation remains a key consideration for central banks. If the market perceives that lower rates could reignite inflationary pressures, it complicates the outlook. For BRENT, this means that even if the dollar weakens due to dovish Fed expectations, persistent inflation concerns could limit the upside potential. The interplay between these macro factors creates a complex trading environment, where price action is driven by a constant recalibration of economic growth prospects, monetary policy, and geopolitical risk premiums. The current neutral signal for BRENT across multiple timeframes, with the 1H and 1D showing a 'SELL' and the 4H showing 'NEUTRAL', further underscores this ambiguity. The ADX readings are particularly telling: 29.28 (1H) suggests a strong downtrend, 18.16 (4H) points to a weak trend, and 21.05 (1D) indicates a moderate downtrend. This conflicting trend strength across timeframes necessitates a cautious approach.
Geopolitical Undercurrents: The Hormuz Factor and Supply-Side Risks
While macroeconomic data and central bank policy often dominate headlines, the undercurrent of geopolitical risk remains a persistent factor for BRENT crude. Recent news cycles have highlighted ongoing tensions, particularly concerning the Strait of Hormuz, a critical chokepoint for global oil supply. Reports, including those from PriceONN's market news, have touched upon efforts towards peace in the region and initiatives like Saudi Arabia's maritime coalition. However, the situation remains fluid. Any escalation or perceived threat to supply routes, especially through the Strait of Hormuz, can inject a significant risk premium into oil prices. This was a key theme discussed in PriceONN's analysis last week, where the market cheered potential reopening of Hormuz, yet BRENT struggled to break above $80, indicating that while de-escalation news can provide temporary relief, the underlying geopolitical fragility persists.
The recent reports of US-Iran peace deal optimism, while contributing to a temporary dip in oil prices on August 3rd according to PriceONN's news feed, should be viewed with caution. Geopolitical narratives are notoriously volatile, and shifts in diplomatic stances can be rapid. The warnings from Saudi Arabia and ongoing US-China tensions are not to be underestimated. These factors create a baseline level of uncertainty that supports oil prices, acting as a floor even when demand-side concerns are elevated. The fact that BRENT retreated from $100 levels previously, despite these tensions, suggests that demand-side worries have been more dominant recently. However, a sudden geopolitical flare-up could quickly shift the market's focus back to supply disruptions, leading to sharp price increases.
From a supply perspective, OPEC+ decisions and production adjustments continue to be closely watched. While the market has recently focused more on demand-side signals, any significant shift in OPEC+ output strategy could dramatically alter the supply-demand balance. Currently, the market seems to be pricing in existing supply levels, but any unexpected cuts or increases would likely trigger significant price volatility. The ADX on the daily chart for BRENT at 21.05 suggests a moderate downtrend, but its weakness implies that the trend is not strongly established, making it susceptible to shifts in geopolitical sentiment or supply news. The RSI at 46.51 on the daily chart indicates a bearish lean, but it's far from oversold territory, leaving room for further downside if demand falters or geopolitical risks subside significantly.
Technical Landscape: BRENT at $81.23 - A Neutral Stance
From a purely technical standpoint, BRENT crude trading at $81.23 presents a picture of indecision across multiple timeframes. On the 1-hour chart, the trend is described as neutral with a power of 50%, supported by an ADX of 29.28, indicating a strong downtrend, but this is contradicted by the 4-hour ADX of 18.16, suggesting a weak trend. The RSI(14) at 47.69 on the 1H chart leans bearish, while the Stochastic indicator shows a potential dip with %K
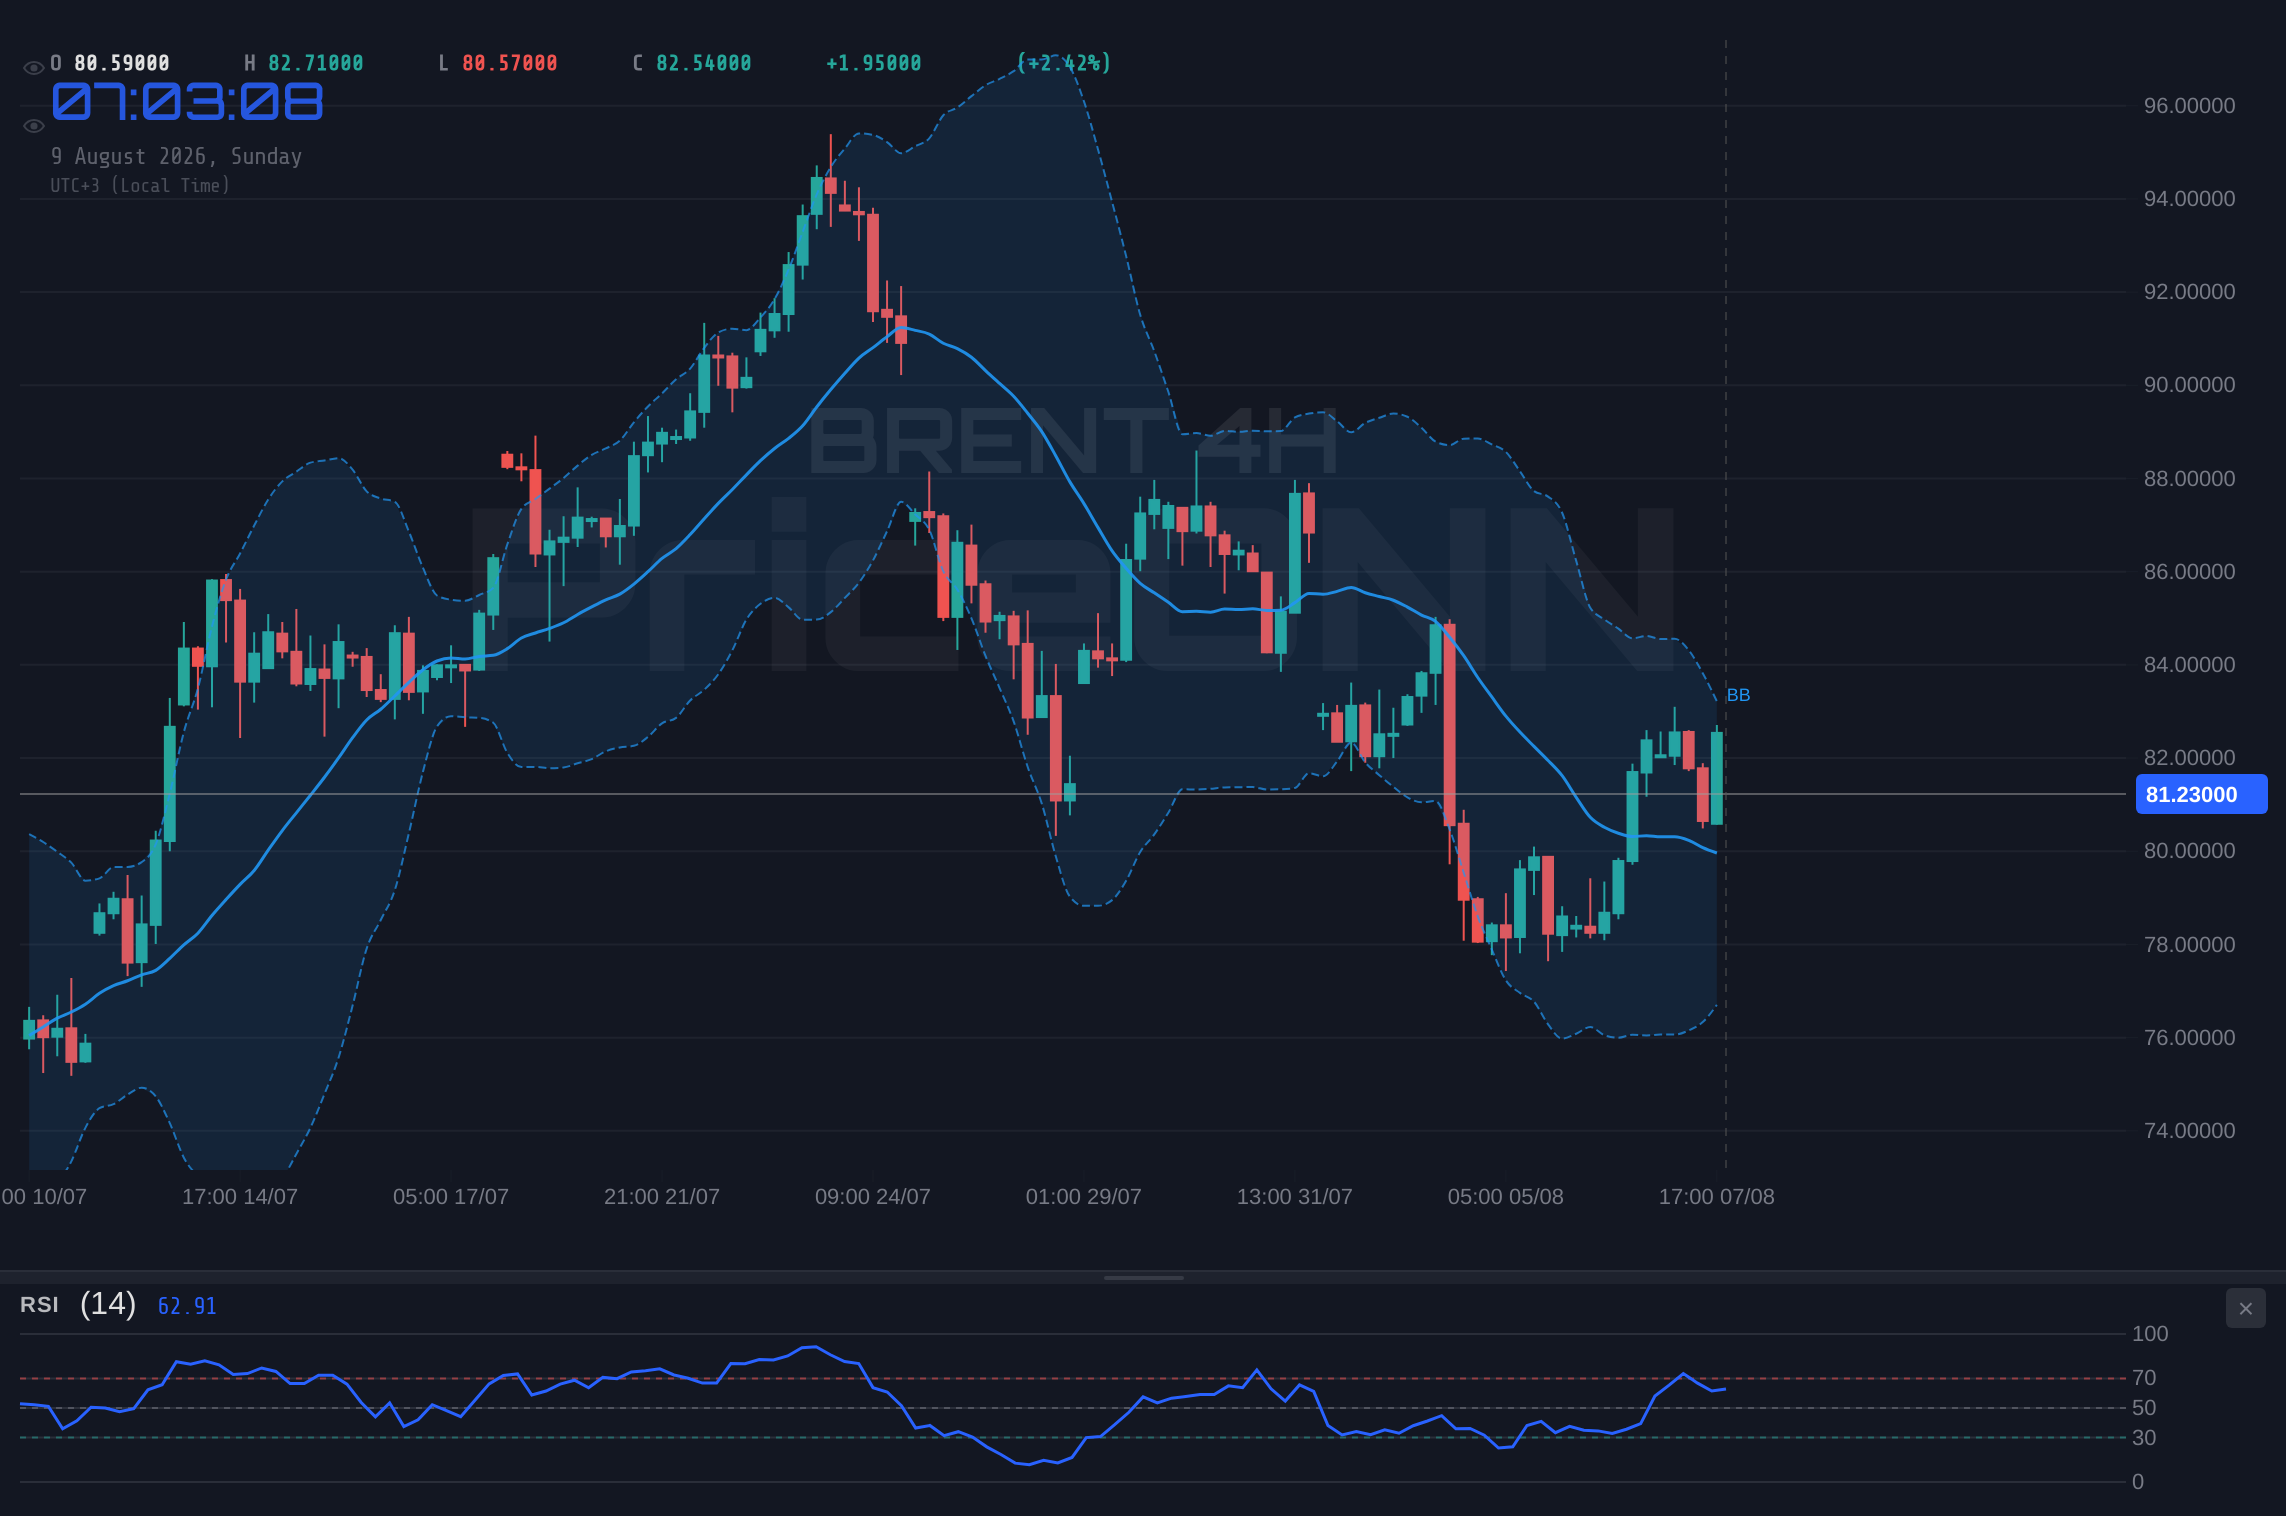
The 4-hour timeframe offers a slightly different perspective, yet still points towards neutrality. The trend is rated at 50% power, with an ADX of 18.16, signaling a weak trend. The RSI(14) is at 49.39, also indicating a bearish lean, but the Stochastic is showing a potential reversal with %K > %D. Price action is above the middle Bollinger Band, hinting at a potential upward movement, but the MACD shows positive momentum. This mixed signal, where shorter-term bearish indicators are countered by longer-term neutral to slightly bullish signals, creates a challenging environment for clear directional trades. The overall signal for BRENT on the 4H timeframe is NEUTRAL (Al: 4, Sat: 4, Nötr: 0), perfectly encapsulating the current market indecision.
On the daily chart, the picture remains muddled. The trend is deemed neutral with 50% power, and the ADX at 21.05 suggests a moderate downtrend. The RSI(14) sits at 46.51, reinforcing the bearish sentiment, while the Stochastic is showing a potential upward move with %K > %D. The MACD is in negative territory, indicating bearish momentum. The Bollinger Bands are below the middle band, aligning with the bearish outlook. The overall signal for BRENT on the daily chart is SAT (Al: 1, Sat: 7, Nötr: 0). This confluence of neutral to bearish signals across the daily timeframe, coupled with the indecision on shorter timeframes, suggests that BRENT is currently range-bound, awaiting a catalyst to break the stalemate. Key support levels are identified at $80.13, $79.61, and $78.73, while resistance is eyed at $81.53, $82.41, and $82.93. The current price of $81.23 sits squarely within this range, making it a critical pivot point.
The weak trend indicated by the ADX on the 4-hour chart (18.16) and moderate downtrend on the daily chart (21.05) means that any directional move may lack strong conviction initially. This is the environment where stop hunts and liquidity grabs can occur, as the market probes both sides of the range. Traders need to be particularly vigilant for false breakouts or breakdowns. The fact that BRENT is holding $81.23 is significant, as it represents a level where both buyers and sellers have shown interest. A decisive move above the immediate resistance at $81.53 could signal a test of higher levels, potentially targeting $82.41. Conversely, a break below the support at $80.13 could open the door for a move towards $79.61, but the low ADX values suggest such moves might lack follow-through without a significant fundamental shift.
Intermarket Dynamics: Equities, Bonds, and the Dollar's Influence
The broader market context provided by indices like the S&P 500 (6572.87) and Nasdaq 100 (29708.86) is crucial for understanding BRENT's potential trajectory. The resilience shown by these equity indices, despite the weak NFP data, suggests that the market might be pricing in a 'higher for longer' interest rate scenario or is simply shrugging off the employment figures in favor of other positive economic indicators or corporate performance. This 'risk-on' sentiment in equities can sometimes translate to commodities, as investors seek higher yields and growth assets. However, the simultaneous weakness in the DXY at 99.55 complicates this picture. Typically, a weaker dollar and stronger equities would be a bullish cocktail for oil. Yet, BRENT's inability to decisively break higher indicates that demand-side concerns or specific supply-side narratives are playing a more dominant role.
The bond market's reaction, with potential shifts in Fed rate hike expectations, also plays a critical role. If the market begins to price out future rate hikes more aggressively, it could lead to a broader weakening of the US dollar, which, as mentioned, is generally supportive of oil prices. However, the Federal Reserve's communication remains key. Any hawkish undertones from Fed officials, even in the face of weak data, could quickly reverse dollar weakness and put pressure back on commodities. The recent PriceONN blog posts and market news have alluded to the market being 'trapped in a tug-of-war,' a sentiment that perfectly describes the current situation where conflicting data points and central bank signals create a stalemate. The ADX on the 1H BRENT chart at 29.28, while indicating a strong trend, is likely capturing short-term volatility rather than a sustained directional move.
The interplay between these different asset classes - equities showing strength, the dollar showing weakness, and oil prices consolidating - highlights a market that is searching for direction. The upcoming week, with US CPI data and the BoJ Summary of Opinions on the economic calendar, will be critical in shaping these intermarket dynamics. Inflation data, in particular, will guide Fed rate hike expectations and, consequently, the dollar's path and its impact on BRENT. If inflation proves to be stickier than expected, it could reignite hawkish Fed sentiment, strengthen the dollar, and put downward pressure on oil. Conversely, signs of cooling inflation could solidify the 'Fed pause' narrative, weaken the dollar further, and potentially offer a more supportive environment for BRENT, provided demand concerns do not dominate.
Looking Ahead: Key Events and Levels to Watch
As we step into the new trading week, the focus for BRENT crude remains on the $81.23 level and the broader interplay of macroeconomic forces. The technical picture, characterized by mixed signals across timeframes and a weak trend strength indicated by ADX values, suggests that BRENT is likely to remain range-bound until a significant catalyst emerges. The support at $80.13 and resistance at $81.53 are the immediate levels to watch. A decisive break above $81.53, especially with increasing volume and positive correlation with a weaker dollar and stronger equities, could signal a move towards the next resistance at $82.41. However, given the current market indecision and the ADX readings, such a breakout might face immediate profit-taking.
Conversely, a failure to hold the $81.23 level and a subsequent break below the support at $80.13 could lead to a test of lower levels, potentially targeting $79.61. This scenario would likely be driven by escalating demand-side concerns, a significant reduction in geopolitical risk premiums, or a hawkish shift from the Federal Reserve. The weak trend strength suggested by the ADX values across timeframes implies that such moves might not be sharp or sustained without a fundamental shock. Traders should be wary of false signals and wait for confirmation on higher timeframes before committing to a directional trade.
The economic calendar for the upcoming week is crucial. US inflation data (CPI) will be a key driver for Fed policy expectations, which in turn will influence the DXY and, consequently, BRENT. The Bank of Japan's (BoJ) Summary of Opinions could also provide insights into the Yen's direction, impacting global currency flows. For BRENT traders, the primary focus will be on how these events influence the broader risk sentiment and the dollar's strength. Geopolitical developments, particularly concerning the Strait of Hormuz, remain a wildcard that could quickly override macroeconomic considerations and inject significant volatility into oil prices. The market's ability to hold $81.23 will be the immediate test, with the levels around $80.13 and $81.53 acting as critical decision points in the short term.
Bearish Scenario: Range Breakdown
60% ProbabilityNeutral Scenario: Consolidation Around $81.23
30% ProbabilityBullish Scenario: Breakout Above Resistance
10% ProbabilityFrequently Asked Questions: BRENT Analysis
What happens if BRENT breaks below the $80.13 support level, given the current ADX reading?
A break below $80.13 on the 4-hour chart, especially with confirmation, could signal a move towards $79.61. However, the weak trend indicated by the ADX at 18.16 suggests this move might lack strong follow-through without a significant fundamental catalyst.
Should I consider buying BRENT at the current $81.23 level, with RSI at 47.69 and DXY at 99.55?
Buying at $81.23 carries risk given the bearish lean from the 1H RSI and the neutral outlook. While a weaker dollar at 99.55 could offer some support, the overall market indecision and mixed signals suggest caution. A more compelling bullish setup would require a clear break above $81.53 resistance.
Is the RSI at 46.51 on the daily chart a sell signal for BRENT right now?
An RSI of 46.51 on the daily chart leans bearish but is not in oversold territory. It suggests a downward bias but doesn't necessarily signal an immediate sell. This reading, combined with a moderate downtrend ADX of 21.05, indicates potential for further downside, but confirmation below key support levels is needed.
How will upcoming US CPI data affect BRENT this week, given the current market consolidation around $81.23?
Higher-than-expected CPI could reignite hawkish Fed sentiment, strengthen the DXY, and pressure BRENT. Conversely, cooler inflation might solidify a Fed pause, weaken the dollar, and potentially support oil if demand concerns don't dominate. The market is currently consolidating, awaiting this crucial data to break the stalemate.
Technical Outlook Summary
| Indicator | Value | Signal | Interpretation |
|---|---|---|---|
| RSI (14) | 46.51 | Bearish | Daily RSI suggests downward bias; not oversold. |
| MACD Histogram | Negative | Bearish | Confirms bearish momentum on daily chart. |
| Stochastic | K=28.41, D=26.51 | Bullish Divergence | Suggests potential upward move despite bearish signals. |
| ADX | 21.05 | Moderate Trend | Daily trend is moderate downtrend; susceptible to shifts. |
| Bollinger Bands | Below Mid-Band | Bearish Inclination | Price below middle band indicates bearish pressure. |
Key Levels for BRENT Crude
Support Levels
Resistance Levels
Track markets in real-time
AI-powered analysis, technical indicators and real-time price data.
Join Our Telegram Channel
Breaking market news, AI analysis and trading signals instantly.
Join Channel