

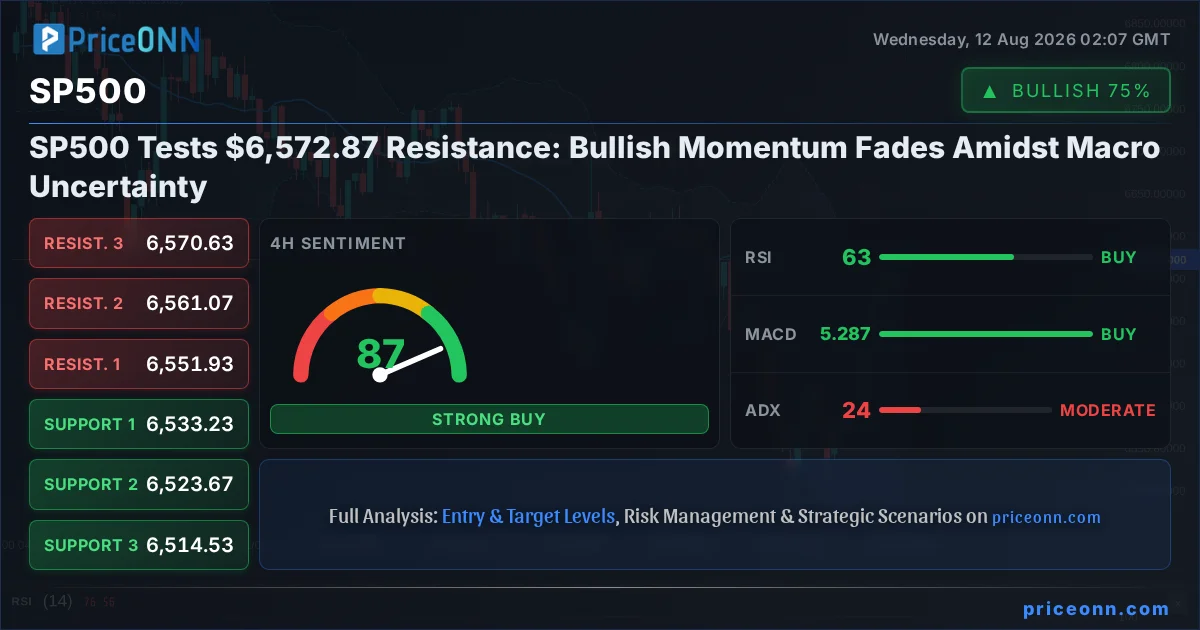
The relentless march of the SP500 has brought it to the cusp of new highs, currently testing resistance around the $6,572.87 mark. This ascent, fueled by a potent mix of strong corporate earnings and a generally positive risk sentiment, has captivated market participants. However, a closer examination of the technical landscape, coupled with prevailing macroeconomic undercurrents and intermarket dynamics, reveals a more nuanced picture. The question on many traders' minds is whether this bullish momentum can be sustained, or if the market is poised for a correction as key economic indicators loom. Understanding the interplay between the SP500, the Dollar Index (DXY), commodity prices, and global risk appetite is crucial for navigating the choppy waters ahead.
- The SP500 is testing resistance at $6,572.87, with the RSI at 70.95 signaling potential overbought conditions on the 1-hour chart.
- Critical support for the SP500 is identified at $6,526.53, a level that has shown resilience in recent trading sessions.
- The MACD histogram on the 1-hour chart shows negative momentum, suggesting that bullish conviction may be waning despite the price push higher.
- The correlation with DXY, currently at 99.89, is a key factor, with dollar strength often posing a headwind for US equities.
The current market environment presents a fascinating dichotomy. On one hand, the SP500 has demonstrated remarkable resilience, pushing higher even as some technical indicators flash cautionary signals. The 1-hour chart, for instance, shows the index trading at $6,572.87, with an RSI of 70.95. While this is not yet in extreme territory, readings above 70 often precede a period of consolidation or a pullback as the market digests recent gains. The MACD histogram, currently displaying negative momentum on this timeframe, further supports the notion that the upward thrust might be losing steam. However, the ADX at 49.72 on the 1-hour chart indicates a strong existing trend, complicating the interpretation. This divergence between momentum and trend strength is a classic sign of a market at a potential inflection point, where conviction is being tested.
Adding another layer to this complexity is the broader macroeconomic backdrop and its influence on risk sentiment. The Dollar Index (DXY) currently stands at 99.89, showing a slight upward bias. Historically, a stronger dollar often correlates with pressure on US equities, as it makes American goods more expensive for foreign buyers and can signal tighter global liquidity. While the SP500 has managed to climb despite this, sustained dollar strength could become a significant headwind. Furthermore, the recent movements in oil prices, with Brent Crude at $87.90 and WTI at $84.60, point towards elevated inflation expectations or geopolitical tensions. Rising energy costs can squeeze corporate profit margins and consumer spending, potentially dampening the enthusiasm for riskier assets like stocks.
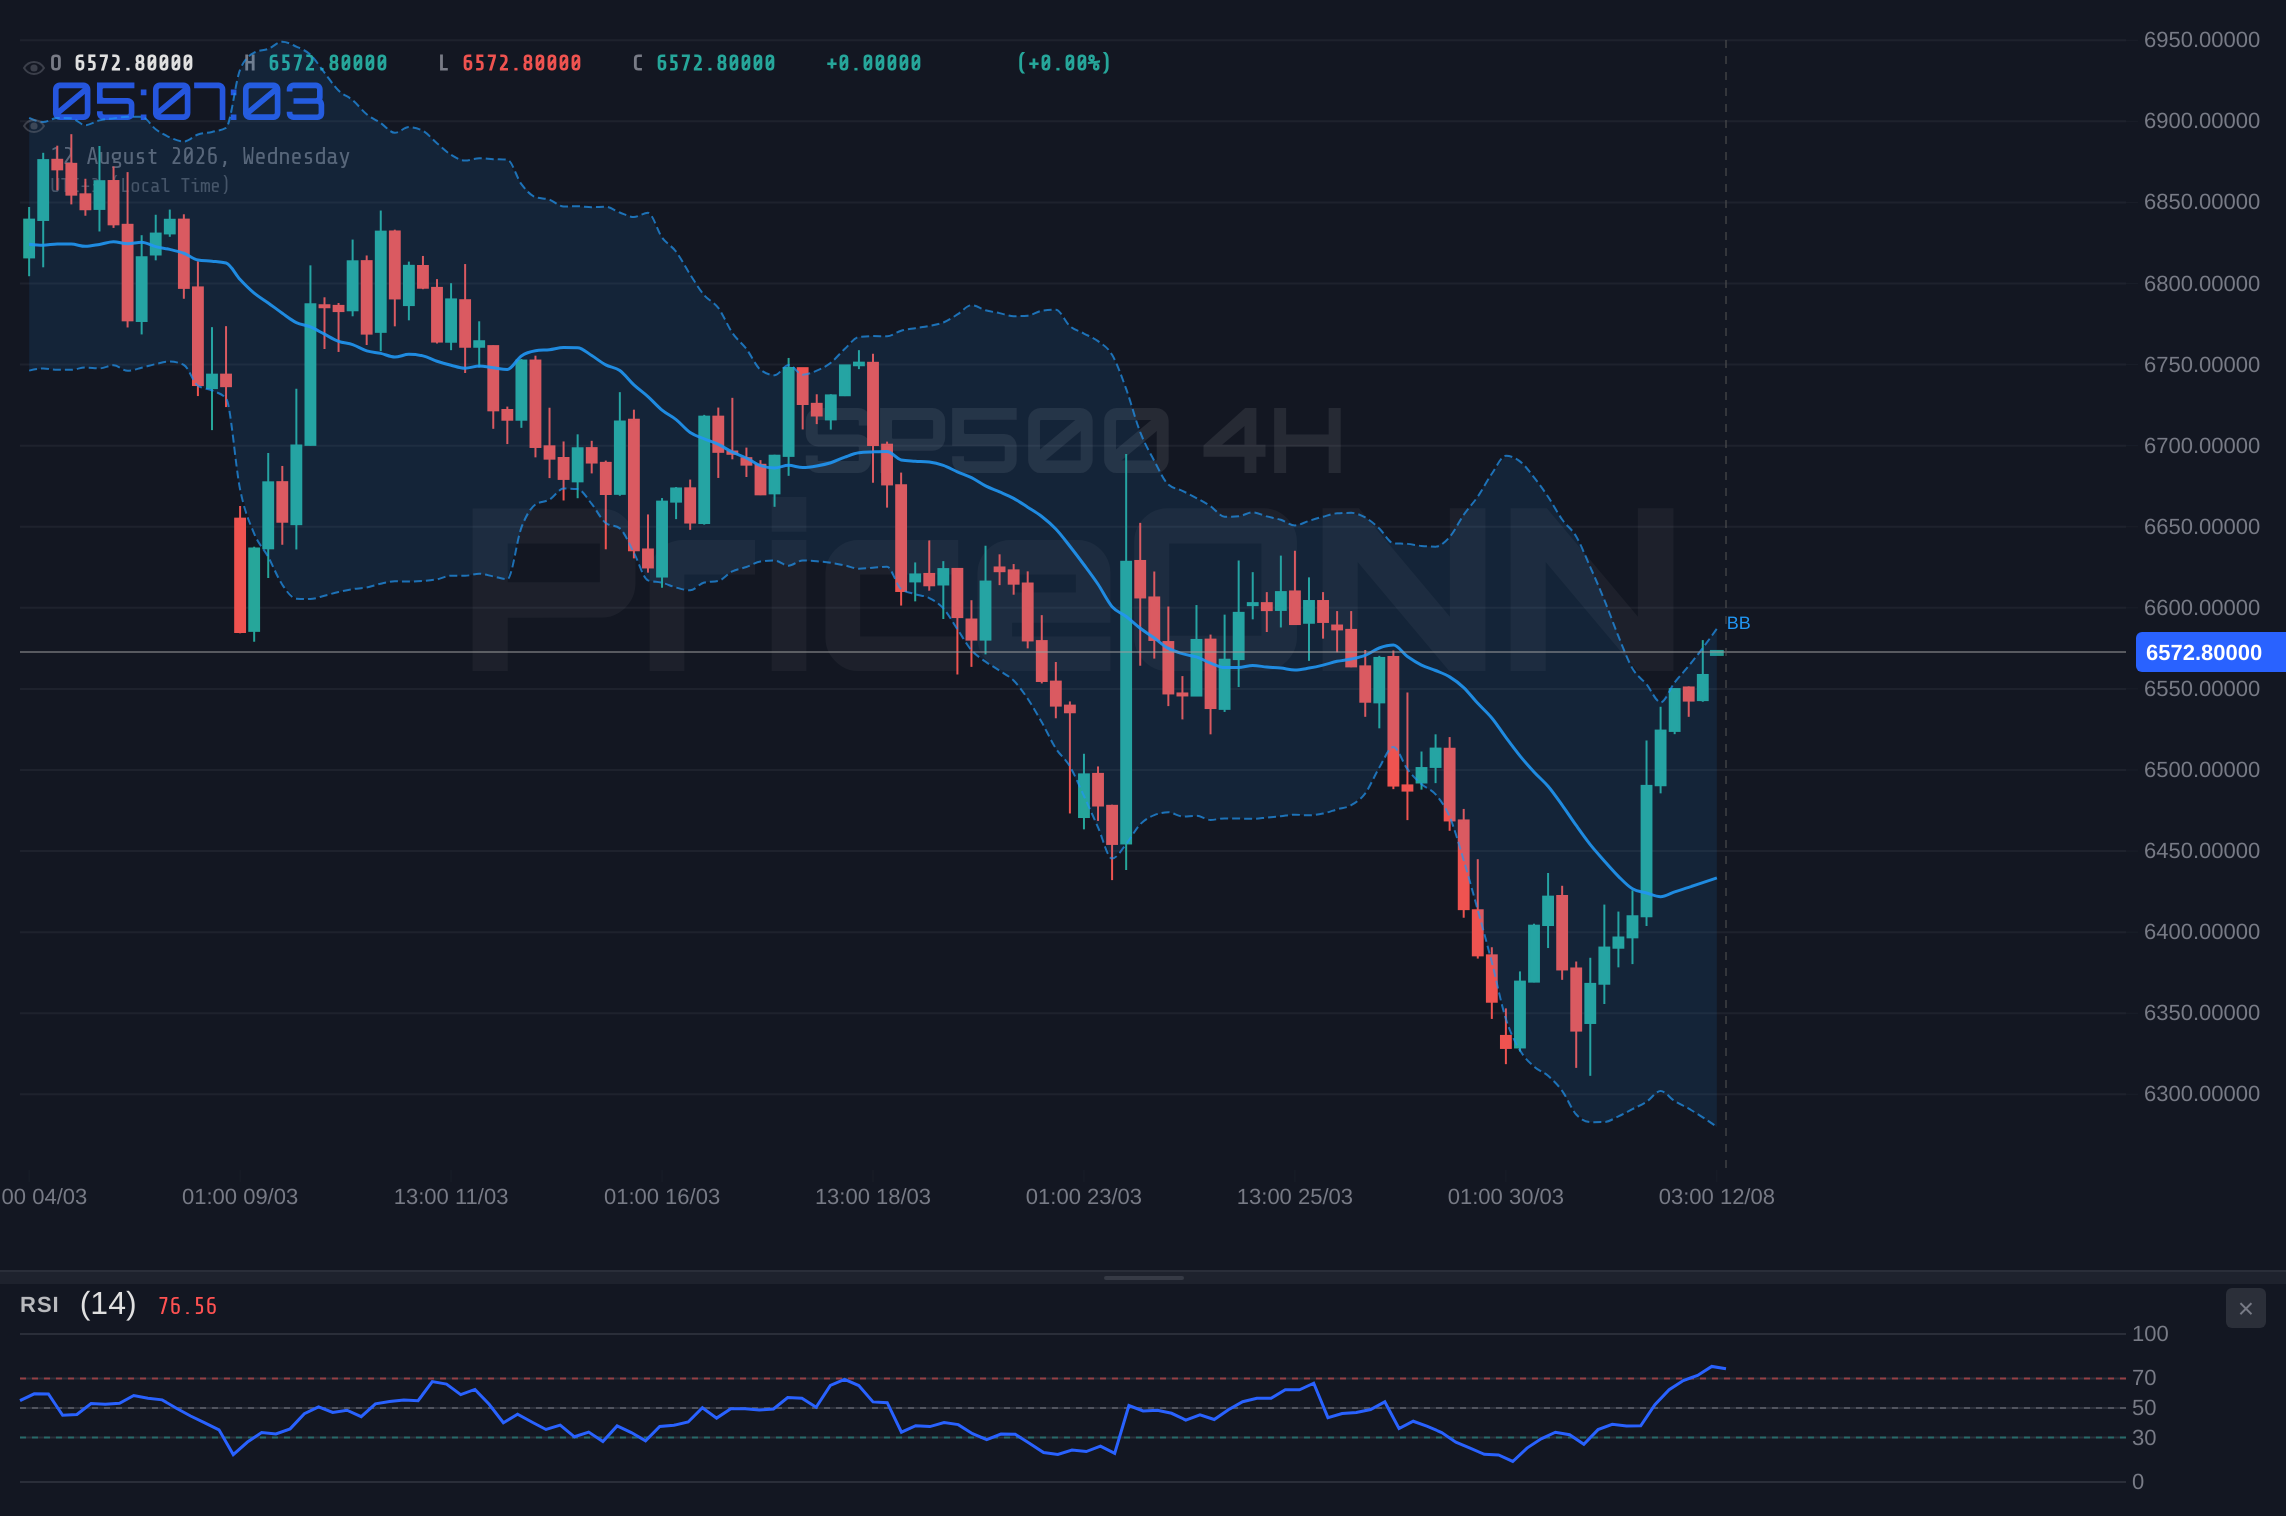
Navigating the Cross-Market Currents
The interconnectedness of global markets means that movements in one asset class invariably ripple through others. The SP500's current position near resistance at $6,572.87 is being watched closely in correlation with other major indices and commodities. While the SP500 and Nasdaq 100 are showing mixed signals on the daily charts, with the Nasdaq at 29,557.26 exhibiting a bearish bias on the 1-hour timeframe, the Dow Jones Industrial Average, trading at 53,765.50, also shows a bearish trend on the 1-hour chart. This divergence within the US equity complex itself warrants attention. A broad-based decline in risk appetite, often signaled by a sell-off in the Nasdaq or a dip in the SP500 below key support levels like $6,526.53, could lead to a flight towards safe-haven assets. Gold, currently near $4,395.61, and the Japanese Yen, although not explicitly detailed in the provided data for USDJPY's current price, often benefit from such shifts.
The interplay between the US dollar and major currency pairs also provides critical context. EURUSD is trading at 1.15373, showing a neutral to slightly bearish tone on the 1-hour chart, while USDJPY is at 159.365, exhibiting a bullish trend on the 1-hour. This suggests that while the dollar might be finding some footing against the Euro, it's strengthening against the Yen. This dynamic is crucial because a stronger dollar can put pressure on multinational corporations within the SP500, whose overseas earnings are worth less when repatriated. Conversely, a weaker dollar can boost these earnings, providing a tailwind for the index. Traders are meticulously dissecting these cross-asset relationships to gauge the true underlying strength of the market's advance.
The recent news flow, including reports of gold nearing two-month highs ahead of CPI data and discussions around USD/JPY trading strategies post-US-Japan intervention, underscores the sensitivity of markets to upcoming economic releases and geopolitical developments. While the SP500's immediate reaction to such news might seem muted, the underlying sentiment shifts can have a profound impact on its trajectory over the medium term. The market's current positioning suggests a degree of optimism, but this could quickly evaporate if inflation data proves stubborn or if geopolitical risks escalate. The resilience of oil prices, for example, serves as a constant reminder of the potential inflationary pressures that could force central banks to reconsider their monetary policy stances.
Technical Confluence: Signals and Counter-Signals
Delving deeper into the SP500's technicals, the 4-hour chart presents a slightly more constructive picture than the 1-hour, although not without its own caveats. The trend is considered neutral with a strength of 50%, but the RSI at 62.83 remains in bullish territory, and the MACD shows positive momentum. However, the Stochastic oscillator is flashing an overbought signal with K=97.85 and D=86.96, a stark contrast to the 1-hour chart's more nuanced reading. This overbought condition, especially when coupled with the ADX at 24.23 indicating a moderate trend, suggests that the upside may be limited in the short term. The confluence of these indicators points towards a potential period of consolidation or a minor pullback before any significant continuation higher or lower.
On the daily timeframe, the SP500's trend is classified as bearish with a strength of 100%, which seems to contradict the current price action. This is a critical point of analysis. The price is currently at $6,572.87, but the daily support levels are significantly lower, with the first major support at $6,377.47. The daily ADX at 47.51 confirms a strong downward trend, yet the price is pushing higher. This could indicate a bear market rally, where prices temporarily move against the dominant trend, or it could signal a potential reversal if key resistance levels are decisively broken. The daily RSI at 45.35 is in neutral territory but trending downwards, while the MACD shows negative momentum. The Stochastic, however, is showing a potential bullish signal with K=42.97 and D=29.88, adding to the conflicting signals that traders must navigate.
The divergence between the short-term (1H/4H) bullish leanings and the long-term (1D) bearish trend is the crux of the current market puzzle. The SP500's ability to test resistance at $6,572.87 while the daily chart screams 'bear trend' suggests that short-term sentiment or specific catalysts are currently overriding the longer-term technical picture. This often occurs in volatile markets or during periods of significant economic uncertainty. Traders must remain vigilant, recognizing that a daily trend is a more robust indicator of sustained direction than shorter timeframes. A decisive close above the daily resistance at $6,605.07 would be required to challenge the prevailing bearish sentiment on the daily chart.
Macroeconomic Catalysts and Market Reactions
Looking ahead, the economic calendar is a critical factor that will likely dictate the SP500's next move. Upcoming inflation reports, such as the CPI data mentioned in recent news, carry immense weight. If inflation proves to be more persistent than expected, it could force the Federal Reserve to maintain a hawkish stance or even consider further rate hikes, which would typically be negative for equities. Conversely, a significant cooling in inflation could pave the way for interest rate cuts, a scenario that would likely boost the SP500. The market's reaction to these data points will be heavily influenced by current expectations, meaning any deviation could trigger substantial volatility. The correlation between the SP500 and the DXY at 99.89 will be key to watch; a strong dollar response to inflation data could amplify downside pressure on the index.
Central bank policy remains a dominant theme. While specific Fed meeting minutes or rate decisions are not provided in the live data, the general market sentiment often reflects expectations about future monetary policy. If traders perceive a hawkish tilt from the Fed, it could lead to a tightening of financial conditions, impacting borrowing costs for corporations and potentially slowing economic growth. This would weigh on the SP500. Conversely, any hint of a dovish pivot - perhaps signaled by comments from Fed officials or shifts in Fed Fund Futures pricing - could fuel further rallies. The current neutral to slightly bearish signals on the 1-hour and 4-hour charts for EURUSD (1.15373) and the bearish bias for USDJPY (159.365) on the daily chart suggest a complex global currency landscape that adds to the overall uncertainty.
Geopolitical risks also continue to cast a shadow. While the provided data doesn't detail specific events, ongoing global tensions can quickly shift market sentiment from risk-on to risk-off. Events that increase global uncertainty, such as escalations in the Middle East or major political developments in key economies, can lead to a sell-off in equities as investors seek refuge in safer assets like gold (currently $4,395.61) or US Treasuries. The current strength in oil prices ($87.90 for Brent) could be partially attributed to such geopolitical considerations, adding an inflationary risk premium to the market. Traders must remain attuned to headlines that could trigger a sudden reversal in risk appetite, potentially invalidating short-term bullish setups on the SP500.
Trade Scenarios and Strategic Considerations
Given the conflicting signals and the critical resistance level at $6,572.87, a multi-scenario approach is prudent. The current ADX of 24.23 on the 4-hour chart suggests a moderate trend strength, meaning a breakout could be significant, but the weak trend on the 1-hour (ADX: 13.09) indicates the current move lacks strong conviction.
Bearish Scenario: Pullback to Support Levels
65% ProbabilityNeutral Scenario: Consolidation Around Resistance
25% ProbabilityBullish Scenario: Breakout Above Resistance
10% ProbabilityThe immediate focus remains on the $6,572.87 resistance level. A failure to break through this point, especially with the conflicting signals from the 1-hour and daily charts, increases the probability of a pullback. Traders should pay close attention to the support at $6,547.63 and the more significant daily support at $6,377.47. Confirmation of a bearish move would likely come from a sustained break below these levels, potentially amplified by negative economic data or a shift in risk sentiment. Conversely, a strong breakout above $6,572.87, ideally confirmed by increasing volume and positive follow-through on shorter timeframes, could signal the continuation of the upward trend, although the daily bearish trend remains a significant caveat.
The Road Ahead: What to Watch
As the SP500 navigates this critical juncture around $6,572.87, several factors will be paramount. The upcoming economic data releases, particularly inflation figures, will be a major catalyst. Market participants will be dissecting these numbers for clues about the Federal Reserve's future monetary policy path. Any indication of persistent inflation could trigger a risk-off move, benefiting the dollar and potentially pressuring the SP500. The current DXY level of 99.89 suggests the dollar is not yet weak, and its continued strength could act as a drag on equities. The performance of correlated assets, such as Brent Crude at $87.90 and WTI at $84.60, will also provide insights into inflationary pressures and geopolitical stability, both of which can influence equity market sentiment.
Technically, the conflicting signals across different timeframes require a disciplined approach. While the 1-hour and 4-hour charts show some bullish leanings, the dominant daily trend remains bearish according to the ADX of 47.51 and the overall trend classification. This suggests that any rallies might be short-lived bear market bounces rather than the start of a sustained uptrend. Confirmation of a genuine trend reversal would require sustained closes above key daily resistance levels, such as $6,605.07 and subsequently $6,685.83, coupled with a shift in momentum indicators on the daily chart. Until then, caution is advised, and risk management should be the top priority.
What happens if the SP500 fails to break above the $6,572.87 resistance level?
If the SP500 fails to decisively break above $6,572.87, a pullback is likely. The immediate trigger for this bearish scenario would be a close below $6,547.63, with targets at $6,535.07 and potentially $6,526.53. This aligns with the dominant daily bearish trend indicated by the ADX of 47.51.
Is the RSI at 70.95 a sell signal for SP500 right now?
An RSI of 70.95 on the 1-hour chart suggests overbought conditions, which can precede a short-term pullback or consolidation. While not an immediate sell signal on its own, it warrants caution and suggests that further upside may be limited without a period of digestion or a minor correction.
How will upcoming inflation data affect the SP500 around $6,572.87?
Stubbornly high inflation data could pressure the SP500 by reinforcing expectations of a hawkish Fed stance, potentially leading to a decline towards support levels like $6,526.53. Conversely, cooling inflation might boost the index towards $6,605.07, but this is contingent on the Fed's reaction and overall market sentiment.
Should I buy SP500 at current levels of $6,572.87 given the mixed technical signals?
Buying at $6,572.87 carries risk due to the resistance level and conflicting signals across timeframes. A more prudent approach might be to wait for a clear breakout above $6,572.87 with confirmation, or a pullback to a more defined support level like $6,526.53, especially with the daily trend still indicating bearish pressure.
Track markets in real-time
AI-powered analysis, technical indicators and real-time price data.
Join Our Telegram Channel
Breaking market news, AI analysis and trading signals instantly.
Join Channel