

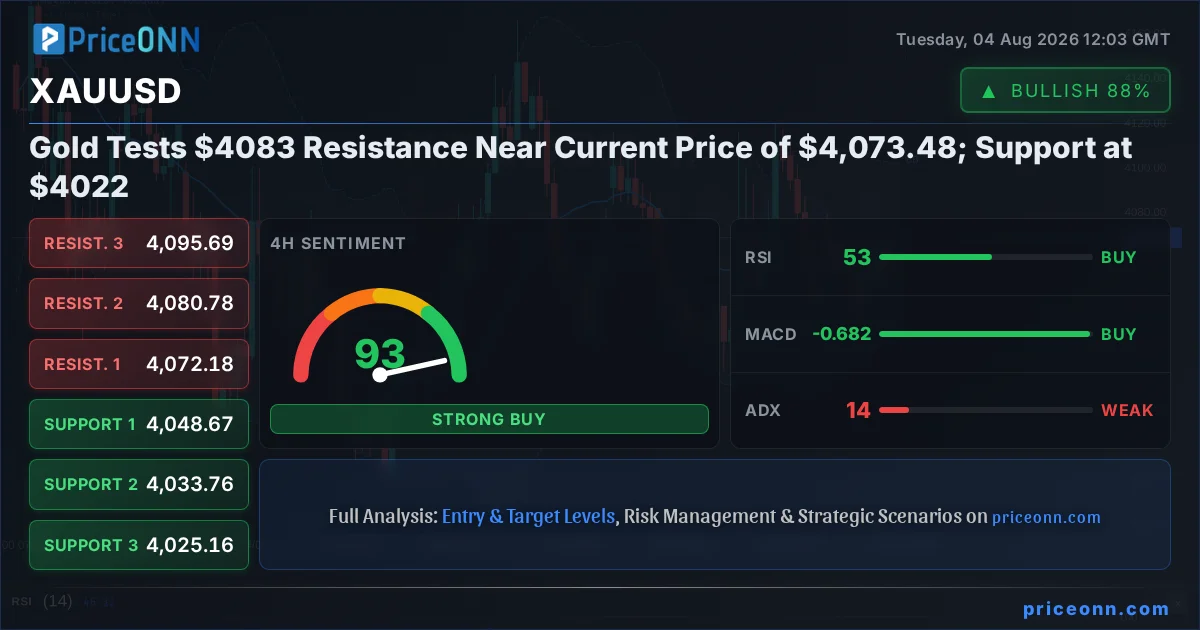
The global financial stage is set for a pivotal moment for gold, with XAUUSD currently trading at $4,073.48, inching closer to the critical resistance level of $4,083. This juncture is more than just a technical challenge; it's a reflection of the complex interplay between macroeconomic forces, central bank policies, and evolving risk appetite that dictates the precious metal's trajectory. As traders eye the $4,083 mark, the underlying fundamentals and the broader market context provide crucial clues about whether gold is poised for a significant breakout or a renewed pullback towards its support at $4,022. Understanding the drivers behind this potential move is paramount for navigating the current market landscape.
- XAUUSD is currently testing resistance near $4,073.48, with the next key level at $4,083.
- Support is firmly established at $4,045.82, with further levels at $4,038.04 and $4,030.73.
- The 1-day RSI is at 48.09, indicating a slight bearish lean, while 4-hour RSI at 54.37 suggests a neutral-to-bullish bias.
- The US Dollar Index (DXY) is hovering around 99.97, acting as a key correlate for gold's price action.
The narrative surrounding gold has always been one of duality: a safe-haven asset during times of uncertainty and an inflation hedge against currency debasement. Currently, the market is navigating a delicate balance. While geopolitical tensions often fuel demand for gold, persistent inflation concerns and the forward-looking stance of central banks are creating a complex demand picture. The recent analyst sentiment, as highlighted by Citi's projection of gold towards $4,500, suggests an underlying bullish conviction despite short-term consolidation. However, the immediate path is dictated by immediate price action and the confluence of technical signals. The $4,073.48 price point is not just a number; it represents a battleground where bulls and bears are currently locked in a struggle for control, with the $4,083 resistance looming large.
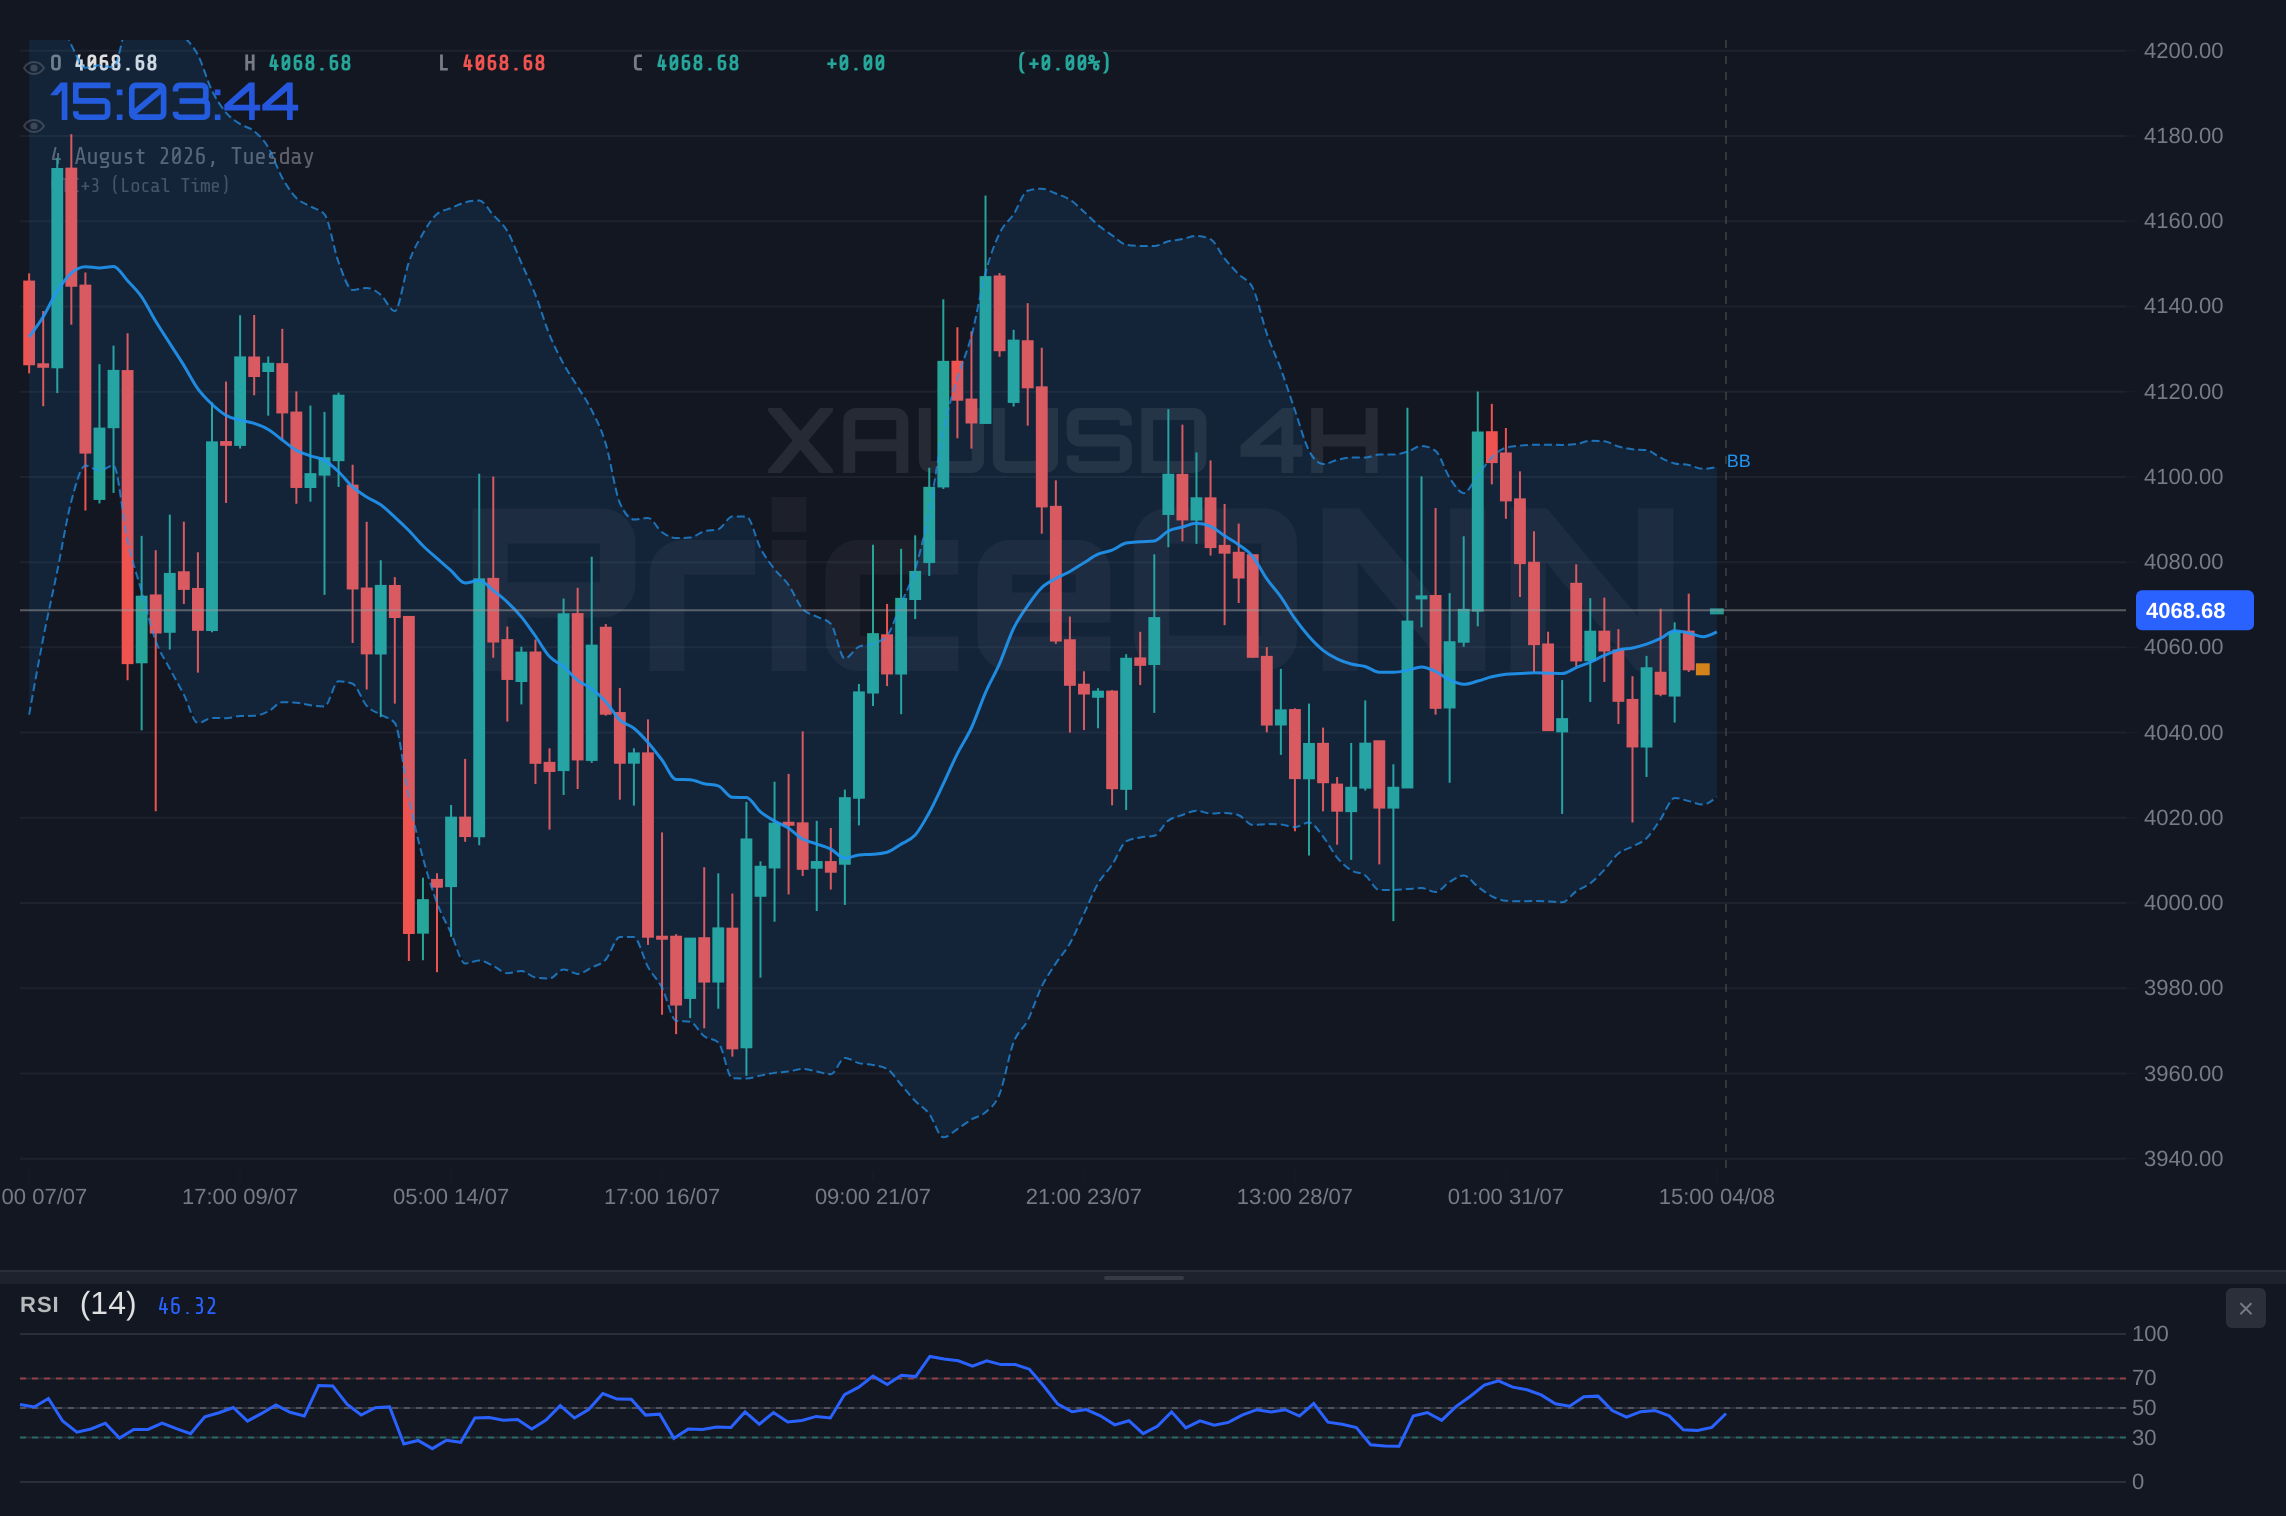
Delving into the technicals, the 1-hour chart for XAUUSD presents a neutral trend with a strength of 50%. The RSI(14) at 59.88 sits in the neutral zone, showing a slight upward inclination, suggesting that momentum is building but not yet overextended. The MACD is painting a picture of positive momentum, with the MACD line trading above its signal line, indicating a potential for further upside. Bollinger Bands are also supportive, trading above the middle band, which generally signals an uptrend or a period of consolidation with upward bias. However, the Stochastic Oscillator at K=42.36 and D=58.09 is flashing a bearish signal, with the %K line below the %D line, hinting at a potential short-term pullback. The ADX, a measure of trend strength, is at a low 13.29, confirming the current lack of a strong directional trend on this timeframe, pointing towards a consolidation phase rather than a decisive move.
Navigating the Daily Chart's Bearish Lean
The Daily Timeframe's Divergent Signals
While the shorter timeframes offer a mixed picture, the daily chart for XAUUSD paints a more defined, albeit bearish, trend with a strength of 93%. The current price of $4,073.48 is trading below the daily resistance of $4,083.41, reinforcing the immediate overhead pressure. The RSI(14) on the daily chart is at 48.09, indicating a bearish lean within the neutral zone, suggesting that sellers might have a slight edge in the longer term. The MACD continues to show positive momentum, trading above its signal line, which is a slight contradiction to the overall bearish trend, but often seen during pullbacks within a larger downtrend. Bollinger Bands remain above the middle band, suggesting an underlying upward bias that has been present, but the price action is currently being capped.
The Stochastic Oscillator on the daily chart is K=39.41 and D=45.77, confirming a bearish signal as the %K line is below the %D line. This reinforces the idea that, despite any short-term bullish pressures, the longer-term outlook might be tilted towards a correction. The ADX at 26.73 signifies a strong downtrend on the daily timeframe, which is a significant factor. This confluence of a strong daily downtrend signal, a bearish RSI, and a bearish Stochastic suggests that any upward movements might be met with selling pressure. The general signal for the daily timeframe is 'SAT', with 5 sell signals against 3 buy signals, underscoring the caution advised for longer-term positions.
The Role of the US Dollar Index (DXY)
No analysis of gold is complete without considering the US Dollar Index (DXY). Currently hovering around 99.97, the DXY's movement is a critical correlate for XAUUSD. A strengthening dollar typically exerts downward pressure on gold prices, as gold becomes more expensive for holders of other currencies. Conversely, a weaker dollar can support gold prices. The DXY's current near-neutral stance, fluctuating around the 100-point mark, reflects a market in equilibrium, waiting for a clearer direction from economic data or central bank policy shifts. The fact that the DXY's 1-day trend is showing a slight bearish inclination (ADX: 24.96) could offer some underlying support to gold, even as other technicals suggest caution.
The 1-hour DXY chart shows a neutral trend (ADX: 16.87) with a bearish RSI (48.18) and Stochastic (K=45.33, D=62.09), indicating potential for dollar weakness in the very short term. However, the 4-hour chart presents a stronger downtrend signal (ADX: 33.66), suggesting that the dollar might be facing more sustained selling pressure. This divergence between timeframes means that while immediate dollar weakness could buoy gold, the longer-term trend for the dollar might still be a headwind. Traders must closely monitor the DXY's reaction to upcoming economic data, particularly employment figures and inflation reports, as these will be key in determining the dollar's next move and, consequently, gold's trajectory.
Economic Undercurrents Shaping Gold's Future
Inflationary Pressures and Central Bank Reactions
The persistent narrative of inflation remains a significant driver for gold. While headline inflation numbers might fluctuate, the underlying core inflation trends are what central banks, particularly the Federal Reserve, are closely watching. Fed's John Williams recently stated his confidence in inflation gradually declining, suggesting a focus on the core trend rather than short-term shocks like oil prices. This implies that the Fed might be nearing the end of its tightening cycle, or at least pausing for assessment. Such a stance, if confirmed by upcoming economic data, could reduce the real yields on fixed-income assets, making non-yielding gold more attractive. The market is keenly awaiting the next round of CPI and employment data to gauge the Fed's resolve and the actual trajectory of inflation.
The market is currently pricing in a certain degree of rate stability or even potential cuts later in the year. If upcoming data surprises to the upside, showing sticky inflation, the Fed might be forced to maintain a hawkish stance for longer. This would likely strengthen the dollar and put pressure on gold. Conversely, signs of cooling inflation and a weakening labor market could embolden the Fed to signal a dovish pivot, which would be highly supportive for XAUUSD. The current RSI of 48.09 on the daily chart suggests that the market is not yet pricing in significant bullishness for gold, implying that a strong catalyst is needed to break through the $4,083 resistance. The ADX at 26.73 on the daily chart indicates a strong trend is in play, and if that trend is bearish, breaking higher requires significant fundamental impetus.
Geopolitical Risk and Safe-Haven Demand
While the immediate focus is often on economic data, geopolitical developments continue to play a crucial background role for gold. The news regarding de-escalation around Iran, potentially boosting demand for technology stocks as reported by NASDAQ 100 analysis, might suggest a temporary easing of immediate geopolitical risk premiums. However, the broader global landscape remains volatile. Any resurgence of tensions, particularly in energy-producing regions, could quickly reignite safe-haven demand for gold. The market is perpetually on alert for news that could disrupt supply chains, impact energy prices, or increase global uncertainty. This underlying demand for gold as a safe haven provides a structural floor, even during periods of technical consolidation or fundamental headwinds.
The impact of geopolitical events on gold is often immediate and significant. For instance, a sudden escalation in the Middle East could see gold prices surge past resistance levels as traders flock to safety. Conversely, sustained periods of geopolitical calm might allow economic fundamentals and interest rate differentials to dominate price action. The current price of $4,073.48 reflects a market that is perhaps pricing in a degree of stability, but the potential for geopolitical shocks means that gold remains a key asset for portfolio diversification and hedging against tail risks. The strong daily downtrend indicated by ADX 26.73 suggests that for gold to reverse course decisively, a significant shift in either the geopolitical landscape or the macroeconomic outlook would be required.
Intermarket Analysis: Gold's Dance with Equities and Bonds
Correlation with Equity Markets (SP500 & Nasdaq)
Gold's relationship with equity markets, particularly the S&P 500 and Nasdaq, is often inversely correlated, especially during periods of shifting risk appetite. The S&P 500, currently at 6572.87, and the Nasdaq 100, trading at 29118.31, are showing strong upward momentum on the 1-hour and 4-hour charts, indicating a healthy risk-on environment. A rising equity market typically suggests that investors are willing to take on more risk, potentially diverting capital away from safe-haven assets like gold. However, the daily charts for both indices present a more cautious picture, with the S&P 500 showing a 100% strength in a downtrend and the Nasdaq 100 in a neutral trend. This divergence implies that while short-term optimism prevails, underlying risks might still be present, which could support gold if sentiment shifts.
If the equity markets were to experience a sharp downturn, driven by, for example, disappointing economic data or a hawkish surprise from the Fed, gold could benefit significantly from a flight to safety. The RSI on the S&P 500's 1-hour chart is at 70.95, bordering on overbought, and the Stochastic is in overbought territory, suggesting a potential for a short-term correction in equities. Should this occur, gold's support levels around $4,045.82 and $4,038.04 would become critical watch zones. The ADX on the daily S&P 500 is 47.51, indicating a strong downtrend, which contradicts the intraday bullish signals and highlights the choppiness in the broader market. This complexity means gold's path is not solely dictated by equity movements but by the underlying drivers of risk sentiment.
The Influence of Treasury Yields
Treasury yields are another crucial factor influencing gold prices. Higher real yields increase the opportunity cost of holding non-yielding assets like gold, thus acting as a headwind. Conversely, falling real yields make gold relatively more attractive. While specific yield data is not provided, the general expectation of central banks potentially pausing or pivoting towards easing in the future would suggest a ceiling on current yields, or even a gradual decline over the medium term. If yields begin to fall significantly, this would provide a strong fundamental tailwind for gold, potentially helping it break through the $4,083 resistance. The current RSI on the daily gold chart at 48.09 suggests that the market is not yet fully pricing in a scenario of rapidly falling yields, leaving room for upside if this narrative gains traction.
The interplay between yields and gold is complex. For example, if inflation expectations rise sharply, yields might increase to compensate investors, but gold could also rise as an inflation hedge. However, if yields rise due to strong economic growth expectations and a hawkish Fed, gold typically suffers. The current environment, where central banks are signaling a potential end to tightening, leans towards yields finding a plateau or beginning a descent. This scenario is fundamentally supportive for gold, provided that the price action can overcome the immediate technical resistance near $4,083. The weak trend indicated by the ADX (13.29 on 1H, 14.15 on 4H) for gold suggests that the market is waiting for a clearer signal from either macroeconomic data or a decisive break of key technical levels.
Key Levels and Price Action Dynamics
The $4,083 Resistance Test
Gold is currently probing the resistance zone around $4,083. This level, derived from the live data, represents a critical barrier. A sustained break above $4,083.41, confirmed by strong volume and followed by a hold above this level on the daily chart, would signal a continuation of the bullish trend. The immediate targets on such a breakout would likely be the subsequent resistance levels at $4,111.74 and $4,143.99. The RSI at 48.09 on the daily chart, while leaning bearish, is not yet in deeply oversold territory, leaving room for upward momentum to build. The MACD's positive momentum on the daily chart also supports the possibility of an upward move, provided the resistance can be breached.
However, failure to break above $4,083 could lead to a retracement. The market sentiment currently shows a 'SAT' signal on the daily timeframe, with 5 sell signals against 3 buy signals. This indicates that sellers are more dominant in the longer term. If gold rejects the $4,083 resistance, the price could fall back towards the support levels. The first significant support lies at $4,045.82, followed by $4,038.04 and $4,030.73. A break below $4,045.82 would likely accelerate selling pressure, bringing the lower daily support levels into play. The ADX at 26.73 on the daily chart confirms a strong trend is in place, and if the current resistance holds, that trend is likely to continue downwards.
Support at $4,045 and Below
The support structure for XAUUSD is well-defined, with the first key level at $4,045.82 on the 1-hour chart and $4,048.67 on the 4-hour chart. These levels represent areas where buying interest has historically emerged, potentially halting or reversing downward price movements. Below these, we find further support at $4,038.04 and $4,030.73 on the 1-hour, and $4,033.76 and $4,025.16 on the 4-hour. The daily support levels are even more significant, located at $4,022.83, $3,990.58, and $3,962.25. A decisive break below the daily support at $4,022.83 would signal a significant bearish development, potentially triggering stop-loss orders and leading to a steeper decline.
The Stochastic oscillator on the daily chart, with K=39.41 and D=45.77, is already signaling a bearish trend, and a move towards these support levels could see it enter oversold territory, potentially creating a temporary bounce. However, the overall trend strength indicated by the daily ADX at 26.73 suggests that if a breakdown occurs, it could be substantial. Traders will be closely watching the price action around these support zones for signs of accumulation or capitulation. The ability of gold to hold above these levels will be crucial in determining whether the current consolidation is a pause before an upward move or a precursor to a deeper correction.
Scenario Analysis: What Lies Ahead for Gold?
Bearish Scenario: Resistance Holds Firm
65% ProbabilityNeutral Scenario: Range-Bound Consolidation
25% ProbabilityBullish Scenario: Breakout Above Resistance
10% ProbabilityFrequently Asked Questions: XAUUSD Analysis
What happens if XAUUSD breaks above the $4,083 resistance level?
A sustained break above $4,083.41, confirmed on the daily chart, would likely trigger a move towards the next resistance levels at $4,111.74 and potentially $4,143.99. This scenario would be supported by positive macroeconomic news and a shift in risk sentiment.
Should I buy XAUUSD at current levels of $4,073.48 given the mixed technical signals?
Buying at current levels carries risk due to the proximity of resistance at $4,083 and the bearish lean on the daily chart (RSI 48.09, ADX 26.73). A more prudent approach would be to wait for a confirmed breakout above $4,083 or a pullback to support levels like $4,045.82, depending on risk tolerance.
Is the daily RSI at 48.09 a sell signal for XAUUSD right now?
An RSI of 48.09 is in the neutral zone but leans bearish, suggesting that while upside momentum is not strong, downward pressure is more dominant on the daily timeframe. It's not an outright sell signal but indicates caution against aggressive long positions without further confirmation.
How will upcoming Fed policy expectations affect XAUUSD this week?
If upcoming economic data suggests sticky inflation, leading to hawkish Fed expectations, gold may face pressure. Conversely, signs of cooling inflation and a potential Fed pause would support gold, potentially helping it break through resistance. Traders should monitor employment and inflation reports closely.
Track markets in real-time
AI-powered analysis, technical indicators and real-time price data.
Join Our Telegram Channel
Breaking market news, AI analysis and trading signals instantly.
Join Channel