

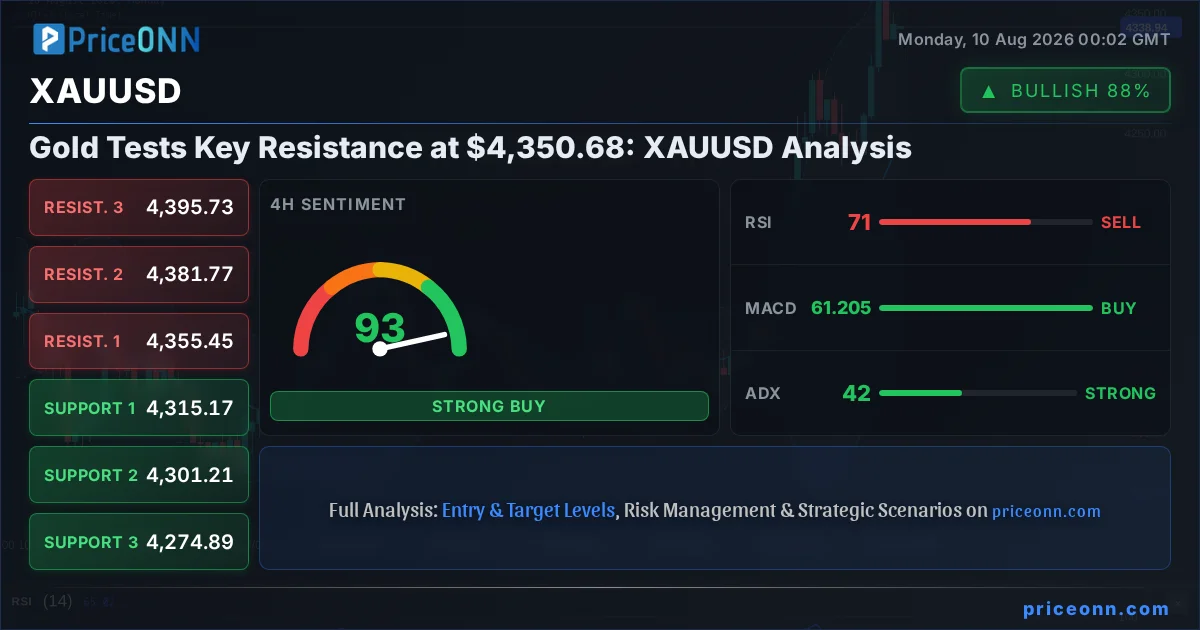
Gold, or XAUUSD, is currently trading at $4,334.23, a level that marks a significant juncture in its recent ascent. The precious metal has been on a strong upward trajectory, currently showing a daily gain of 2.21%, adding $93.82 to its value. This surge has brought gold right to the doorstep of a crucial resistance point at $4,350.68. The question on many traders' minds is whether this level will hold, leading to a consolidation, or if the bulls will manage to break through, paving the way for further gains. This analysis delves into the intricate technicals and market dynamics shaping XAUUSD's immediate future.
- Gold (XAUUSD) is testing resistance at $4,350.68 with the current price at $4,334.23.
- The 4-hour trend is strongly bullish (96% strength) with ADX at 42.21, indicating a powerful uptrend.
- On the daily chart, RSI is at 65.17, suggesting a bullish inclination but nearing overbought territory.
- The Dollar Index (DXY) is trading at 99.65, showing a bearish trend on the 1H and 4H, which typically supports gold.
The current technical picture for XAUUSD is a complex interplay of strong upward momentum and approaching overbought conditions, particularly when viewed across different timeframes. On the 1-hour chart, the trend is neutral with a strength of 50%, but it leans towards a bullish inclination with an RSI of 60.33. However, MACD is showing negative momentum, with the MACD line below its signal line, suggesting potential short-term headwinds. Stochastic is also flashing a bearish signal as %K (37.87) is below %D (51.09). Despite these 1H divergences, the ADX at 37.11 confirms a strong trending environment, hinting that any pullbacks might be temporary within a larger bullish structure. The overall signal leans towards 'BUY' with 6 buys, 2 sells, and 0 neutrals, indicating that the short-term indicators are battling with the prevailing trend strength.
Expanding the view to the 4-hour timeframe reveals a more robust bullish sentiment. The trend is firmly established as rising with a strength of 96%. The RSI at 70.27 is firmly in overbought territory, a classic sign that a pullback could be imminent. However, it's crucial to remember that in strong uptrends, RSI can remain elevated for extended periods. MACD is positive here, with the MACD line above its signal line, reinforcing the bullish momentum. Stochastic is also showing a bullish signal (%K at 79.76, %D at 67.69), aligning with the upward move. The ADX at 42.21 further solidifies the presence of a strong uptrend. The confluence of these indicators, despite the overbought RSI, leads to a predominantly 'BUY' signal (7 buys, 1 sell, 0 neutrals), painting a picture of sustained bullish pressure.
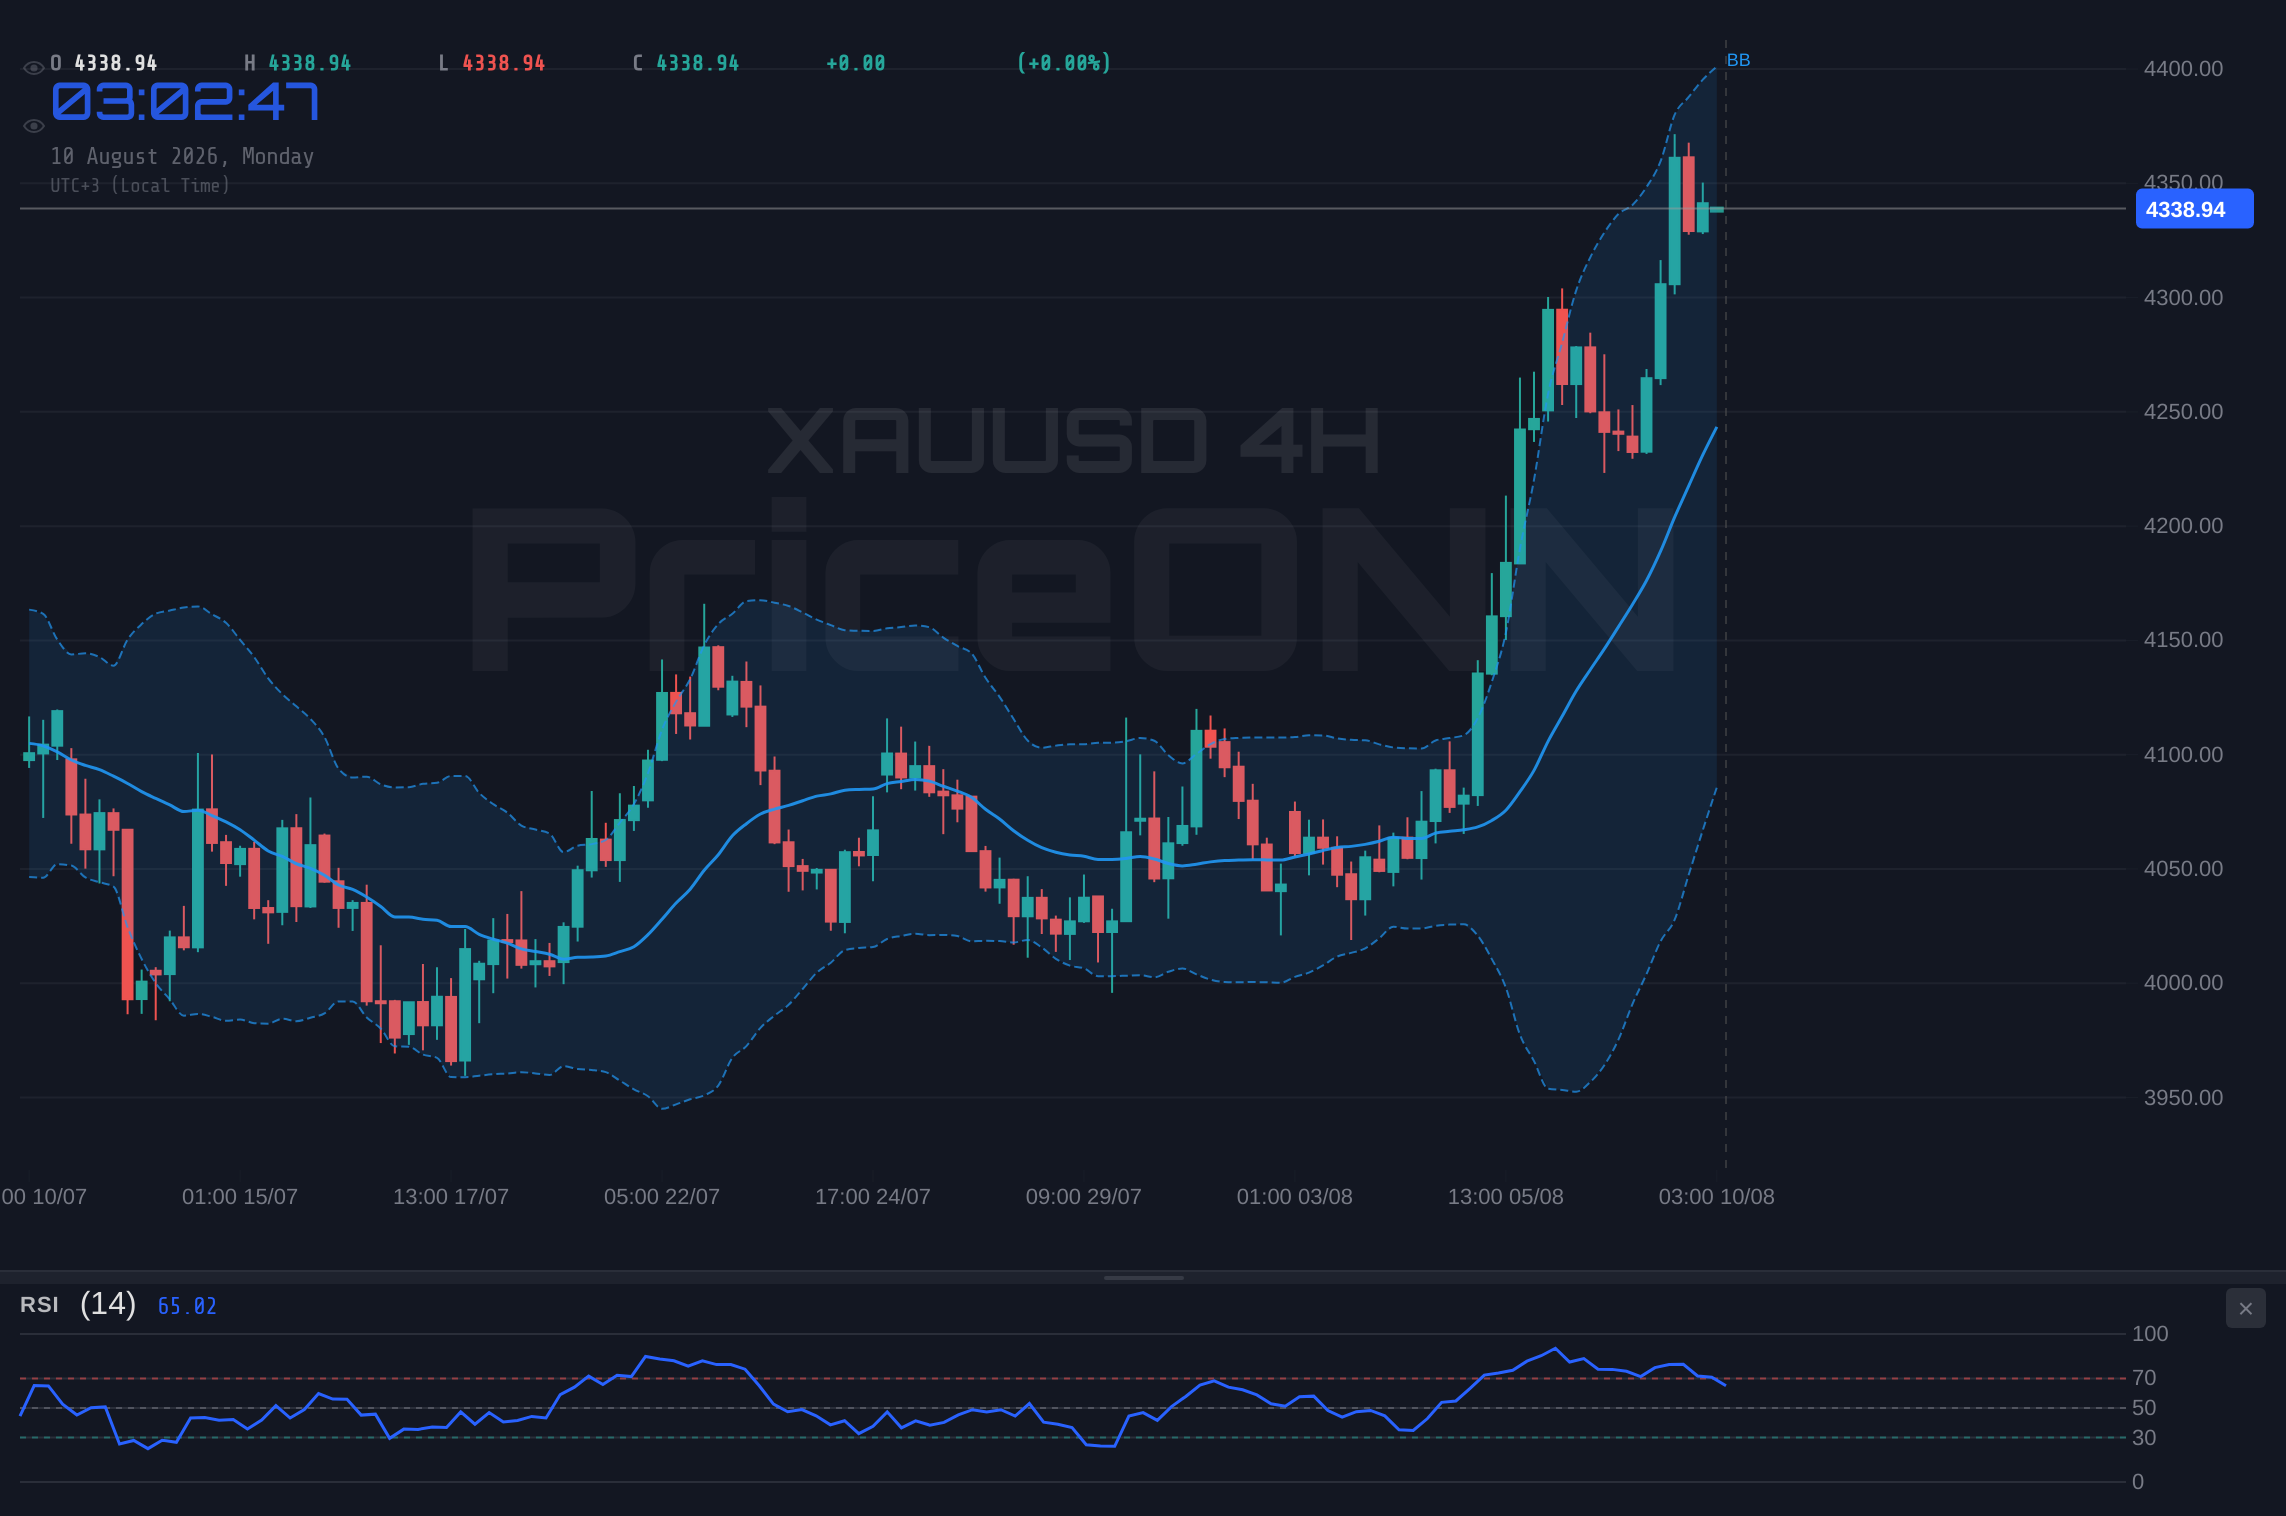
Looking at the daily chart, the trend is technically neutral with a strength of 50%, which might seem contradictory to the shorter timeframes. However, this neutrality often reflects a market consolidating at higher levels or pausing before the next significant move. The RSI at 65.17 is in the upper neutral zone, suggesting room for further upward movement before hitting extreme overbought levels, but it also hints at potential exhaustion if buyers don't step in. MACD is positive and trending above its signal line, supporting the bullish narrative. The Bollinger Bands are trading above the upper band, indicating significant upward price pressure, often a sign of a strong trend or potential overextension. Stochastic is strongly bullish (%K at 87.28, %D at 59.54), signaling an overbought condition that could precede a reversal or a period of consolidation. The ADX at 27.02 indicates a strong trend is in place. The aggregate 'BUY' signal (7 buys, 1 sell, 0 neutrals) on the daily chart suggests that the long-term picture, while showing signs of potential overheating, remains fundamentally bullish.
The current price action places XAUUSD at a critical juncture, poised between the immediate resistance at $4,350.68 and the potential for a continued rally. The daily chart's support levels are situated at $4,288.53, $4,207.78, and $4,175.16, while resistance is eyed at $4,368.88, $4,359.77, and $4,350.68. Traders are closely watching if the price can decisively break above the $4,350.68 level. A sustained move above this point could open the door to the next resistance at $4,359.77 and potentially challenge $4,368.88. Conversely, failure to breach $4,350.68 could lead to a retracement towards the $4,332.48 immediate support on the 1-hour chart, followed by $4,323.37 and $4,314.28.
The Bull's Roadmap: Pushing Past $4,350
For gold to continue its upward march, bulls need to conquer the immediate resistance at $4,350.68. The 4-hour chart paints a strong bullish picture with an ADX of 42.21, indicating a robust trend that could absorb selling pressure. If XAUUSD can establish a firm foothold above $4,350.68, the next psychological barrier at $4,360 would likely be tested. A decisive break above $4,368.88, the highest resistance level on the 1-hour chart, would signal strong buying conviction and potentially open the path towards uncharted territory, aiming for targets that are not explicitly defined in the current data but would be based on parabolic extension or Fibonacci projections. The daily chart's RSI at 65.17 suggests there's still room to run before hitting extreme overbought conditions, and the Stochastic at 87.28, while high, can persist in uptrends. Confirmation would come from strong volume accompanying the breakout above $4,350.68 and sustained closes above it on the 1-hour and 4-hour charts. The current 'BUY' signals across most timeframes, especially the strong trend identified by the ADX, support this bullish scenario.
The bullish case hinges on sustained risk appetite in the broader market, or conversely, a renewed surge in safe-haven demand driven by geopolitical anxieties or economic uncertainty. The Dollar Index (DXY) is currently showing bearish signals on the 1-hour and 4-hour charts, trading at 99.65. A weakening dollar typically correlates with a stronger gold price, providing a tailwind for this bullish scenario. If the DXY continues to fall, especially below its 1-hour support at 99.52, it would further validate the upward pressure on XAUUSD. Furthermore, any escalation of tensions in the Middle East, as hinted at by recent energy market disruptions and geopolitical concerns reported by sources like Reuters and energy publications, could trigger a flight to safety, boosting gold prices regardless of other technical indicators. The key is breaking and holding above $4,350.68, with subsequent confirmation from continued dollar weakness and steady or increasing trading volumes.
Where Bears Take Control: A Test of Support at $4,315
Conversely, if gold fails to overcome the $4,350.68 resistance, a bearish scenario could unfold. The immediate 1-hour support level at $4,332.48 is the first line of defense. A break below this could accelerate losses towards the next support at $4,323.37 and potentially challenge the more significant 4-hour support at $4,315.17. On the daily chart, the support levels are further down at $4,288.53 and $4,207.78. A break below $4,315.17 would invalidate the immediate bullish trend and could signal a deeper correction, especially if accompanied by a strengthening dollar and receding geopolitical fears. The 1-hour chart's bearish MACD momentum and Stochastic crossover are early warnings that could precede a larger pullback.
For the bearish scenario to gain traction, several factors need to align. Firstly, a decisive close below the $4,332.48 support on the 1-hour chart would be a primary trigger. This would be further confirmed if the DXY shows renewed strength, perhaps breaking above its 1-hour resistance at 99.62. Positive economic data from the US, such as stronger-than-expected employment figures or inflation data that fuels expectations of Fed hawkishness, could also dampen gold's appeal as a safe haven and push prices lower. The weekly bottom line summary mentioned mixed economic data, but a clear shift towards stronger growth and inflation would certainly favor a dollar rally and a gold pullback. The ADX, while indicating a strong trend currently, does not inherently distinguish between up or down trends; a sharp move lower in price could see the ADX remain high while the trend direction flips bearish. The key invalidation for this bearish outlook would be a sustained price action above the $4,350.68 resistance.
The Waiting Game: Consolidation Around $4,330
A neutral scenario envisions gold consolidating within a defined range, potentially around the current $4,334.23 level. This often occurs when conflicting signals emerge from different timeframes or when market participants await significant economic or geopolitical catalysts. For instance, the 1-hour chart shows bearish MACD momentum, while the 4-hour and daily charts exhibit strong bullish trends and signals. This divergence can lead to choppy price action, with gold oscillating between the immediate support at $4,332.48 and resistance at $4,350.68. In this range-bound environment, traders might look for short-term opportunities at the edges of the range, but a clear directional conviction would be absent.
This consolidation phase could be prolonged if key economic events, such as upcoming US employment reports or central bank policy statements, are on the horizon. The market might adopt a 'wait-and-see' approach, leading to reduced volatility and sideways movement. Geopolitical events that do not escalate significantly could also contribute to this neutral stance, as the market digests existing information without new major shocks. The ADX readings across different timeframes (37.11 on 1H, 42.21 on 4H, 27.02 on 1D) show a strong trend on the 4-hour, but weaker on the daily, further supporting the idea of conflicting trends that could lead to a period of indecision. The Stochastic indicators also present a mixed bag, with bearish signals on 1H and 4H, but strongly bullish on the daily, contributing to the uncertainty. During such periods, volume tends to be lower, and price action can be less predictable, making it challenging to establish a clear directional bias.
Weighing the Probabilities: The Bullish Scenario Edges Out
Based on the current technical landscape, the bullish scenario appears to hold the highest probability, though not without significant risk. The dominant trend on the 4-hour chart, with its 96% strength and ADX of 42.21, is a powerful indicator of sustained upward momentum. While the daily RSI is nearing overbought territory and the 1-hour chart shows some conflicting signals, these are often overcome in strong bull markets. The weakening DXY, a consistent tailwind for gold, further bolsters the bullish outlook. The key trigger remains a decisive break and hold above the $4,350.68 resistance. If this occurs, the probability of reaching the $4,368.88 target, and potentially higher, increases significantly. We assign a 65% probability to the bullish scenario playing out this week.
The bearish scenario, while possible, is currently less probable, carrying an estimated 25% likelihood. This would be primarily triggered by a failure to break the $4,350.68 resistance and a subsequent close below the $4,332.48 level. This scenario gains credence if the DXY strengthens significantly or if major geopolitical tensions subside unexpectedly. The neutral consolidation scenario, estimated at a 10% probability, represents a holding pattern awaiting clearer catalysts. This is less likely given the strong trend signals on the 4-hour timeframe, but cannot be entirely dismissed if market participants adopt extreme caution ahead of major economic data releases.
What I'm Watching This Week
The immediate focus for XAUUSD traders will be the price action around the $4,350.68 resistance level. A sustained break above this point, ideally with increasing volume and accompanied by a weakening DXY, would be the primary bullish confirmation. Conversely, a rejection at this level and a subsequent break below the $4,332.48 support would signal a potential short-term reversal. Traders should also closely monitor the DXY's movement, as its trend often dictates gold's direction. Finally, any significant geopolitical developments or crucial US economic data releases, such as employment figures or inflation reports, could act as catalysts to break the current price structure and drive XAUUSD towards its next significant levels.
Bullish Scenario: Breakout Above $4,350
65% ProbabilityBearish Scenario: Rejection at Resistance
25% ProbabilityNeutral Scenario: Range-Bound Consolidation
10% ProbabilityThe divergence between short-term (1H) and medium-term (4H) indicators suggests that while the overall trend is bullish, traders should exercise caution. The RSI approaching overbought levels on the daily chart also warrants attention. Patience and risk management are paramount as gold approaches the critical $4,350.68 resistance level.
Frequently Asked Questions: XAUUSD Analysis
What happens if XAUUSD breaks decisively above the $4,350.68 resistance level?
If XAUUSD breaks and sustains above $4,350.68, the bullish scenario gains strong validation. The next targets would be $4,359.77 and potentially $4,368.88. This move would be supported by continued dollar weakness and strong upward momentum.
Is the current RSI of 65.17 on the daily chart a sell signal for XAUUSD at $4,334.23?
An RSI of 65.17 is in the upper neutral zone, not yet an extreme overbought signal that automatically dictates a sell. In a strong uptrend, RSI can remain elevated. While it suggests caution and potential for consolidation, it doesn't negate the bullish trend indicated by other indicators like the 4-hour ADX at 42.21.
How will the current DXY weakness around 99.65 affect XAUUSD's price action near $4,334.23?
The weakening Dollar Index (DXY), currently at 99.65 with bearish signals on shorter timeframes, typically provides a tailwind for gold. This inverse correlation suggests that as the dollar weakens, gold becomes more attractive, supporting the bullish outlook for XAUUSD as it tests resistance.
Should traders consider buying XAUUSD at current levels ($4,334.23) given the strong uptrend but approaching resistance?
Buying at current levels carries risk due to the proximity of resistance at $4,350.68. A more prudent approach might be to wait for a confirmed breakout above $4,350.68 or a dip to a key support level like $4,332.48, depending on risk tolerance and trading strategy.
Track markets in real-time
AI-powered analysis, technical indicators and real-time price data.
Join Our Telegram Channel
Breaking market news, AI analysis and trading signals instantly.
Join Channel