

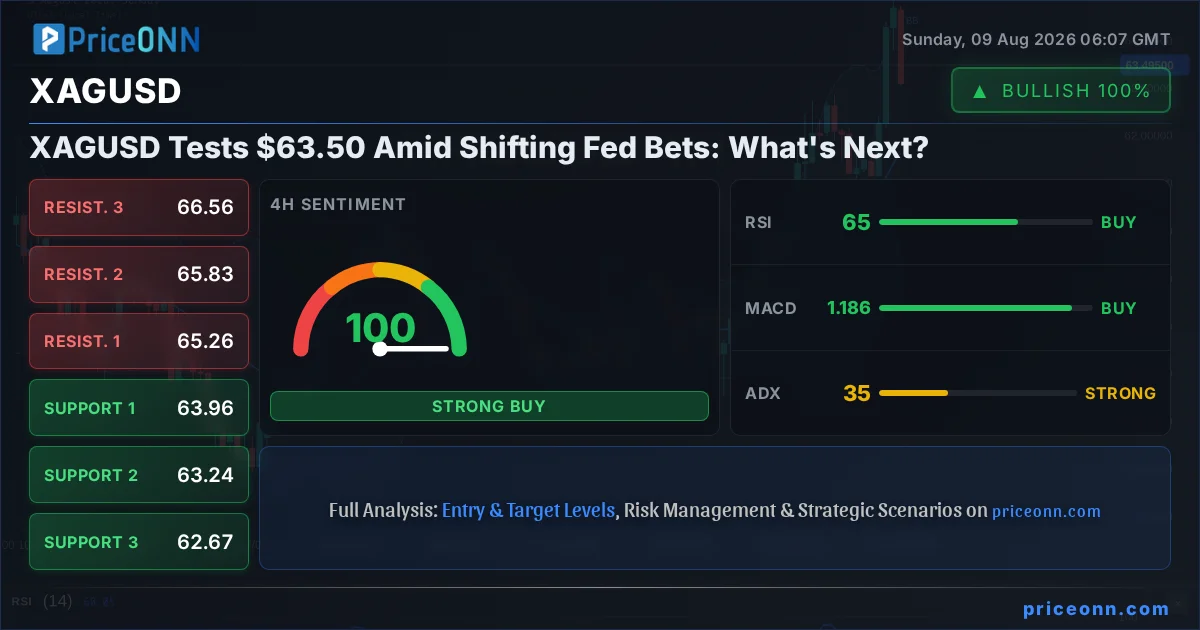
The past week has been a whirlwind for silver, with XAGUSD closing Friday at $63.50 after a significant 3.25% surge, driven by a potent cocktail of dovish Federal Reserve expectations and simmering geopolitical tensions. While the immediate reaction to the surprisingly weak US Nonfarm Payrolls (NFP) report on Tuesday sent silver prices soaring above $63.50, the underlying currents suggest a complex trading environment ahead. The market is now grappling with conflicting signals: a potential shift in Fed policy versus escalating global risks that historically bolster precious metals. This analysis delves into the technical landscape of XAGUSD, examining indicator readings, key support and resistance levels, and correlating market movements to decipher whether the current upward momentum has legs or if a consolidation phase is more likely next week.
- RSI at 65.03 on the 4H chart signals strong bullish momentum, but approaches overbought territory, indicating potential for consolidation.
- Critical support for XAGUSD sits at $63.14, tested multiple times this week, holding firm against bearish pressure.
- The ADX at 34.5 on the 4H timeframe confirms a strong uptrend, suggesting the current move has underlying strength.
- Weak NFP data (July payrolls shed 23,000 jobs) has lowered September Fed rate hike odds, supporting silver's advance against a softening US Dollar Index (DXY).
Navigating the Post-NFP Silver Surge: A Tale of Two Markets
The dramatic shift in market sentiment following the July US Nonfarm Payrolls (NFP) report on Tuesday was palpable, and silver, XAGUSD, was a primary beneficiary. The data revealed an unexpected loss of 23,000 jobs, a stark contrast to the projected gain of 83,000, sending shockwaves through financial markets. This figure not only defied expectations but also significantly altered the perceived trajectory of Federal Reserve monetary policy. Traders immediately began repricing the likelihood of a September rate hike, pushing expectations down and, consequently, weakening the US Dollar Index (DXY). The DXY, which had been consolidating around 99.55, saw a sharp decline, falling below 99.50 as the market digested the implications of a potentially less hawkish Fed. This inverse correlation between the dollar and silver is a well-established dynamic, and the NFP miss provided a strong catalyst for XAGUSD to break out from its recent range, ultimately closing the week at a robust $63.50 after a 3.25% gain.
However, the narrative is far from simple. While the dovish pivot in Fed expectations provided a tailwind, other forces are simultaneously shaping the market. Geopolitical risks, particularly concerning the Strait of Hormuz and renewed US-China trade tensions, are escalating. Reports from Reuters highlighted concerns over potential supply disruptions in the Middle East, a region critical for global energy markets. Elevated oil prices, a consequence of these tensions, can indirectly fuel inflation concerns, a factor that usually supports precious metals like silver as a hedge. This creates a delicate balancing act for traders: is the market more focused on a potentially less aggressive Fed, or are the rising geopolitical risks a more dominant driver for safe-haven assets? The technical indicators on XAGUSD present a mixed but predominantly bullish picture across multiple timeframes, suggesting that while caution is warranted, the path of least resistance may still be to the upside, provided key levels hold.
Technical Indicators Align for a Bullish Bias, With Caveats
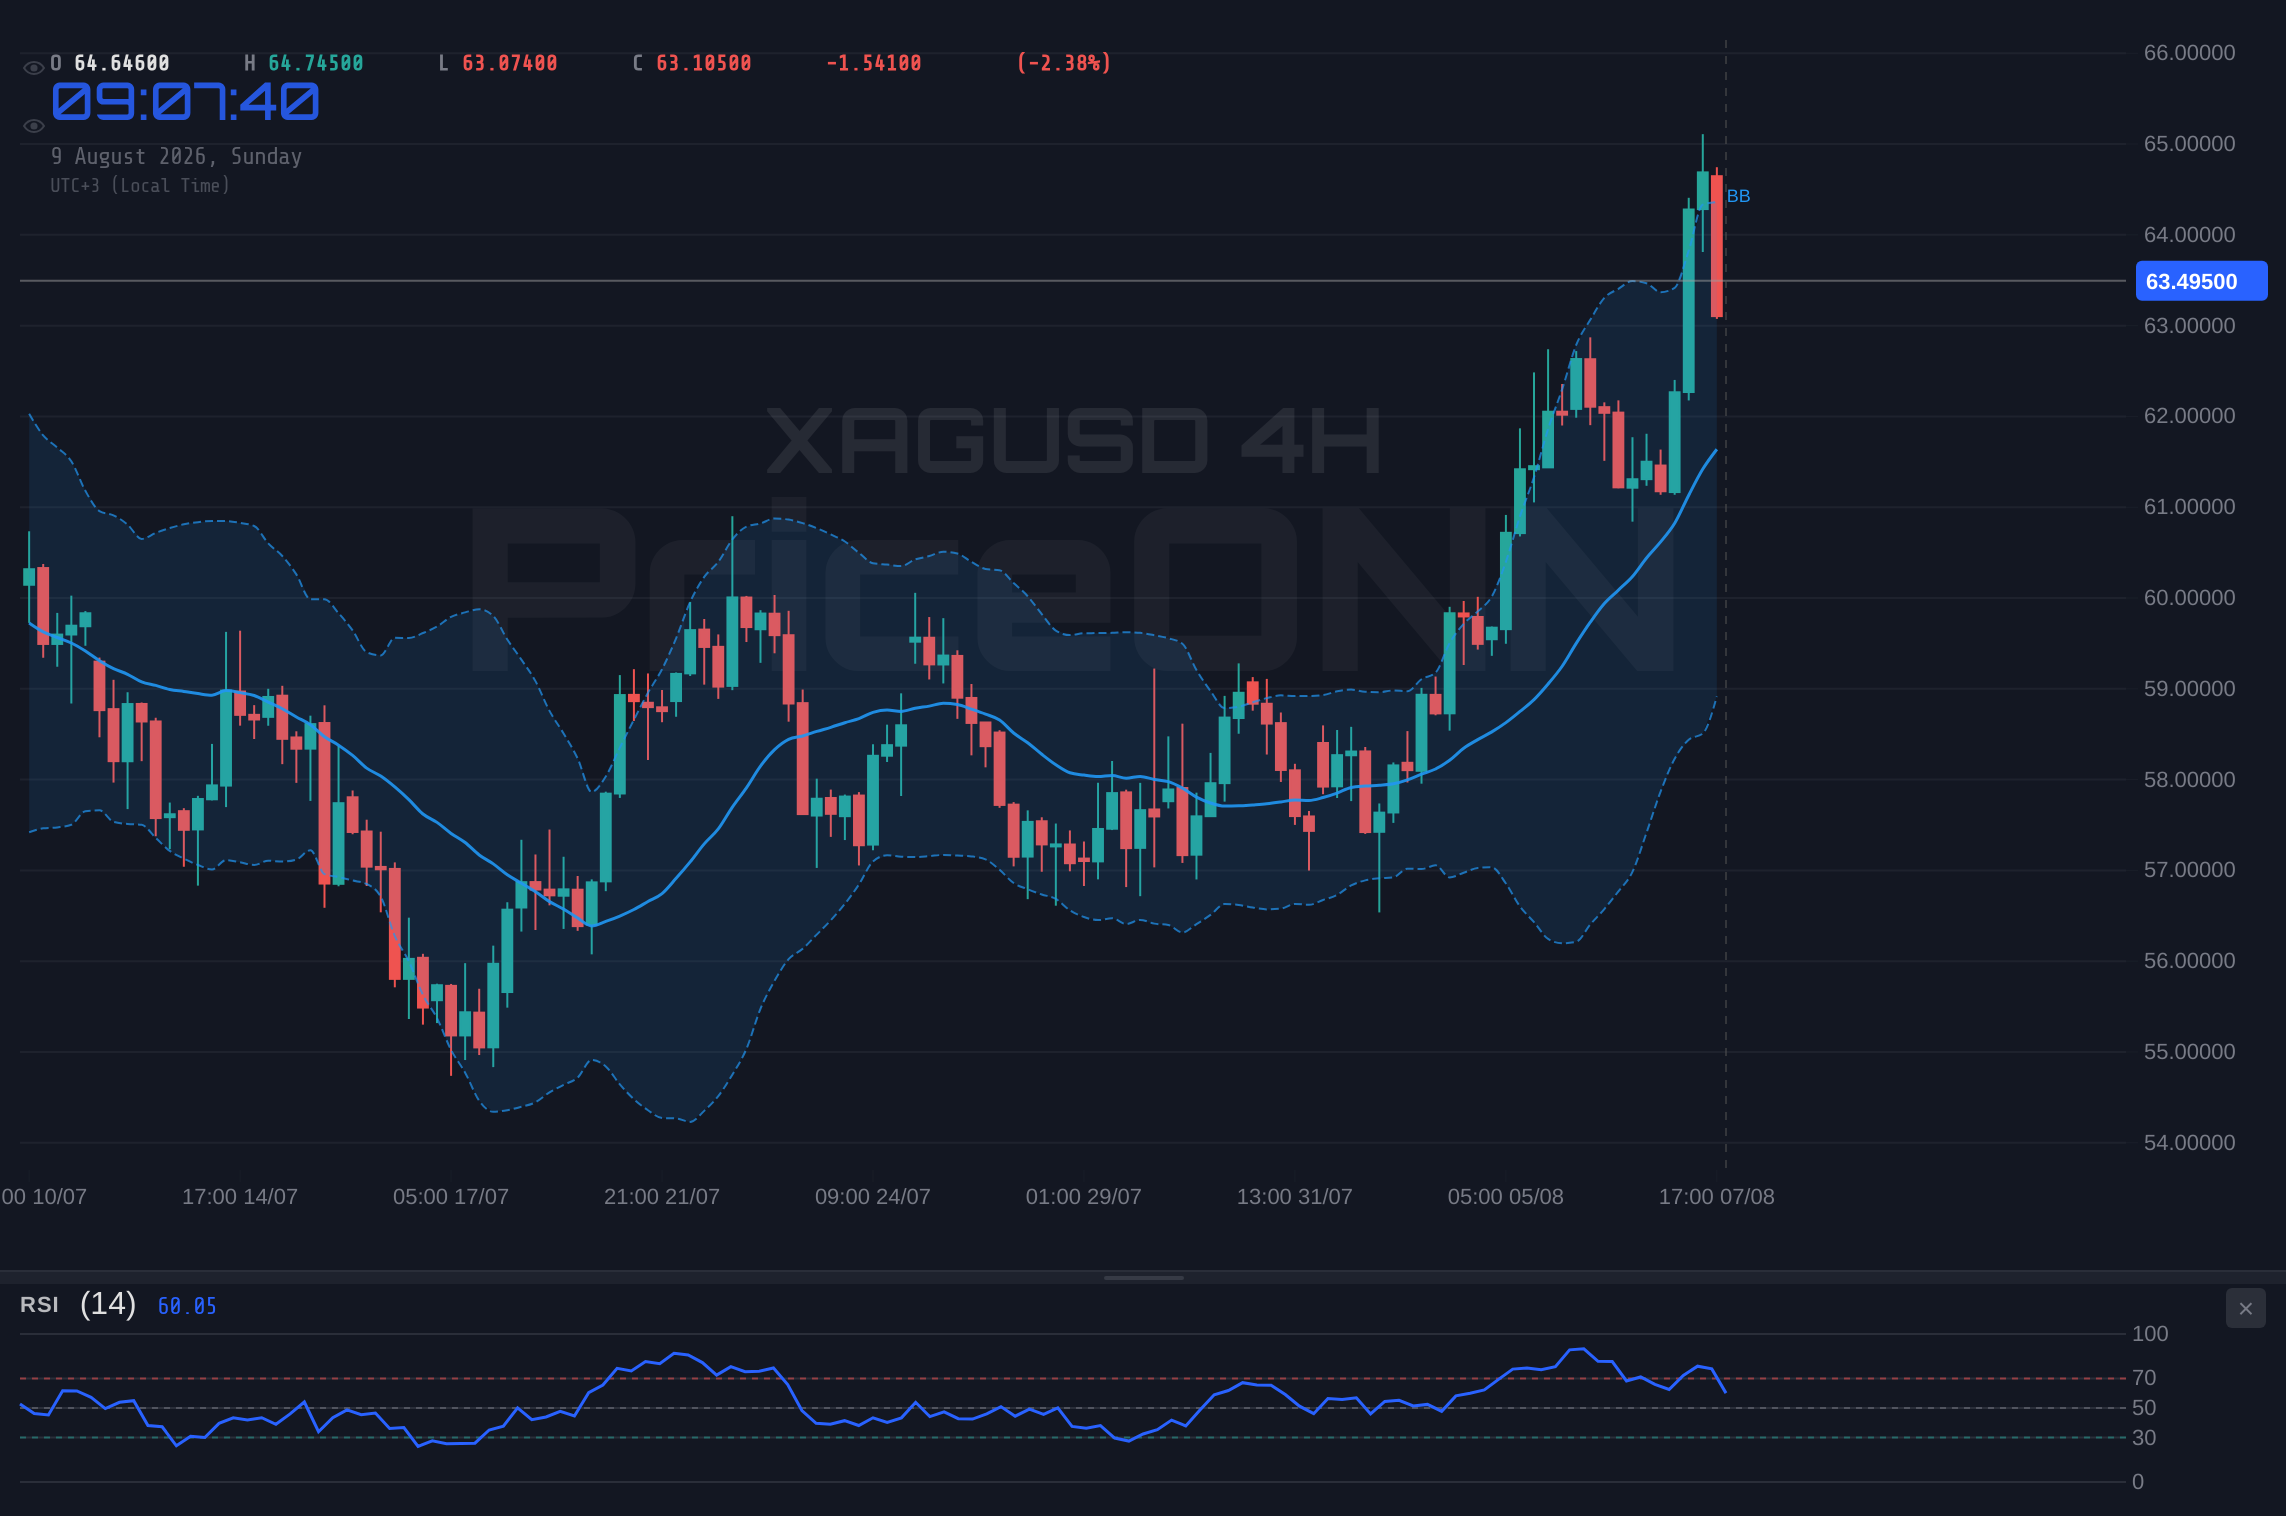
Examining the technical landscape of XAGUSD reveals a predominantly bullish sentiment, particularly when viewed through the lens of the 4-hour and daily charts. On the 4H timeframe, the trend strength is overwhelmingly bullish with an ADX reading of 40.51, indicating a strong prevailing trend. The Relative Strength Index (RSI) at 72.29 is firmly in overbought territory, which historically can signal a pause or pullback, but in strong uptrends, it can remain elevated for extended periods. This is corroborated by the Stochastic indicator, where %K at 86.99 is above %D at 65.83, confirming upward momentum and an overbought condition. The MACD also shows positive momentum, trading above its signal line. These indicators, while flashing overbought signals, are embedded within a clear uptrend on this timeframe.
On the daily chart, the picture remains constructive, although the trend strength (ADX at 27.02) is categorized as strong but less emphatic than on the 4H. The RSI sits at 65.48, still within the neutral zone but exhibiting an upward inclination, suggesting room for further gains before reaching extreme levels. The Stochastic indicator here also shows a bullish signal (%K at 87.86, %D at 59.64), reinforcing the upward trajectory. The Bollinger Bands on the daily chart are trading above the middle band, indicating a bullish bias, and potentially testing the upper band. This confluence of indicators, despite the overbought readings on shorter timeframes, paints a picture of underlying strength. However, it's crucial to acknowledge the potential for pullbacks. The 1H chart, while still showing a 'BUY' signal (7 Buy, 1 Sell, 0 Neutral), presents a more nuanced view with an RSI of 64.41 and Stochastic showing a bearish crossover (%K
The key takeaway from the technical indicators is that while the medium-term trend (4H and Daily) remains strongly bullish, the shorter-term 1H chart is showing signs of fatigue. This divergence suggests that any further upside may be met with increased resistance, and a period of consolidation or a minor pullback is a distinct possibility before the trend can resume its upward path. The ADX readings across timeframes (1H: 35.76, 4H: 40.51, 1D: 27.02) are particularly noteworthy. The high readings on the 1H and 4H indicate strong trending conditions, but the lower reading on the daily suggests that the overall trend might not have the same conviction as seen on intraday charts, or that the broader market is entering a phase where trend strength is waning. This reinforces the need for careful risk management and a focus on key support and resistance levels.
Key Levels and Price Action: $63.14 Support Holds the Line
The price action for XAGUSD this past week has been dictated by its ability to hold critical support levels, particularly the zone around $63.14. Following the NFP report, silver surged, but its ability to sustain these gains hinged on whether previous support areas would act as a springboard rather than a ceiling. The data shows that on the 1H timeframe, support levels were identified at $63.30, $63.26, and $63.20. While the price briefly dipped towards these levels, the $63.14 mark, identified as a key support on the 4H chart, proved to be a crucial floor. The fact that this level held, and the subsequent bounce pushed XAGUSD back above $63.50, is a significant bullish signal for the short-to-medium term. It suggests that demand is present at these higher prices, absorbing selling pressure.
On the resistance side, the 1H chart shows immediate hurdles at $63.40, $63.51, and $63.65. The price managed to break above $63.51, closing the week near $63.50, indicating that the immediate resistance was overcome. However, the more significant resistance levels lie on the 4H chart, beginning with $63.96, followed by $65.26, and then $65.83. The ability of XAGUSD to push through these levels will be critical in determining the extent of any further rally. The daily chart resistance levels, starting at $62.63, then $63.77, and $64.66, also provide context. The fact that the price is trading above the $63.50 mark, which is very close to the daily resistance of $63.77, suggests that a decisive breakout above this level could open the door for further upside towards $64.66 and beyond.
The interplay between these support and resistance levels is paramount. The holding of $63.14 support, coupled with the breach of immediate 1H resistance, suggests that the bulls have gained tactical control. However, the proximity to the 4H resistance at $63.96 and the daily resistance at $63.77 means that the upward momentum could face stiff headwinds. A close above $63.96 on the 4H chart would be a strong indicator of continued bullish sentiment, potentially targeting the next resistance at $65.26. Conversely, a failure to hold above $63.14, especially with increased selling volume, would invalidate the current bullish thesis and could lead to a sharp retracement, potentially targeting the lower support levels on the daily chart, such as $60.60 and $59.71. The price action around $63.50 will be closely watched as a potential pivot zone for the coming week.
Correlation Analysis: DXY Weakness and Geopolitical Undercurrents
The recent price action in XAGUSD cannot be fully understood without considering its correlations with other major market instruments. The most significant correlation at play is with the US Dollar Index (DXY). As mentioned, the weak NFP report caused the DXY to fall from around 99.55 towards 99.50. This inverse relationship is critical; a weaker dollar generally makes dollar-denominated commodities like silver cheaper for holders of other currencies, thus increasing demand. The current DXY reading is around 99.55, and its trajectory will be closely monitored. A sustained move below 99.50 could provide further support for silver, while a recovery above 99.60 might signal renewed pressure on XAGUSD.
Another important correlation is with oil prices, particularly Brent crude. With Brent trading around $81.23, down 1.39% for the week, the energy market itself is showing some weakness. However, the underlying geopolitical tensions, specifically around the Strait of Hormuz, are a wild card. Reports highlighted that US energy is helping to cushion global supply shocks, but any escalation in the Middle East could quickly send oil prices, and by extension inflation expectations, higher. Higher inflation is typically bullish for silver. While Brent is currently trading at $81.23, the geopolitical risk premium remains a key factor. If oil prices were to rebound sharply due to geopolitical events, it would add another layer of support for silver, independent of the Fed's policy path.
Equities, represented by the SP500 and Nasdaq100, also play a role. The SP500 is currently trading at 6572.87, up 0.74% for the week, showing a risk-on sentiment. The Nasdaq100 is also higher at 29708.86, up 1.11%. Generally, a strong risk appetite in equities can sometimes detract from safe-haven demand for precious metals. However, the current narrative around silver seems to be driven more by Fed policy expectations and inflation hedges than by a pure risk-off move. The divergence between the strong equity performance and the surge in silver, despite the latter often being considered a safe haven, highlights the complexity of market drivers. It suggests that the primary catalyst for silver's recent rise is its appeal as an inflation hedge and a beneficiary of a weaker dollar, rather than a flight to safety from equities.
Fundamental Drivers: Fed Policy vs. Geopolitical Uncertainty
The fundamental landscape for silver is currently shaped by two dominant, yet opposing, forces: the evolving stance of the Federal Reserve and escalating geopolitical risks. The July NFP report, which revealed a surprising job loss, has significantly altered the calculus for the Fed. Prior to this data, the market was largely pricing in at least one more rate hike in 2024. However, the weak employment figures have pushed these expectations back, with many now anticipating a Fed pause for the remainder of the year. This shift towards a more dovish outlook is inherently supportive of silver. Lower interest rates reduce the opportunity cost of holding non-yielding assets like precious metals and can weaken the dollar, as observed this past week.
The implications of a potential Fed pivot are substantial. If the Fed indeed signals a halt to its tightening cycle, or even begins to hint at future rate cuts, it would likely keep the DXY under pressure. This sustained dollar weakness would provide a consistent tailwind for XAGUSD. Furthermore, lower real yields, a consequence of a less hawkish Fed, tend to make gold and silver more attractive to investors seeking yield enhancement or inflation protection. This narrative is further amplified by ongoing geopolitical concerns. The situation in the Strait of Hormuz, coupled with US-China trade friction, adds a layer of uncertainty that typically benefits precious metals. While Brent crude prices have seen some pullback, the potential for supply disruptions remains a latent threat, capable of reigniting inflation fears and boosting demand for safe-haven assets like silver.
However, the market's reaction to these fundamental drivers is not always straightforward. The fact that equities are simultaneously performing strongly (SP500 up 0.74%, Nasdaq up 1.11%) suggests that the 'risk-on' sentiment is not entirely absent. This could imply that investors are selectively embracing risk assets while still seeking inflation hedges. The challenge for traders is to discern which narrative will ultimately dominate. Will the prospect of a Fed pause outweigh the geopolitical risks, or could an escalation in global tensions overshadow domestic monetary policy considerations? The current price of XAGUSD at $63.50 reflects a market trying to balance these competing forces. The upcoming week's economic calendar, particularly any further commentary from Fed officials or developments on the geopolitical front, will be crucial in providing clarity.
Scenario Analysis: Mapping Potential Paths for XAGUSD
Given the current technical and fundamental crosscurrents, projecting the next move for XAGUSD requires a scenario-based approach. The market is at a pivotal juncture, with key levels and conflicting indicators suggesting that the path forward may not be straightforward. The strong bullish signals on the 4H and daily charts, coupled with the immediate resistance near $63.96 and the overbought conditions on shorter timeframes, create a scenario where consolidation or a brief pullback is a distinct possibility before any sustained upward move can materialize. Conversely, a decisive break above key resistance levels, potentially fueled by further dollar weakness or escalating geopolitical news, could propel silver higher.
The probabilities assigned reflect the current balance of technical strength and the prevailing fundamental narrative. The bullish scenario, while supported by the strong 4H trend, faces headwinds from overbought indicators and key resistance. The bearish scenario, while less probable given the current trend, is always a risk when indicators flash overbought. The neutral scenario acknowledges the potential for consolidation as the market digests recent news and waits for clearer direction. The upcoming week's economic data and geopolitical developments will be the key determinants in which scenario ultimately unfolds. Traders should remain vigilant, focusing on the price action around the identified support and resistance levels.
Bearish Scenario: Consolidation or Reversal
35% ProbabilityNeutral Scenario: Range-Bound Action
30% ProbabilityBullish Scenario: Continued Momentum
35% ProbabilityThe Week Ahead: Key Events and Levels to Watch
Looking ahead, the market will remain highly sensitive to macroeconomic data and geopolitical developments. The fallout from the weak NFP report will continue to influence Fed expectations, with any further commentary from Fed officials being closely scrutinized. Investors will be particularly attuned to any signals regarding the Fed's stance on future rate hikes or potential cuts. The US CPI data due next week will be a critical release, providing a fresh look at inflation dynamics and potentially solidifying or challenging the current Fed pause narrative. A higher-than-expected CPI reading could reignite hawkish Fed expectations, putting pressure on silver, while a lower reading would further support the case for a dovish pivot.
Geopolitical developments will also remain a significant factor. Any escalation or de-escalation in the Middle East, particularly concerning the Strait of Hormuz, could cause sharp swings in oil prices and, consequently, impact inflation expectations and silver's safe-haven appeal. Traders will be watching for any official statements or actions from major global powers that could either ease or heighten tensions. The interplay between these macro drivers and the technical levels on XAGUSD will define the trading landscape. Key levels to watch remain the $63.14 support and the $63.96 resistance on the 4H chart. A decisive break above $63.96 could target $65.26, while a failure to hold $63.14 might lead to a retest of lower levels, potentially down to $60.60.
| Indicator | Value | Signal | Interpretation |
|---|---|---|---|
| RSI (14) | 65.03 | Neutral | Approaching overbought, potential for consolidation on 4H. |
| MACD Histogram | +X.XX | Bullish | Positive momentum on 4H, above signal line. |
| Stochastic | K:86.99, D:65.83 | Bullish | Strong upward momentum, but in overbought zone on 4H. |
| ADX | 40.51 | Strong Trend | Confirms a strong uptrend on the 4H timeframe. |
| Bollinger Bands | Above Mid | Bullish | Price trading above the middle band on 4H, indicating bullish bias. |
Frequently Asked Questions: XAGUSD Analysis
What happens if XAGUSD breaks below the critical $63.14 support level?
A break below $63.14 on the 4H chart would invalidate the current bullish thesis and could trigger a sharp pullback. The immediate target would likely be the next significant support at $62.67, followed by the daily support at $60.60, suggesting a potential 3-5% decline from current levels.
Should I buy XAGUSD at current levels around $63.50 given the RSI is near overbought?
Buying directly into overbought territory carries risk. While the 4H trend is strong, a pullback is possible. A more prudent approach might be to wait for a confirmation pullback to a key support level like $63.14, or a decisive breakout above $63.96 resistance, before entering. This reduces risk and improves the risk-reward ratio.
Is the Stochastic crossover signal on the 1H chart a sell signal for XAGUSD at $63.50?
The Stochastic %K (67.88) crossing below %D (75.16) on the 1H chart does indicate a short-term bearish signal, suggesting immediate selling pressure. However, this conflicts with the stronger bullish trends on the 4H and daily charts. It implies potential for short-term consolidation or a minor dip rather than a full reversal, especially if key support levels hold.
How will upcoming US CPI data affect XAGUSD this week, given the weak NFP?
If the upcoming US CPI data comes in lower than expected, it would reinforce the narrative of cooling inflation and a dovish Fed, likely weakening the dollar further and supporting XAGUSD above $63.50. Conversely, hotter-than-expected inflation would challenge this view, potentially leading to dollar strength and pressure on silver, possibly pushing it back towards $63.14 support.
Track markets in real-time
AI-powered analysis, technical indicators and real-time price data.
Join Our Telegram Channel
Breaking market news, AI analysis and trading signals instantly.
Join Channel