

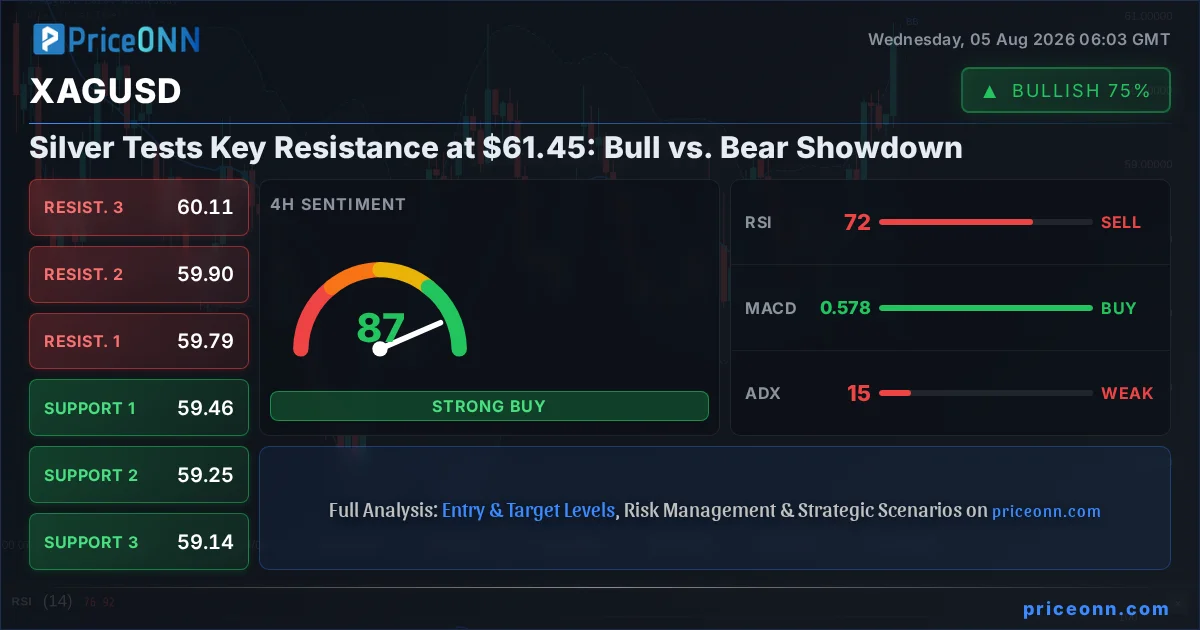
The precious metals market is currently witnessing a fierce tug-of-war around the $61.45 mark for silver (XAGUSD), a critical juncture where the bulls and bears are locked in a heated debate. This pivotal price point isn't just another number; it represents a significant battleground that could dictate the short-to-medium term trajectory for the white metal. As traders digest the latest market data, the question on everyone's mind is whether silver has the momentum to push higher or if this resistance will prove too formidable, leading to a sharp pullback. The current technical readings offer a complex tapestry of signals, highlighting the indecision and the high stakes involved in this unfolding price action.
- Silver (XAGUSD) is currently trading at $61.45, testing a key resistance level.
- The 1-hour RSI is at 82.6, signaling extreme overbought conditions that could precede a pullback.
- However, the 1-day ADX at 27.38 indicates a strong upward trend is still in play, suggesting underlying strength.
- The DXY is trading near 99.85, showing a slight bearish bias which typically supports precious metals like silver.
The Bullish Case: Momentum and Macro Tailwinds
On the bullish side, the narrative is supported by several compelling technical indicators and broader market conditions. The 1-hour timeframe, in particular, paints a picture of strong upward momentum. With the RSI(14) soaring to 82.6, it indicates extreme buying pressure, often a precursor to further upside, although it also flags potential overbought conditions that could lead to profit-taking. The MACD is firmly in positive territory, trading above its signal line, which suggests that momentum is still on the side of the buyers. Furthermore, the Stochastic Oscillator on the 1-hour chart shows %K at 89.16 and %D at 69.58, confirming the strong bullish signal with %K comfortably above %D, indicating ongoing upward pressure. The ADX at 38.46 on the 1-hour chart is particularly noteworthy, signaling a very strong uptrend, suggesting that if a breakout occurs, it could be substantial. The overall signal on the 1-hour timeframe is a resounding 'BUY' with 7 out of 8 indicators aligning in that direction.
The daily chart, while showing a more neutral stance with a 50% trend strength, still offers some bullish undertones. The RSI(14) at 55.46 is in the neutral zone but trending upwards, suggesting room for further gains before hitting overbought territory. The MACD is also positive on this timeframe, supporting the idea of underlying strength. Even the ADX on the daily chart, at 25, indicates a strong trend, contradicting the neutral trend strength classification and suggesting that the upward move has a solid foundation. This confluence of indicators across multiple timeframes, particularly the strength shown on shorter timeframes, provides a solid foundation for the bull case, implying that silver has the potential to climb higher if current levels are breached.
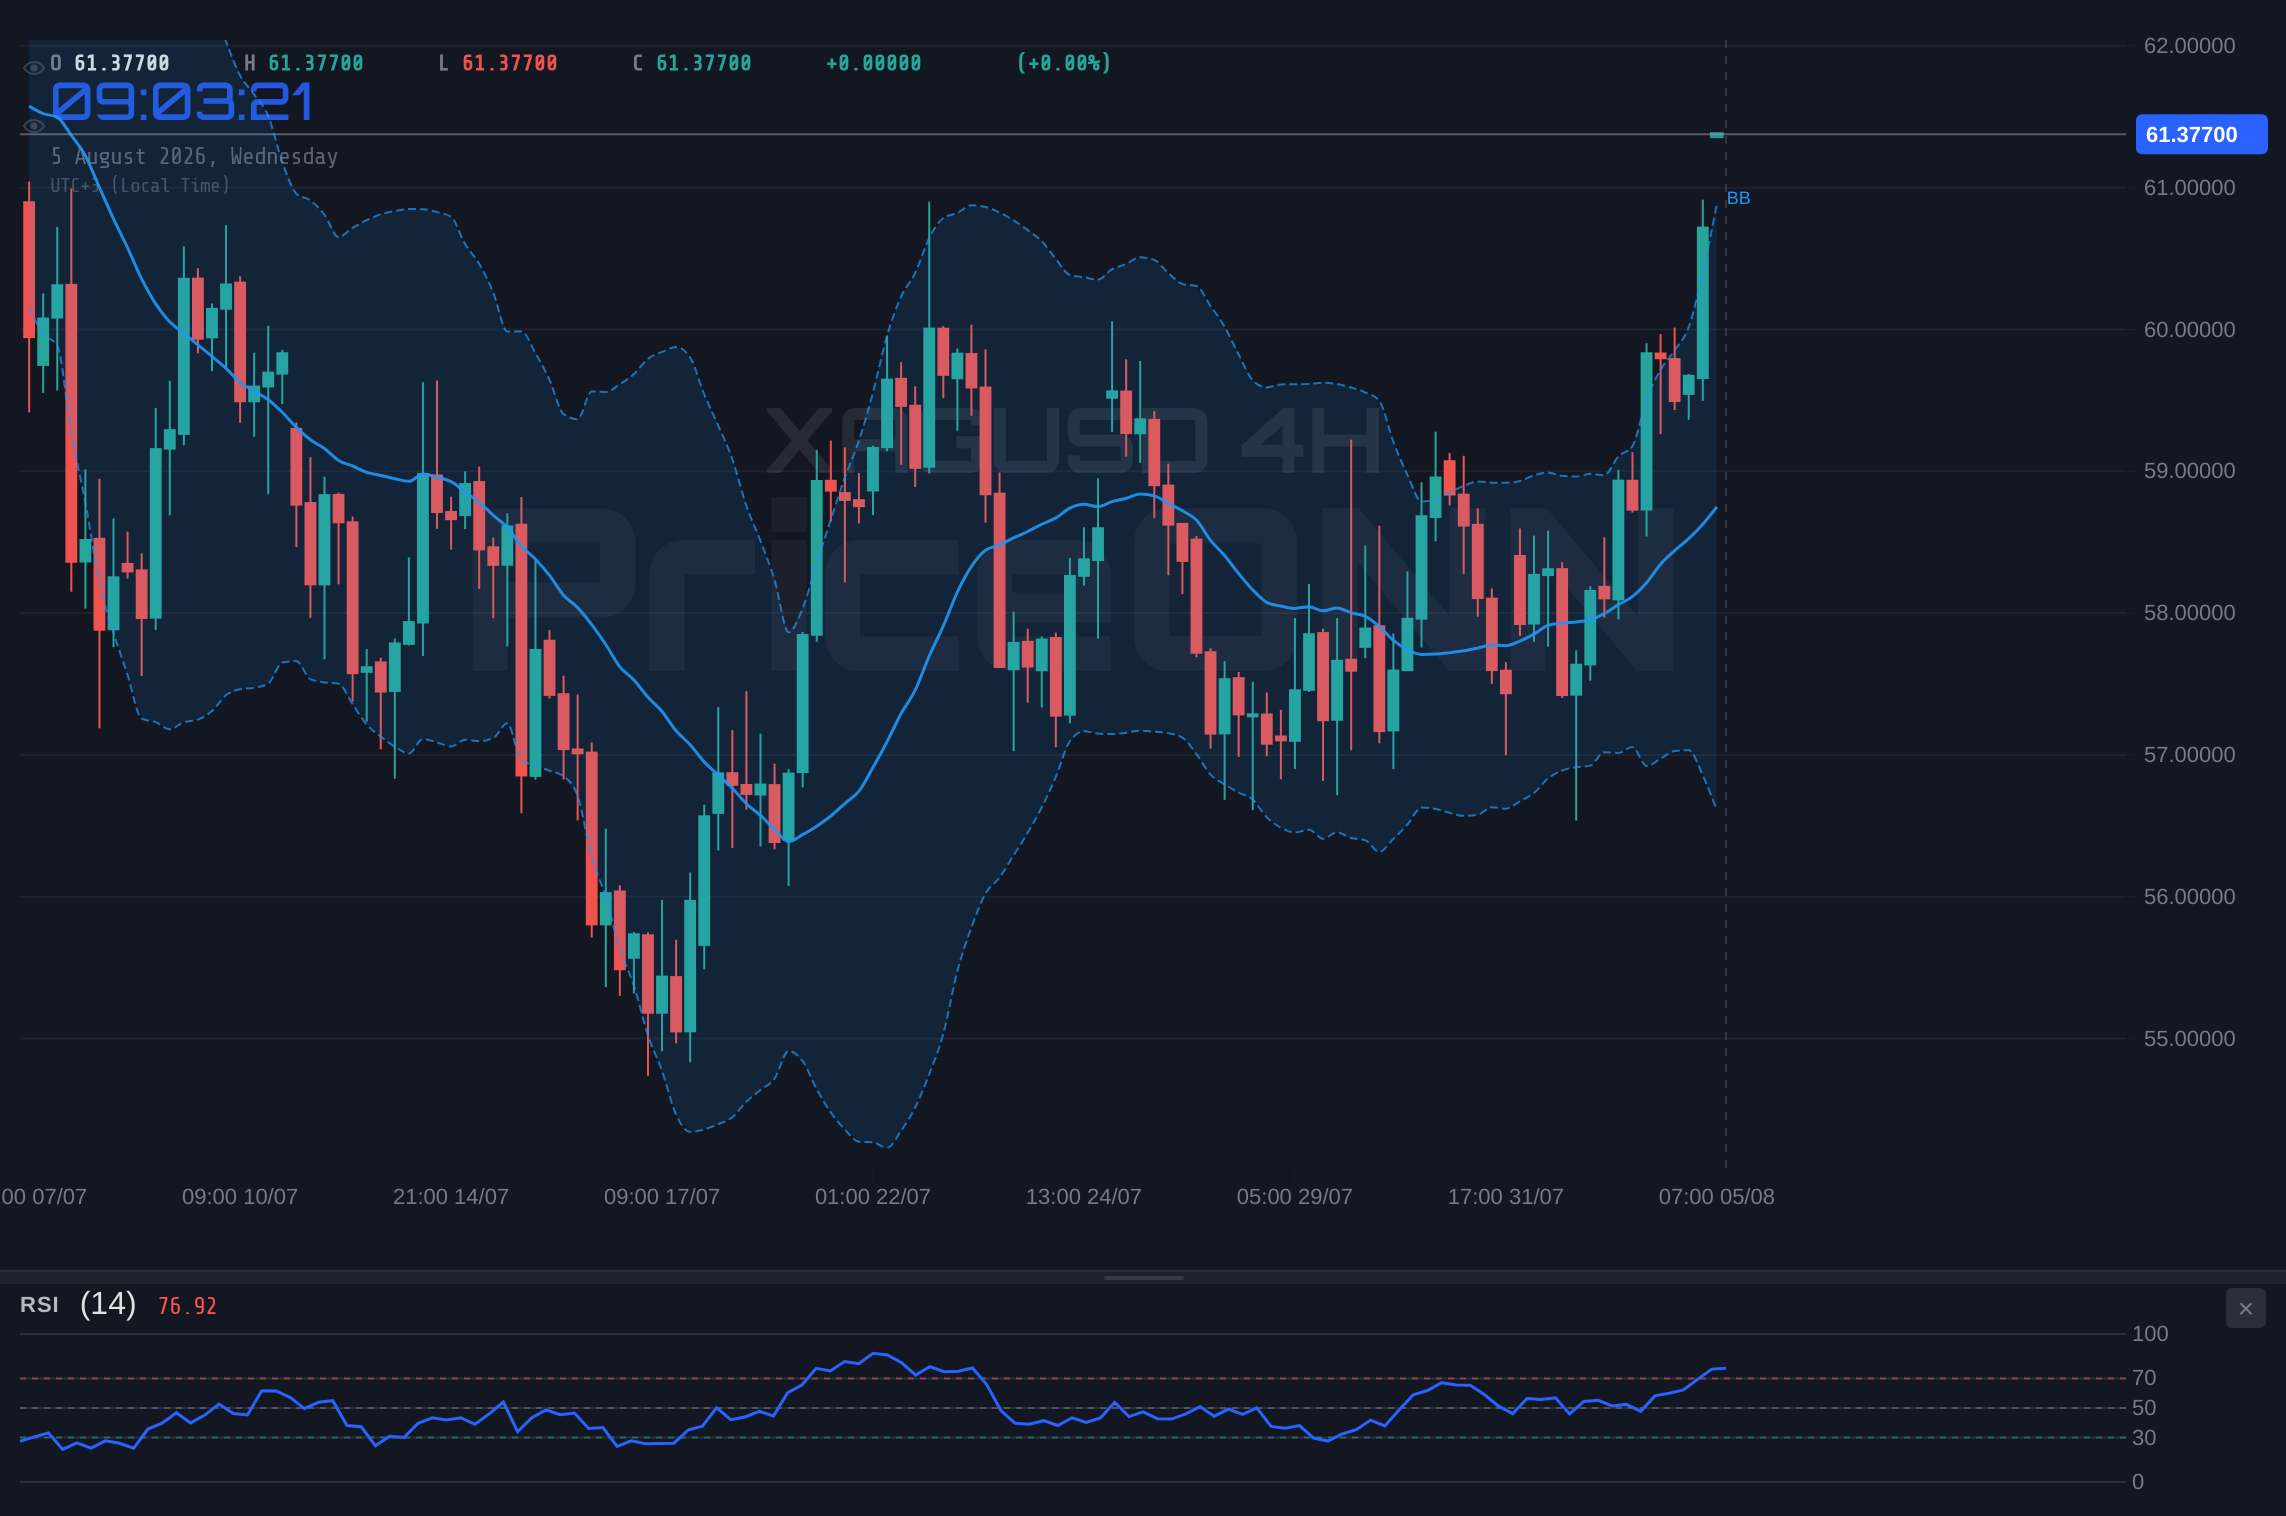
Adding to the bullish sentiment is the macroeconomic backdrop. The Dollar Index (DXY) is currently trading around 99.85, showing a slight downward bias. Historically, a weaker dollar tends to correlate positively with precious metals like silver, as it becomes cheaper for holders of other currencies. The recent news flow, while mixed, has also provided some support. For instance, reports of Fresnillo's profits tripling due to surging gold and silver prices, despite lower production, highlight the underlying demand and profitability in the precious metals sector. This suggests that broader market interest and investor sentiment towards precious metals remain robust, providing a fertile ground for silver prices to ascend further.
The Bearish Counterpoint: Overbought Extremes and Trend Weakness
However, the bullish outlook is far from guaranteed, and a robust bearish case can be constructed by focusing on the extreme overbought readings and signs of trend exhaustion, particularly on longer timeframes. The RSI(14) on the 1-hour chart is a flashing red light at 82.6, well into overbought territory. While it can stay overbought for extended periods, such extreme levels often precede sharp corrections or consolidations as traders look to lock in profits. Similarly, the Stochastic Oscillator on the 1-hour chart, with %K at 89.16, is also screaming 'overbought,' suggesting that the current upward momentum may be unsustainable in the very short term. This could lead to a reversal or a period of consolidation as the market digests these extreme readings.
The picture becomes more nuanced when looking at the 4-hour and daily charts. On the 4-hour timeframe, the RSI is at 71.81, still in overbought territory, and the ADX at 13.34 indicates a weak trend, suggesting that the strong momentum seen on the 1-hour chart might not be translating into a sustained trend on higher timeframes. This divergence between the short-term momentum and the weaker trend strength on the 4-hour chart is a cause for caution. On the daily chart, while the ADX at 25 suggests a strong trend, the RSI at 55.46 is neutral, and the Stochastic Oscillator's %K (62.09) just above %D (48.74) offers a milder bullish signal compared to the shorter timeframes. This suggests that while the overall trend might be up, the immediate buying pressure could be waning, opening the door for sellers to step in.
Furthermore, the broader economic context, while offering some support for precious metals, also presents risks. While the DXY shows a slight dip, its proximity to 100 implies that any shift in Federal Reserve policy expectations or a resurgence in global risk aversion could quickly strengthen the dollar, putting significant pressure on silver. The recent news regarding WTI Crude Oil trimming losses and the risk of further declines, coupled with the AUD/NZD facing pressure due to inflation data, hints at potential headwinds for commodities. Even though Fresnillo reported strong earnings, this was attributed to price rallies, not necessarily to a fundamental increase in demand that would sustain further price appreciation against broader economic uncertainties.
Navigating the Levels: $60.35 as a Critical Pivot
The battle lines are clearly drawn, with specific price levels acting as crucial pivot points. On the resistance side, the immediate hurdle for silver lies at $60.83, followed by $60.93 and $61.03 on the 1-hour chart. A decisive break and hold above these levels could signal a continuation of the bullish trend, potentially targeting higher resistance levels such as $61.41, $61.48, and $61.55. The daily resistance levels are even more significant, with $61.38, $62.41, and $63.10 representing the next major upside targets if the bulls manage to maintain control and push through the current congestion. The $61.45 current price is nestled just below the 1-hour resistance cluster, making it a key area to watch for immediate price action.
Conversely, the support levels are paramount for the bears. On the 1-hour chart, immediate support can be found at $60.62, followed by $60.53 and $60.42. A break below these could signal a short-term reversal. The 4-hour support levels at $59.46, $59.25, and $59.14 are more significant, representing a more substantial floor. If these levels fail, the daily support at $58.30, $57.10, and $56.24 would come into play. The mention of $60.35 in the article prompt as a 'key level' aligns with the daily resistance found at $60.35, making it a critical psychological and technical barrier that needs to be overcome for the bulls to gain the upper hand. A failure to break above this level could see prices retreat towards the previously mentioned support areas.
The interplay between these support and resistance levels, viewed through the lens of the current technical indicators, creates a complex trading environment. The high RSI and Stochastic readings suggest a potential for a short-term pullback from current resistance, while the strong ADX on shorter timeframes hints at the possibility of a bullish breakout. This divergence is precisely why traders must exercise caution and wait for confirmation. The ADX reading of 13.34 on the 4-hour chart, indicating a weak trend, further complicates the outlook, suggesting that the market is currently range-bound or consolidating, making it difficult to predict the direction with high conviction without a clear break of key levels.
Bearish Scenario: Resistance Holds Firm
65% ProbabilityBullish Scenario: Breakout Confirmation
25% ProbabilityNeutral Scenario: Range-Bound Consolidation
10% ProbabilityFrequently Asked Questions: XAGUSD Analysis
What happens if XAGUSD fails to break above the $61.03 resistance level?
If XAGUSD fails to break and hold above the $61.03 resistance, a bearish scenario becomes more probable. This could lead to a pullback towards the immediate 1-hour support at $60.62, and potentially further down to the 4-hour support at $59.46. The extreme overbought readings on the 1-hour RSI (82.6) would support such a move.
Should I buy XAGUSD at current levels of $61.45 given the mixed signals?
Buying at current levels of $61.45 is a high-risk proposition due to the mixed signals and the proximity to resistance. While the 1-hour trend is strong, the overbought RSI and weaker trend on higher timeframes suggest caution. A more prudent approach would be to wait for a confirmed breakout above $61.03 or a clear pullback to a more defined support level like $60.62, with a 65% probability favoring a bearish move in the short term.
Is the RSI at 82.6 a sell signal for XAGUSD right now?
An RSI reading of 82.6 on the 1-hour chart indicates extreme overbought conditions, which historically can precede a price reversal or consolidation. While it doesn't automatically trigger a sell signal, it strongly suggests that further upside may be limited in the immediate short term and that profit-taking is likely to increase.
How will the slight bearish bias in DXY affect XAGUSD this week?
With the DXY trading around 99.85 and showing a slight bearish bias, this typically provides a tailwind for precious metals like XAGUSD. A weaker dollar makes silver cheaper for international buyers, potentially increasing demand and supporting higher prices. However, this effect could be counteracted if risk aversion increases, causing a flight to the dollar as a safe haven.
| Indicator | Value | Signal | Interpretation |
|---|---|---|---|
| RSI (14) | 81.68 | Overbought | Extreme buying pressure, potential for pullback. |
| MACD Histogram | +1.95 | Positive Momentum | Buyers are in control, momentum is strong. |
| Stochastic (%K/%D) | 89.16 / 70.75 | Overbought | Extreme levels suggest caution, potential reversal near. |
| ADX | 38.46 | Strong Trend | Confirms a robust upward trend on the 1H chart. |
| Bollinger Bands | Upper Band Break | Watch | Price above upper band signals overextension. |
The battle for silver at $61.45 is more than just a technical observation; it's a reflection of the broader market's uncertainty. With extreme readings on shorter timeframes clashing with longer-term trend strength, traders are in a precarious position. The key takeaway is to not chase the current price action but to wait for a clear signal. A confirmed breakout above the $61.03 resistance, supported by increasing volume and sustained price action, would validate the bullish scenario. Conversely, a failure to breach this level, coupled with a close below $60.62, would likely signal a short-term correction, offering potential opportunities for bears. Until then, patience and disciplined risk management remain the most valuable tools in any trader's arsenal.
As we look ahead, the interplay between macroeconomics and technicals will be crucial. The direction of the US Dollar, inflation expectations, and geopolitical stability will all play a role in shaping silver's path. The current technical setup, while offering hints of potential moves, demands confirmation. Traders should remain vigilant, observe the price action around the key levels identified, and be prepared to act decisively when the market provides a clearer directional bias. The current consolidation around $61.45 is a period of digestion, and the next significant move will likely be driven by a clear catalyst, whether it's a technical breakout or a shift in fundamental drivers.
Ultimately, the current price action for silver is a testament to the dynamic nature of financial markets. The $61.45 level is a critical test, and the outcome will hinge on whether the underlying bullish momentum can overcome the overbought conditions and resistance. Having tracked silver through various market cycles, it's clear that such junctures often present the most significant opportunities for those who can wait for the right setup and manage their risk appropriately. The strong ADX on the 1-hour chart suggests that if a breakout does occur, it could be sharp, but the weaker trend on the 4-hour chart tempers immediate enthusiasm. This is precisely where a disciplined approach, focusing on confirmed signals rather than speculation, pays off.
The market sentiment, as indicated by the technical dashboard, is indeed mixed, with conflicting signals from RSI and Stochastic versus MACD and ADX on different timeframes. This is a classic scenario where adherence to a well-defined trading plan is essential. For instance, a breakout trader might wait for a clear close above $61.03 with increased volume, while a range trader might look to fade moves towards resistance or buy dips near support. The price action around $61.45 will be closely watched by many, and the narrative could shift rapidly based on incoming economic data or geopolitical developments. The key is to remain adaptable and let the market dictate the next move, rather than forcing a trade into an uncertain environment.
The historical context also offers some perspective. Periods of high RSI readings, like the current 82.6 on the 1-hour chart, have often been followed by sharp pullbacks, even within broader uptrends. However, the strong ADX of 38.46 indicates that the current trend has significant power behind it. This dichotomy is what makes trading challenging but also rewarding. The ability to weigh these conflicting signals, understand the potential probabilities of different scenarios, and act with defined risk parameters is what separates successful traders. For XAGUSD at $61.45, the immediate future likely holds increased volatility as these opposing forces battle for control, making it a critical watch for all market participants.
The recent news highlighting Fresnillo's triple profits due to silver price rallies underscores the demand side of the equation. This suggests that despite potential macroeconomic headwinds, the fundamental appeal of silver as a precious metal and an industrial commodity remains strong. This underlying demand could provide the fuel for a bullish breakout if technical conditions align. However, it's crucial to remember that market sentiment can shift rapidly, and such price rallies can attract profit-taking, especially when indicators reach extreme levels. The $61.45 mark, therefore, represents not just a technical resistance but also a psychological threshold where the market's conviction will be tested.
The silver market at $61.45 is at a critical crossroads. The bulls have momentum on their side, particularly on shorter timeframes, fueled by a weaker dollar and positive sentiment in precious metals. However, the bears are lurking, ready to pounce on the extreme overbought readings and potential trend weakness on longer timeframes. The probability of a bearish scenario currently outweighs the bullish one due to these overbought conditions and the significant resistance levels ahead. Traders should exercise extreme caution, await clear confirmation of a breakout or breakdown, and prioritize risk management above all else. The market always offers another opportunity, and waiting for the right setup is often the most profitable strategy.
The path forward for silver will likely be determined by its ability to decisively break through the $61.03 resistance zone. If it succeeds, the door could open to further upside, potentially targeting daily resistance levels. However, a failure to do so, especially with the RSI hovering in extreme territory, points towards a consolidation or a pullback. The ADX reading on the 4-hour chart, at 13.34, suggests that the current move might be part of a larger consolidation phase rather than a strong directional trend, adding to the uncertainty. Therefore, vigilance around the $61.45 price point and the immediate support and resistance levels is crucial for navigating this complex market environment.
As we continue to monitor silver's price action, the DXY's movement will remain a key correlated factor. A sustained dip in the dollar would typically support XAGUSD, but the current mixed technical signals suggest that this correlation might be temporarily overshadowed by internal market dynamics. The strong ADX on the 1-hour chart indicates conviction in the current upward move, but the overbought RSI and Stochastic readings are undeniable warning signs. This divergence demands a patient approach, waiting for a clearer picture to emerge from the confluence of technical and fundamental factors. The $61.45 level is a pivotal point, and its resolution will set the tone for silver's next significant price movement.
The current situation for XAGUSD around $61.45 presents a classic bull vs. bear debate, where technical indicators offer conflicting insights. The strong upward momentum on the 1-hour chart is countered by overbought conditions and weaker trend strength on higher timeframes. This complexity underscores the importance of a well-defined trading strategy that accounts for various scenarios and probabilities. The $61.03 resistance level is the immediate focus, and its breach or failure to break will likely dictate the short-term direction. For now, the market is in a state of tension, awaiting a catalyst to break the stalemate and provide a clearer path forward.
Track markets in real-time
AI-powered analysis, technical indicators and real-time price data.
Join Our Telegram Channel
Breaking market news, AI analysis and trading signals instantly.
Join Channel