
Gold Tests Key Resistance at $4,429.70: What's Next for XAUUSD?
XAUUSD hovers near $4,429.70 as bulls face strong resistance. Analysis of RSI, MACD, and DXY correlation suggests caution ahead of key economic data.
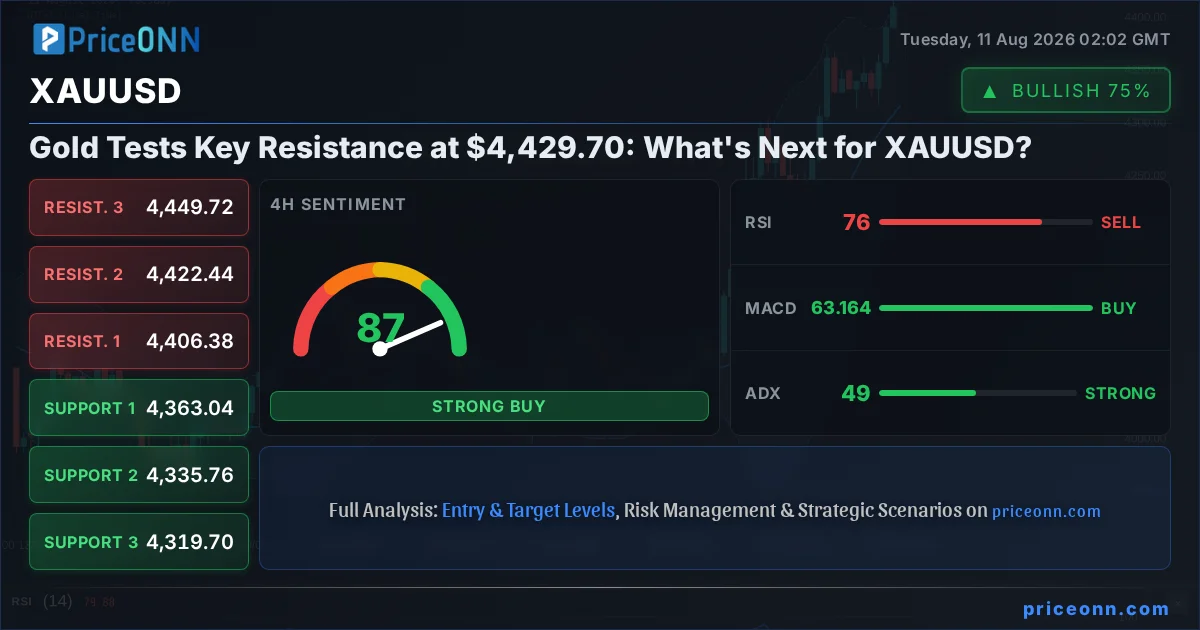
Gold just did something the bulls have been waiting months for, pushing firmly towards the significant $4,429.70 mark. This isn't just another price bump; it's a testament to the sustained buying pressure that has characterized the yellow metal's ascent over the past several weeks. However, as XAUUSD approaches this critical resistance zone, the question on every trader's mind isn't just *if* it can break higher, but *how* it will react to this pivotal level. The confluence of technical indicators and fundamental undercurrents paints a complex picture, demanding a nuanced approach rather than a simple directional bet.
- The RSI at 79.06 on the 1H chart signals extreme overbought conditions, suggesting potential for a short-term pullback.
- XAUUSD is currently testing resistance at $4,420.38, with the next critical hurdle at $4,431.22.
- The Dollar Index (DXY) at 99.79 is showing signs of stabilization, potentially limiting further upside for gold.
- Strong uptrends are indicated across multiple timeframes (1H, 4H, 1D ADX > 28), but the daily RSI at 69.49 suggests room for further gains before extreme overbought territory is reached.
Navigating the Gold Rush: Bulls Push Towards $4,429.70
The Momentum Engine Behind Gold's Surge
The relentless climb in gold prices, culminating in the current trading level around $4,429.70, is not an isolated event. It's fueled by a potent combination of macroeconomic factors and shifting market sentiment. The recent weakness in the US Dollar Index (DXY), which has dipped to 99.79, has provided a significant tailwind. Historically, a weaker dollar often translates to a stronger gold price, as the commodity becomes relatively cheaper for holders of other currencies and attracts safe-haven inflows seeking an alternative store of value. This inverse correlation is a cornerstone of gold market analysis, and its current manifestation is a key driver of the upward momentum we're witnessing.
Furthermore, the persistent concerns about inflation, despite recent data points, keep gold on the radar as a potential hedge. While the latest economic calendar might not have delivered outright inflation spikes, the underlying economic landscape remains uncertain. Central bank policies, particularly the Federal Reserve's stance on interest rates, continue to be a focal point. Any hint of a dovish pivot or a pause in rate hikes can significantly boost gold's appeal by reducing the opportunity cost of holding a non-yielding asset. The market is constantly pricing in these expectations, and the current price action reflects a degree of optimism that the Fed might be nearing the end of its tightening cycle.
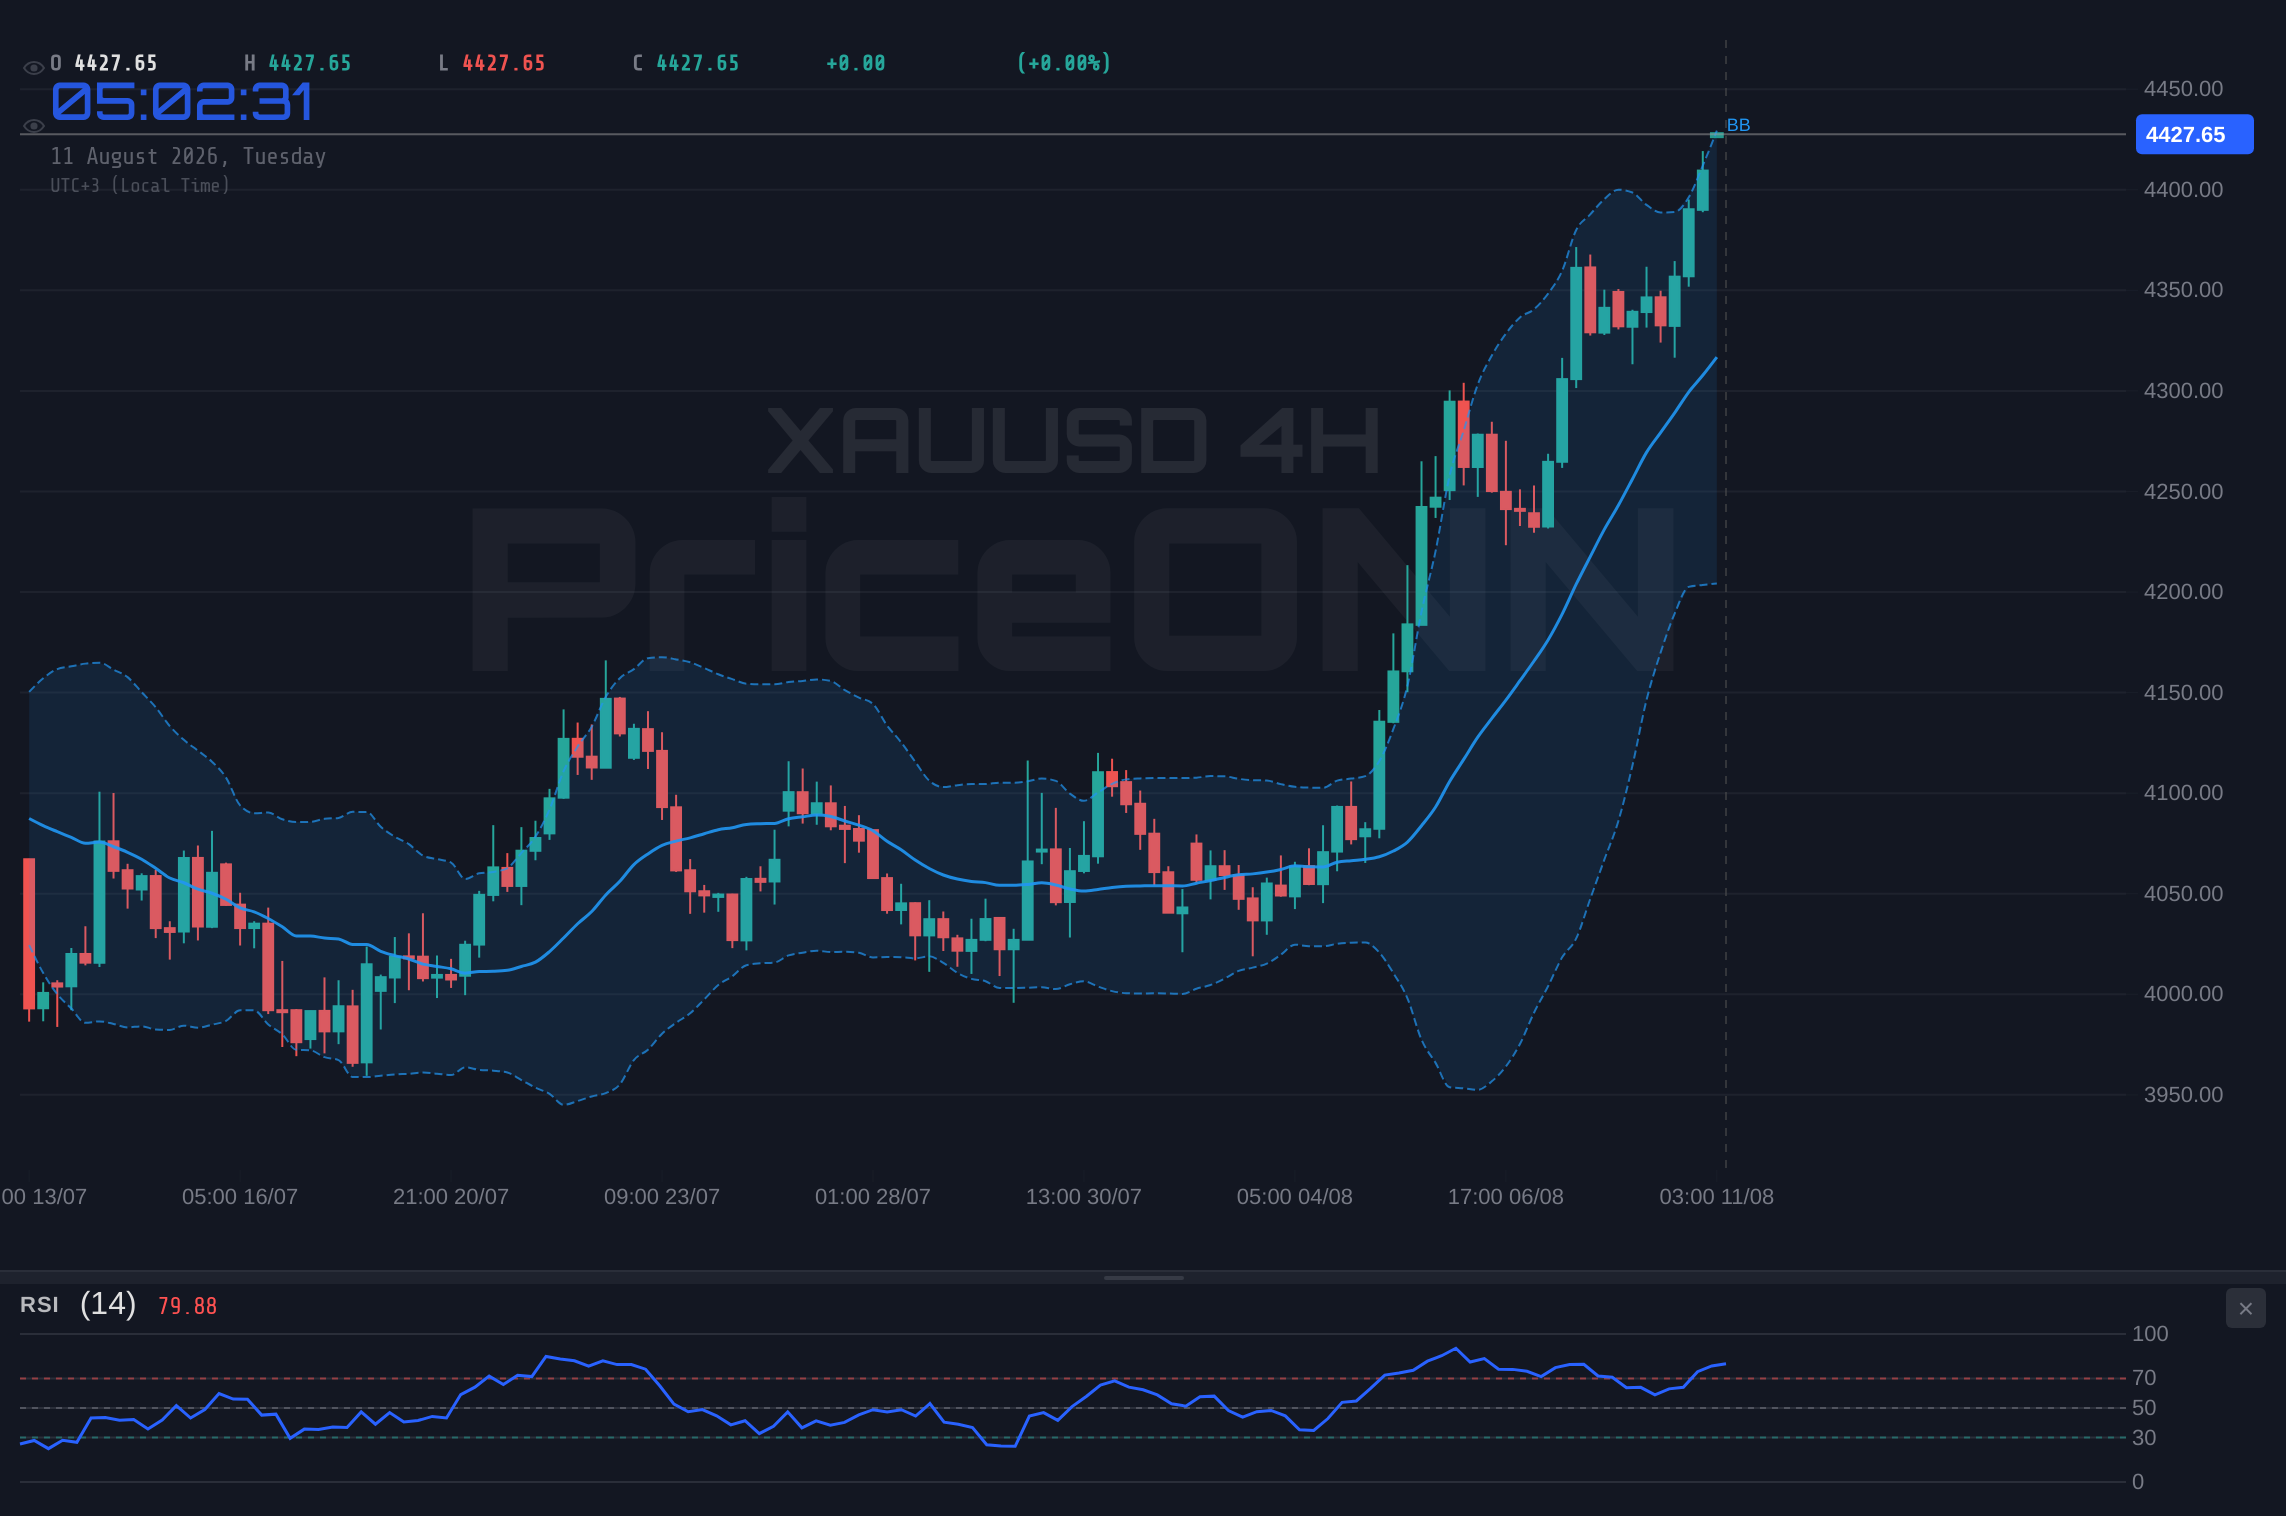
Technical Indicators Point to Overbought Conditions
Looking at the technical indicators, the picture becomes more nuanced, hinting at potential headwinds for the current rally. On the 1-hour chart, the RSI(14) is soaring at 79.06, deep into overbought territory. This suggests that the buying pressure has been intense and that a period of consolidation or a pullback is highly probable. Similarly, the Stochastic oscillator is also showing extreme readings, with %K at 93.95 and %D at 94.3, both well above the 80 threshold. This confluence of overbought signals on shorter timeframes indicates that the market might be due for a breather.
However, the longer-term trend indicators offer a different perspective. The ADX, a measure of trend strength, remains robust across multiple timeframes. On the 1-hour chart, it stands at 34.56, on the 4-hour chart at 48.58, and on the daily chart at 28.14 – all indicating a strong prevailing trend. This suggests that while short-term exhaustion might be setting in, the underlying momentum powering gold's rise is still very much intact. The MACD also continues to show positive momentum, with the MACD line remaining above its signal line on all observed timeframes. This divergence between short-term overbought signals and long-term trend strength is where the real trading challenge lies.
The Dollar's Dilemma and Gold's Correlation
DXY Stabilization: A Potential Brake on Gold?
The Dollar Index (DXY) has been a critical factor influencing gold's trajectory. Currently trading at 99.79, the DXY has experienced a notable dip recently, which has directly benefited gold. However, the 4-hour chart for DXY shows an RSI of 48.23 and a strong uptrend signal from the ADX at 25.97, while the daily chart's ADX also indicates a strong downtrend at 28.34. This mixed signal suggests that the dollar's weakness might be finding some footing, or at least entering a consolidation phase. If the DXY stabilizes or begins to rebound, it could exert downward pressure on XAUUSD, especially if this correlates with a shift in risk sentiment.
The interplay between the dollar and gold is complex and often influenced by global economic conditions and central bank policies. For instance, the recent news highlighting potential US intervention in USD/JPY, coupled with a decline in US employment figures, has certainly weighed on the dollar. This has created a favorable environment for gold. However, the market is forward-looking. If upcoming economic data, such as the Consumer Price Index (CPI), indicates persistent inflation or a less dovish Fed stance than anticipated, the dollar could regain strength, posing a challenge to gold's current rally. Traders are closely watching the DXY's ability to hold above key support levels as a barometer for potential shifts in gold's fortunes.
Correlation Analysis: Equities and Oil as Barometers
Beyond the dollar, other market correlates provide further context for gold's price action. The S&P 500 (SP500) is currently trading at 6572.87, showing a significant daily gain of 0.74%. On the 1-hour chart, the SP500 exhibits a strong uptrend (ADX 49.72) but an RSI of 70.95, indicating it's nearing overbought territory. The Nasdaq 100 (Nasdaq) is also showing strength, trading at 29708.25. Generally, a rising equity market suggests increased risk appetite, which can sometimes dampen demand for safe-haven assets like gold. However, gold's recent surge has occurred alongside rising equities, suggesting that factors other than pure risk-off sentiment are at play, possibly inflation hedging or a flight to quality within risk assets themselves.
Oil prices, specifically Brent crude at 86.59 and WTI at 83.41, have seen a dramatic surge of 6.6% and 6.66% respectively. This sharp increase in energy prices has significant implications for inflation expectations. Higher oil prices can directly contribute to rising inflation, which historically benefits gold as an inflation hedge. The strong bullish signals across all timeframes for both Brent and WTI, with ADX values in the high 30s and 40s, indicate a powerful trend. This surge in oil prices could be a significant fundamental driver supporting gold's continued strength, even if shorter-term technical indicators suggest caution.
The Road Ahead: Key Levels and Potential Scenarios
Navigating the Resistance: What to Watch for at $4,420.38 and Beyond
The immediate focus for gold traders is the resistance level at $4,420.38. A decisive break and hold above this level on the 1-hour chart would be a strong signal for further upside, potentially targeting the next resistance at $4,431.22. The daily chart resistance is set at $4,456.14, a level that, if breached, could signal a more significant bullish continuation. However, the path to these levels is fraught with short-term technical warnings. The overbought RSI and Stochastic readings on the hourly charts suggest that sellers could step in around the current price action, leading to a retracement. Support levels on the 1-hour chart are located at $4,397.57 and $4,385.6, which could act as immediate floors if a pullback materializes.
The daily chart presents a broader picture, with support found at $4,256.68 and resistance at $4,456.14. The fact that the daily RSI is still within the neutral zone at 69.49, despite the hourly and 4-hourly charts showing overbought conditions, indicates that there might still be room for upward momentum on a longer timeframe, provided the current resistance can be overcome. The ADX on the daily chart at 28.14 confirms a strengthening trend, adding to the bullish case if the immediate overhead resistance is cleared. The key will be how price action behaves around the $4,420.38 to $4,431.22 zone; a failure to break through could lead to a significant correction.
Scenario Analysis: Bullish, Bearish, and Neutral Outlooks
Given the conflicting signals – strong long-term uptrend versus short-term overbought conditions – multiple scenarios are plausible for XAUUSD. The bullish outlook hinges on a decisive breakout above the immediate resistance levels. If gold can convincingly clear $4,420.38 and then $4,431.22, it would likely trigger further buying, targeting the $4,456.14 resistance on the daily chart. The trigger for this scenario would be a sustained close above $4,431.22, with invalidation occurring if price falls back below $4,397.57. Targets would then extend towards $4,456.14 and potentially higher if momentum continues.
Conversely, the bearish scenario anticipates a rejection at the current resistance levels. If XAUUSD fails to break higher and starts to pull back, the immediate support at $4,397.57 becomes crucial. A break below this level could accelerate selling, targeting $4,385.6 and potentially lower, towards the $4,374.76 support. The trigger for this scenario would be a close below $4,397.57 on the 1-hour chart, with invalidation if price rallies back above $4,420.38. Targets would then be set at $4,385.6 and subsequently $4,374.76.
A neutral or consolidation scenario is also possible, especially if upcoming economic data provides mixed signals or if traders adopt a wait-and-see approach. In this case, XAUUSD might trade within a range defined by the current resistance around $4,420-$4,431 and support near $4,397-$4,385. This consolidation could allow technical indicators to reset, potentially building energy for the next significant move. The trigger for this scenario would be a lack of decisive movement beyond the immediate resistance or support levels within the next 24-48 hours, with invalidation occurring on a clear break of either boundary. This range-bound trading could persist until a clearer fundamental catalyst emerges.
Fundamental Undercurrents: Inflation, Fed, and Geopolitics
The Inflationary Shadow: Oil Prices and CPI Expectations
The recent dramatic surge in oil prices – Brent up 6.6% to $86.59 and WTI up 6.66% to $83.41 – cannot be ignored. This sharp rise in energy costs is a potent inflationary force, directly impacting consumer prices and producer costs. While recent economic reports may have shown some cooling in inflation, the renewed upward pressure from oil could complicate the narrative for central banks, particularly the Federal Reserve. The market's reaction to these higher energy prices will be closely monitored in upcoming inflation reports, such as the CPI. If CPI data comes in hotter than expected, it could prompt a reassessment of Fed policy, potentially strengthening the dollar and challenging gold's advance.
The market's current pricing of Fed policy is a delicate balance. While many anticipate a pause in rate hikes, persistent inflation fueled by energy prices could force the Fed to maintain a hawkish stance for longer than expected. This would increase the opportunity cost of holding gold, acting as a headwind. Conversely, if inflation shows signs of moderation despite oil prices, or if the Fed signals a more accommodative stance, gold could find further support. The interplay between energy markets, inflation data, and central bank communication will be a critical determinant of gold's medium-term direction.
Geopolitical Tensions and Safe-Haven Demand
Geopolitical risks remain a persistent background factor that often fuels demand for gold as a safe-haven asset. While specific major geopolitical events haven't dominated headlines in the last 48 hours related directly to gold, the broader global landscape remains tense. The ongoing situation in Eastern Europe, coupled with potential flashpoints in the Middle East, continues to create an undercurrent of uncertainty. Any escalation or new development in these regions could trigger a flight to safety, benefiting gold. The news about US energy helping to cushion global supply shocks from the Strait of Hormuz, while stabilizing, still highlights the fragility of global energy supply chains – a factor that can indirectly support gold.
Furthermore, the news regarding potential US oil export restrictions, as reported by outlets like the Financial Times, adds another layer of complexity to the energy market and, by extension, inflation expectations. Such actions could tighten global oil supply, potentially pushing prices higher and reinforcing gold's appeal as an inflation hedge. While these geopolitical factors might not be the primary drivers of gold's current price action, they provide a supportive backdrop, acting as a potential catalyst for sharp upward moves should tensions escalate.
Trader's Edge: Actionable Insights and Risk Management
The Critical Juncture: What Price Action Matters Now?
For active traders, the current price action around $4,429.70 presents a critical juncture. The short-term overbought indicators suggest caution, making a direct long position risky without further confirmation or a pullback. A more prudent approach might involve waiting for a clear break above the $4,431.22 resistance, accompanied by strong volume and a daily RSI that has room to move higher, or waiting for a healthy pullback towards the $4,397.57 support level for a potential re-entry on signs of bullish reversal. The ADX readings across timeframes do suggest a strong trend, so chasing the breakout above $4,431.22 could be rewarded if the momentum sustains.
The correlation with the DXY is also vital. If the DXY shows signs of recovery, it could signal a short-term reversal in gold. Conversely, if the DXY continues to weaken, it would lend credence to further upside for XAUUSD. Traders should monitor the DXY's movement around 99.79 closely. The surge in oil prices is a significant fundamental factor that cannot be ignored; if this trend continues, it could override short-term technical exhaustion signals in gold. The ultimate decision will likely hinge on the next wave of economic data, particularly inflation figures, and the Fed's reaction to them.
Managing Risk in Volatile Markets
In any market, but especially in gold trading with its inherent volatility, risk management is paramount. Given the conflicting signals – overbought on shorter timeframes but strong underlying trends and bullish fundamentals – a disciplined approach is essential. Avoid over-leveraging positions, especially if entering trades near resistance levels. Ensure that stop-loss orders are placed appropriately below key support levels to protect capital in case the market moves against your position. For instance, if anticipating a breakout, a stop below $4,397.57 would be prudent. If expecting a pullback, a stop below $4,374.76 might be considered.
Patience will be rewarded. The market is presenting clear signals but also clear warnings. Rushing into a position without waiting for confirmation or clear price action at key levels can lead to unnecessary losses. The strong trend indicated by the ADX across multiple timeframes suggests that once a direction is established, it could be powerful. The key is to identify that direction with a higher probability and manage the associated risks accordingly. The current levels around $4,429.70 offer a prime example of where caution and strategic patience are most valuable.
Frequently Asked Questions: XAUUSD Analysis
What happens if XAUUSD breaks above the $4,431.22 resistance level?
A sustained break above $4,431.22, especially with strong volume, would likely trigger further bullish momentum, targeting the next resistance at $4,456.14. This would signal that the short-term overbought conditions are being overcome by a stronger underlying trend, potentially fueled by continued dollar weakness or inflation concerns.
Should I buy XAUUSD at current levels around $4,429.70 given the RSI at 79?
Buying directly at $4,429.70 with an RSI of 79.06 carries significant short-term risk due to overbought conditions. A more prudent approach would be to wait for a pullback to support around $4,397.57 for potential re-entry, or for a confirmed breakout above $4,431.22, which would suggest the overbought signal is being overridden by trend strength.
Is the strong ADX reading at 48.58 on the 4H chart a buy signal for XAUUSD?
An ADX of 48.58 indicates a very strong trend, which is bullish given gold's upward movement. However, it signals trend *strength*, not necessarily direction or an optimal entry point. Combined with overbought RSI, it suggests that while the trend is strong, the market might be extended and due for a pause before continuing higher.
How will the upcoming CPI data affect XAUUSD this week, given the surge in oil prices?
A hotter-than-expected CPI reading, exacerbated by rising oil prices, could prompt the Fed to maintain a hawkish stance, potentially strengthening the USD and pressuring XAUUSD. Conversely, cooler inflation data might reinforce Fed pause expectations, supporting gold. Traders should watch for price action reacting to the CPI release, with resistance at $4,431.22 and support at $4,397.57 being key levels to monitor.
Track markets in real-time
AI-powered analysis, technical indicators and real-time price data.
Join Our Telegram Channel
Breaking market news, AI analysis and trading signals instantly.
Join Channel