

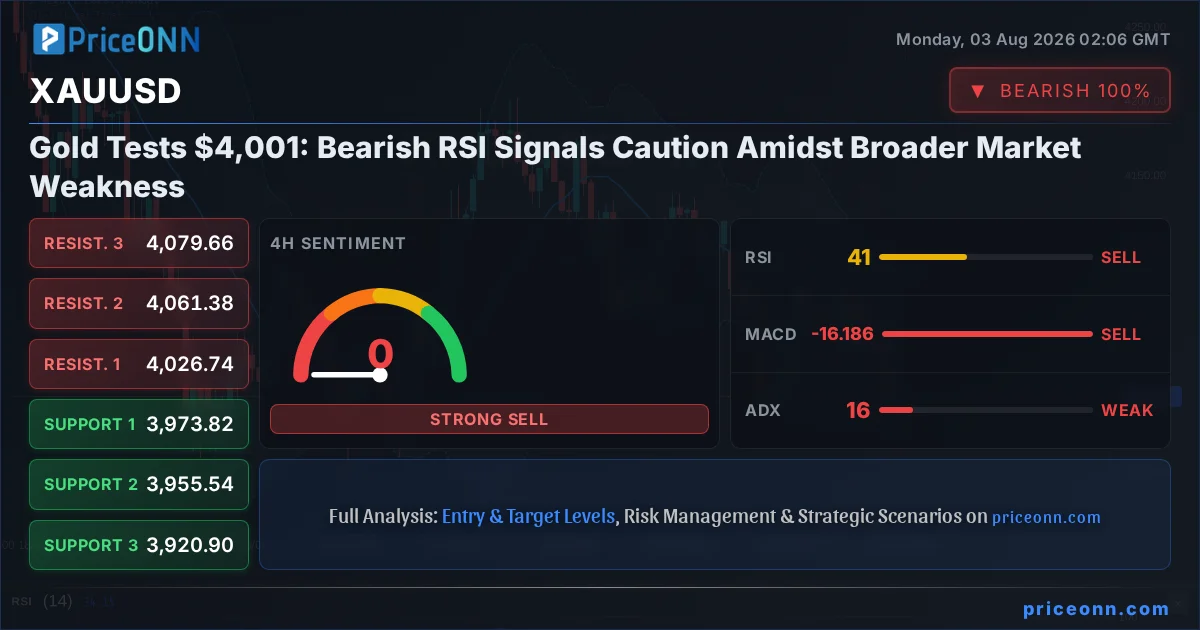
The age-old question for gold traders: when does a pullback morph into a trend? As XAUUSD currently tests the critical $4,001.21 level, the charts are flashing a complex message. While some indicators hint at a potential bounce, a closer look reveals underlying bearish momentum, amplified by a strengthening US Dollar and a cautious risk environment. This isn't a simple 'buy the dip' scenario; it's a market demanding careful analysis and strategic patience. Understanding the interplay between gold, the DXY, equities, and geopolitical undercurrents is paramount for navigating the choppy waters ahead.
- RSI at 37.81 on the 1H chart signals waning bullish pressure, bordering on oversold territory but indicating a downward trend.
- The critical support level for XAUUSD is holding around $3,991.8, with a break below potentially targeting $3,976.78.
- DXY strength, currently at 100.70, is exerting downward pressure on gold, reflecting a risk-off sentiment in broader markets.
- While daily MACD shows positive momentum, 1H and 4H MACD are negative, creating conflicting signals that warrant caution.
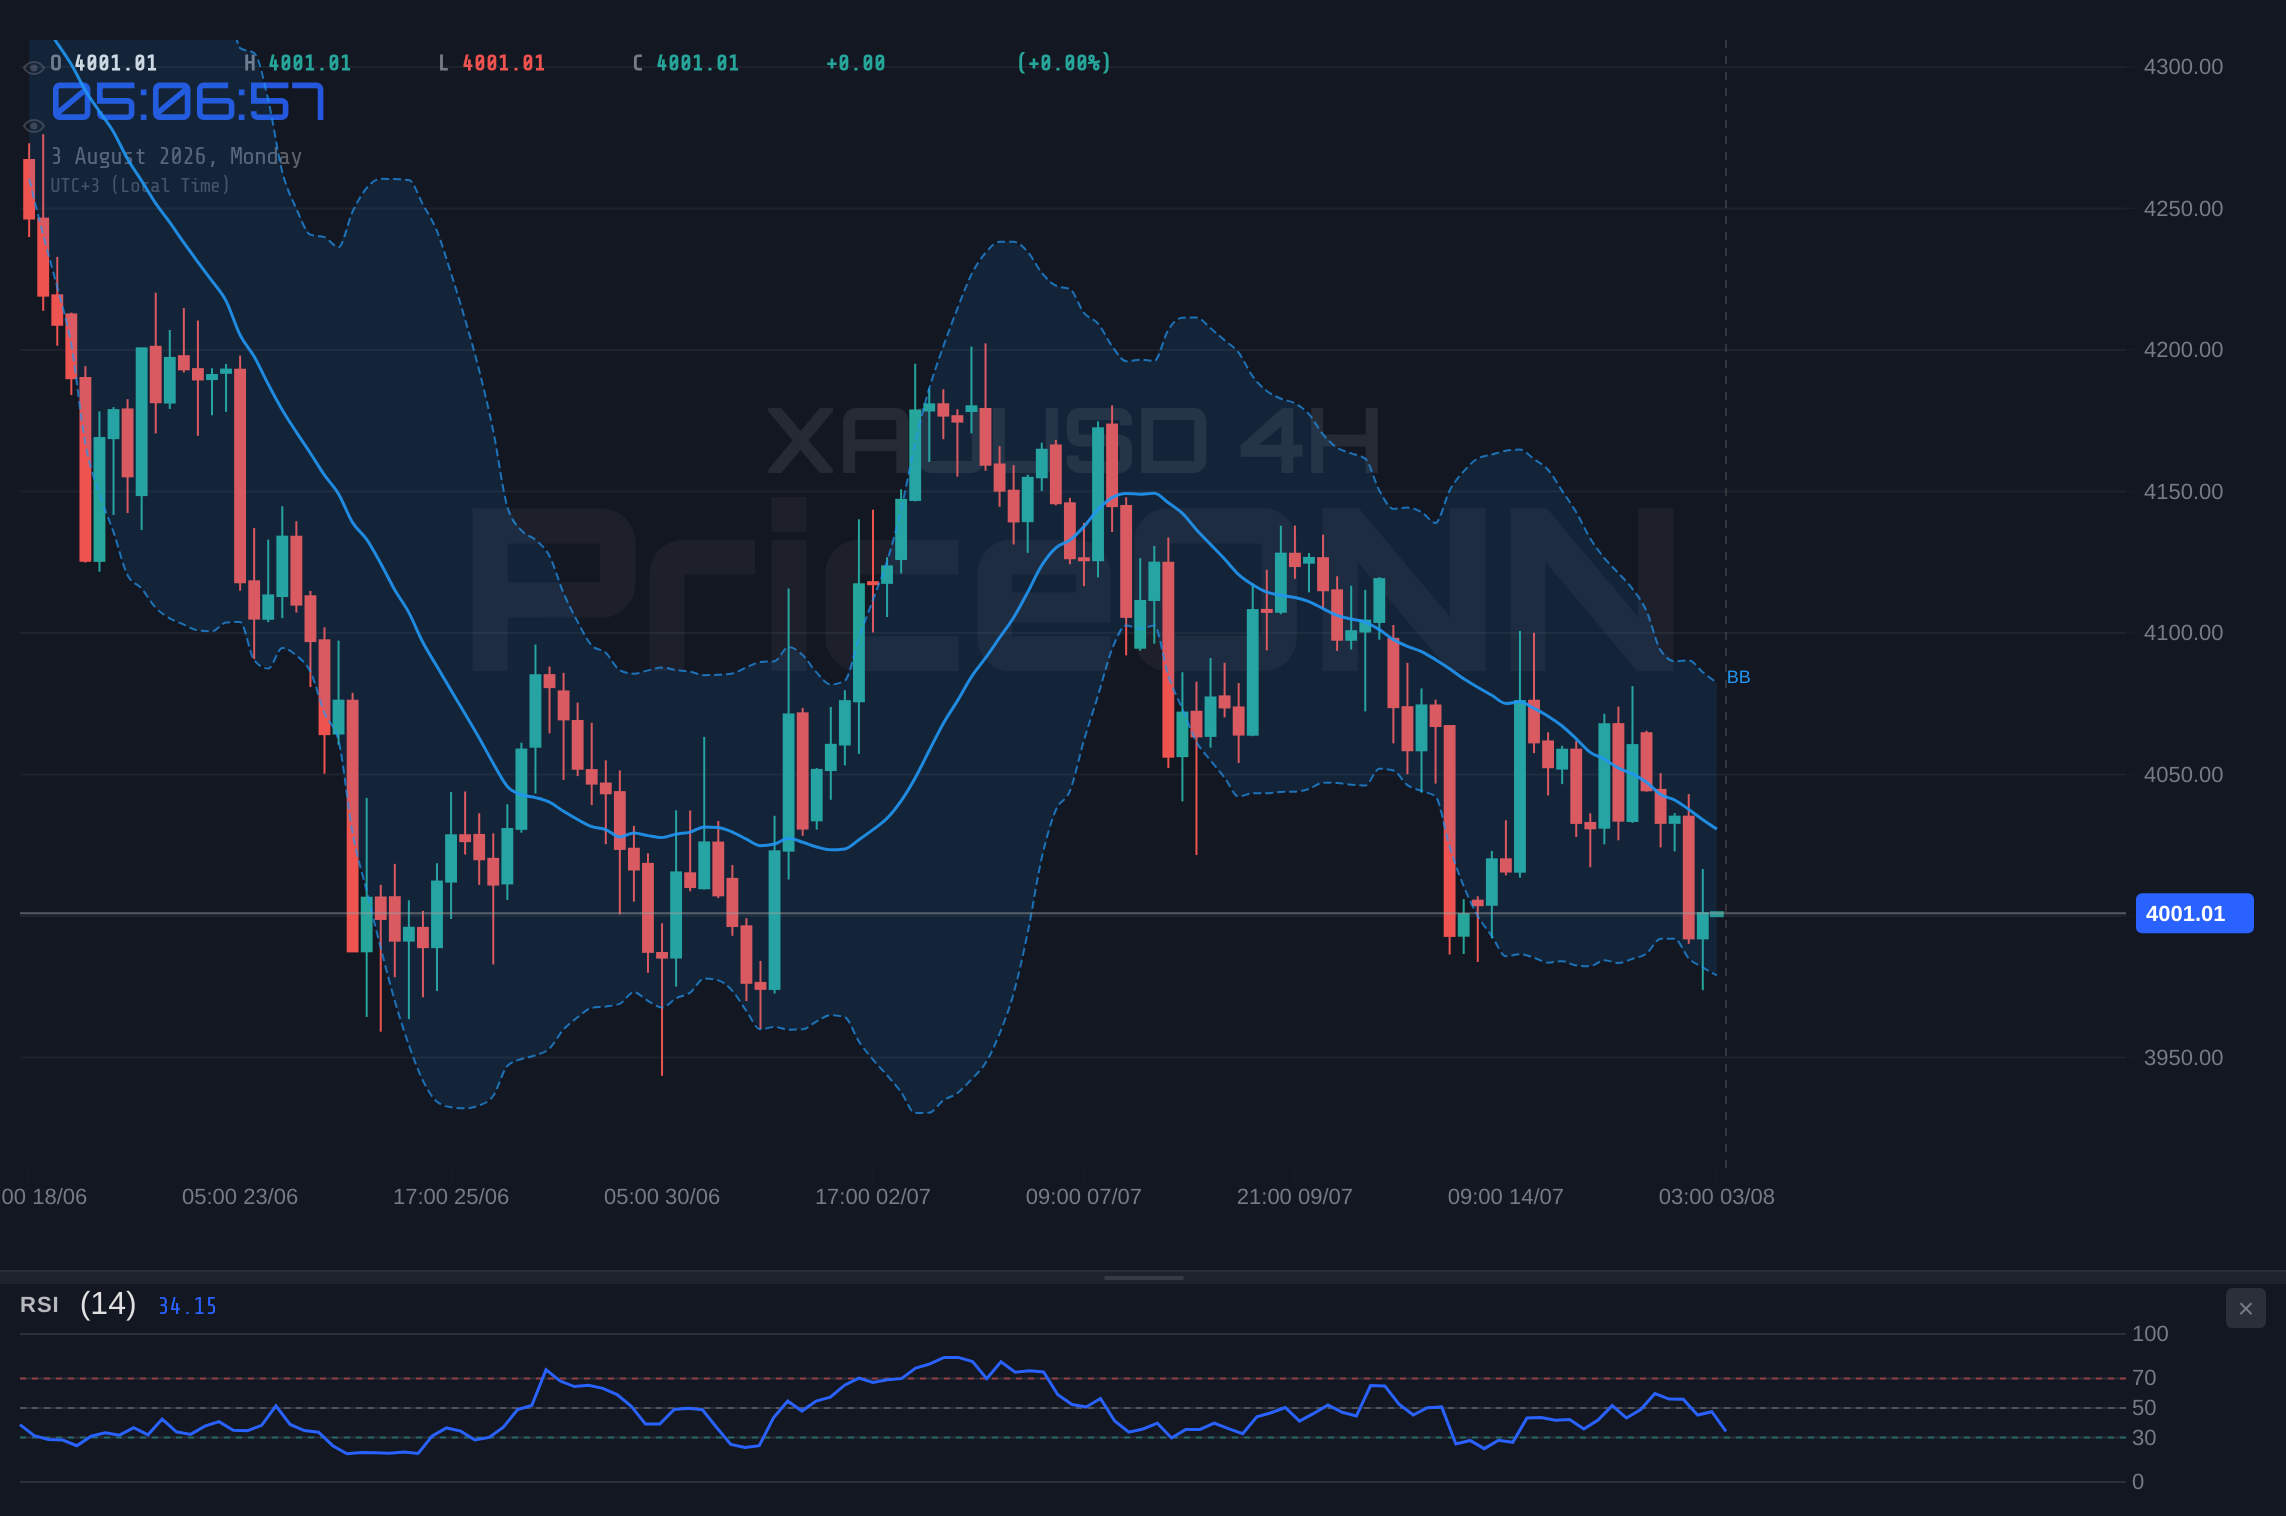
The current price action around $4,001.21 for XAUUSD presents a fascinating dichotomy. On one hand, the daily chart's MACD indicator shows positive momentum, suggesting that underlying buying interest might still be present. However, this is sharply contrasted by the hourly and 4-hour charts, where MACD exhibits negative momentum, and more importantly, the Relative Strength Index (RSI) is painting a decidedly bearish picture. On the 1-hour timeframe, the RSI sits at 37.81, well within neutral territory but leaning towards oversold conditions without showing strong reversal signs. The 4-hour RSI is at 40.59, and the daily RSI is at 38.86, all indicating a prevailing downward bias. This divergence across timeframes isn't just noise; it's a signal that while the daily trend might have underlying support, the immediate pressure is bearish, and any rallies could be met with selling.
The broader correlation with the US Dollar Index (DXY) is a critical piece of this puzzle. With the DXY currently trading at 100.70 and showing signs of strength, particularly on the 1-hour chart where it’s flirting with upper Bollinger bands and showing a bullish Stochastic crossover, the pressure on gold intensifies. Typically, a stronger dollar makes dollar-denominated assets like gold more expensive for holders of other currencies, thus dampening demand. The DXY's upward move, even if not in a strong trend according to its ADX of 27.71 on the 1H, is a clear headwind for gold. This dynamic is further underscored by the performance of major equity indices. The S&P 500, currently showing a bullish 1-hour trend (ADX 49.72) but a bearish daily trend (ADX 47.51), is exhibiting internal conflict, while the Nasdaq 100, with a strong bearish 1-hour trend (ADX 33.23), clearly signals a risk-off sentiment. This aversion to risk typically benefits safe-haven assets, but the simultaneous strength in the dollar complicates the narrative for gold.
The Bear's Roadmap: Navigating Downside Risks
For the bears, the path lower is becoming clearer, contingent on breaking key support levels. The immediate floor is observed around the $3,991.8 mark on the 1-hour chart. A decisive close below this level, especially with confirmation from rising volume and negative momentum across multiple timeframes, could trigger a swift move towards the next support at $3,976.78. The 4-hour chart reinforces this, with its own support structure beginning at $3,973.82. If these levels give way, the bears could target the $3,964.39 area on the 1-hour chart, and potentially extend towards the $3,955.54 level on the 4-hour chart. The ADX indicator, while showing moderate strength (20.26 on 1H, 15.79 on 4H), suggests that a breakdown could gain traction if key psychological levels are breached. The Stochastic indicator on the 1-hour chart, currently showing a bullish crossover (K=40.52, D=37.27), might offer a temporary reprieve or a small bounce, but the prevailing RSI and MACD on lower timeframes suggest this is unlikely to sustain momentum against the broader bearish pressure.
The daily chart, despite its positive MACD momentum, also presents vulnerabilities. The support level at $4,024.67 is crucial; a failure to hold this could see prices rapidly descend towards $3,988.95. The fact that the daily RSI is still below 40, coupled with the Stochastic indicator's bearish signal (%K=26.18, %D=44.73), indicates that even the longer-term trend has room to fall. The ADX at 39.16 on the daily timeframe suggests a strong trend is in play, and if it turns bearish, the downside could be significant. This is where traders look for confluence: a break of intraday support, coupled with a daily close below a critical level, would strongly favor a bearish outlook. The absence of strong bullish divergence on any timeframe, despite the price hovering around significant support, is a key concern for buyers. The recent tumble from the $4,065.47 high on the 1H chart, a clear resistance, underscores the sellers' intent.
The Bull's Gambit: Conditions for a Reversal
For the bulls to regain control, several conditions must be met. Firstly, XAUUSD needs to decisively break and hold above the immediate resistance on the 1-hour chart at $4,019.21. This level has already acted as a ceiling, and a sustained push above it, ideally with increasing volume and positive MACD divergence, would signal a shift in sentiment. Following this, the next significant hurdle lies at $4,031.6. A break above this point would start to invalidate the bearish short-term outlook. The 4-hour chart presents resistance at $4,026.74, and a move above this would be a more substantial confirmation of renewed buying interest. The daily resistance at $4,088.69 remains a longer-term target, but reaching it would require overcoming multiple layers of selling pressure.
Technical indicators offer a glimmer of hope, albeit fragile. The Stochastic oscillator on the 1-hour chart is exhibiting a bullish crossover, which could precede a short-term upward move. However, this signal needs to be corroborated by other indicators. The MACD on the daily chart remains positive, suggesting that the longer-term trend might still be trying to assert itself. For a true bullish reversal, we would need to see the RSI move decisively above 50 across multiple timeframes, ideally showing bullish divergence before reaching oversold territory. The current ADX readings, while indicating trend strength, are not necessarily bearish; a strong trend can reverse. If gold can hold its ground above the $3,991.8 support and build momentum upwards, breaking through the $4,019.21 resistance, it could signal the start of a recovery. However, the confluence of bearish signals on lower timeframes and the strong DXY action makes this scenario less probable in the immediate short term without a significant catalyst.
The Waiting Game: Consolidation and Uncertainty
The current technical setup, characterized by conflicting signals across different timeframes and a strong DXY presence, points towards a potential period of consolidation or range-bound trading. If neither the bulls nor the bears can establish firm control, XAUUSD might oscillate between the established support and resistance levels. On the 1-hour chart, this range is roughly defined by $3,991.8 (support) and $4,019.21 (resistance). On the 4-hour chart, the range widens slightly, with support near $3,973.82 and resistance around $4,026.74. This choppy environment, often signaled by a low ADX (currently 20.26 on 1H and 15.79 on 4H), can trap traders who try to force a trend where none exists.
In such a scenario, scalpers might find opportunities on the edges of the range, but swing traders would likely wait for a clear breakout. The lack of strong directional conviction from indicators like RSI and MACD, which are either mixed or showing weak momentum on some timeframes, supports the consolidation thesis. The market could be waiting for a significant fundamental catalyst – perhaps a crucial economic data release, a geopolitical escalation, or a shift in central bank rhetoric – to break this stalemate. Until then, expect price action to be characterized by short-term fluctuations within these defined boundaries, with volume potentially thinning out as traders adopt a wait-and-see approach. The 1D Stochastic showing a bullish signal (%K=26.18, %D=44.73) could hint at a larger upward move eventually, but the immediate path is clouded by the bearish short-term indicators and DXY strength.
The Most Likely Scenario: Bearish Bias with Caveats
Considering the current technical landscape, the most probable scenario in the short to medium term is a continued bearish bias, albeit potentially within a consolidative range before a more decisive move. The confluence of bearish RSI readings across all analyzed timeframes (1H, 4H, 1D), coupled with negative MACD momentum on the 1H and 4H charts, presents a strong case for further downside. The strengthening DXY further bolsters this view, acting as a consistent headwind. I would assign a probability of around 60% to a scenario where XAUUSD struggles to maintain levels above $4,000 and potentially tests lower supports in the coming days. This doesn't necessarily mean a sharp crash, but rather a grinding lower or sideways movement with a downward tilt.
The probability of a bullish reversal in the immediate short term (next 24-48 hours) is lower, perhaps around 25%. This would require a significant shift in market sentiment, a dovish surprise from the Fed, or a geopolitical event that directly boosts safe-haven demand for gold while simultaneously weakening the dollar. Such a scenario would likely see price breaking decisively above $4,019.21 and then challenging $4,031.6. The remaining 15% probability lies with a neutral, range-bound scenario, where price action remains confined between the immediate support and resistance levels, perhaps between $3,991.8 and $4,019.21, awaiting a clear catalyst. The strength of the daily trend (ADX 39.16) suggests that once a direction is established, it could be powerful, making the current indecision a potentially temporary phase.
The recent news flow also adds a layer of complexity. Reports of diminishing signs of a near-term US-Iran truce, as mentioned by RTTNews, could theoretically increase safe-haven demand for gold. However, the simultaneous surge in crude oil prices (likely due to Middle East tensions) and the dollar's resilience seem to be overriding this factor for now. This highlights how interconnected the markets are and how multiple fundamental forces can pull in different directions. For gold to truly benefit from geopolitical uncertainty, the dollar typically needs to weaken, which is not happening currently. The Suriname oil boom and China's clean energy push, while significant in their respective markets, have a more indirect impact on gold's immediate price action, primarily through their influence on inflation expectations and global growth sentiment.
What I'm Watching This Week
My attention is firmly fixed on a few key triggers that could dictate the direction of XAUUSD in the coming week. Firstly, the $3,991.8 support level on the 1-hour chart is absolutely critical. A clean break and sustained move below this level, especially on increased volume, would likely confirm the bearish scenario I've outlined, opening the door for further downside towards $3,976.78. Secondly, I'll be watching the DXY's reaction to upcoming economic data. If the dollar continues to strengthen, it will add significant pressure on gold. Conversely, any sign of dollar weakness, perhaps due to dovish Fed speak or weak US economic data, could provide a much-needed tailwind for gold. Finally, the price action around the $4,019.21 resistance level on the 1H chart is crucial. A failure to break this level on any attempted rallies will reinforce the bearish outlook and suggest that the market is consolidating with a downward bias. Any significant break above $4,031.6 would be a strong bullish signal, but that seems less likely given the current technicals.
The Bull's Roadmap
Bullish Scenario: A Surprising Rally
25% ProbabilityBearish Scenario: Downside Pressure Mounts
60% ProbabilityNeutral Scenario: Range-Bound Grind
15% ProbabilityFrequently Asked Questions: XAUUSD Analysis
What happens if XAUUSD breaks below the $3,991.80 support level?
A break below $3,991.80 on the 1-hour chart would likely signal further downside, potentially targeting $3,976.78. This would be confirmed by negative MACD momentum and a sustained RSI below 40.
Should I buy gold at current levels around $4,001.21 given the mixed signals?
Buying at current levels is risky due to bearish RSI and DXY strength. A safer approach would be to wait for a confirmed break above $4,019.21 resistance or a clear test and hold of $3,991.80 support with bullish divergence.
Is the RSI at 37.81 a strong sell signal for XAUUSD?
An RSI of 37.81 on the 1-hour chart indicates waning bullish momentum and leans towards oversold conditions, but it's not an extreme sell signal on its own. It suggests caution and favors downside risk, especially when combined with negative MACD and DXY strength.
How will the upcoming US economic data releases affect XAUUSD this week?
Stronger-than-expected US data could boost the DXY and put further pressure on gold, potentially pushing it towards $3,976.78. Conversely, weaker data could weaken the dollar, offering a reprieve for gold and possibly a move towards $4,019.21 resistance.
Track markets in real-time
AI-powered analysis, technical indicators and real-time price data.
Join Our Telegram Channel
Breaking market news, AI analysis and trading signals instantly.
Join Channel