
XAGUSD Tests $65.37 Resistance as Bullish Momentum Builds
Silver ($65.04) eyes key resistance at $65.37. Strong ADX and RSI readings suggest potential for further upside, but caution is advised.
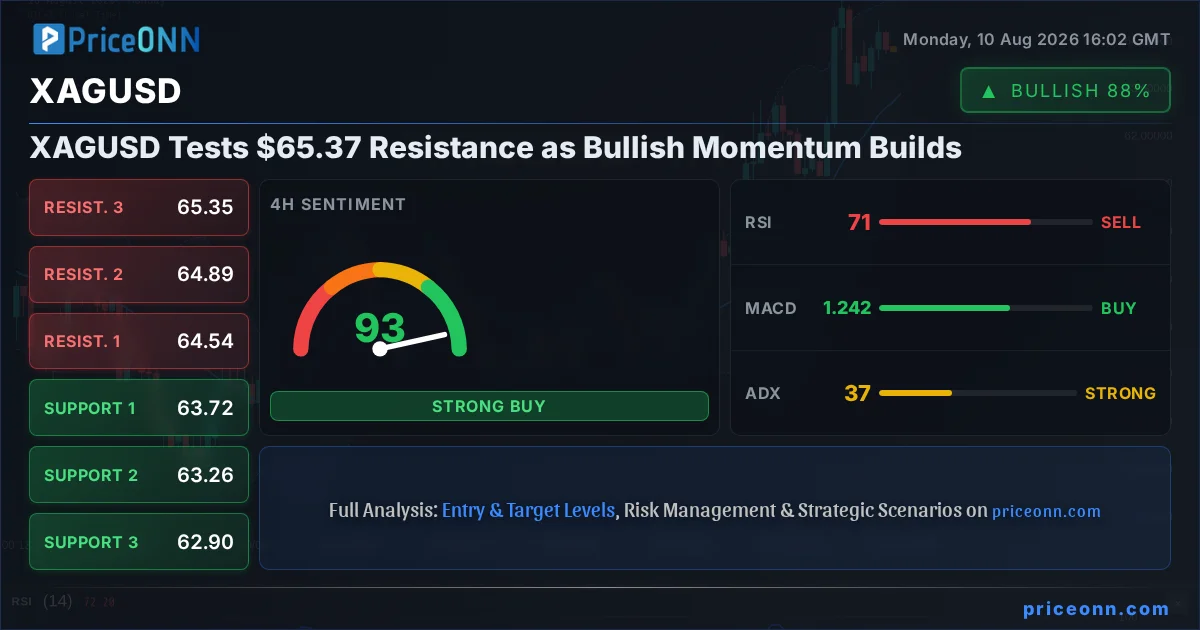
Having tracked XAGUSD through its recent ascent, it's clear that the metal is currently navigating a critical juncture. The current price of $65.04 isn't just another number; it represents a pivot point where months of consolidation might finally give way to a more sustained move. For traders watching silver, the action around the $65.37 resistance level is the immediate focus. This isn't just about a single price level; it's about the confluence of technical signals that have been building over the past few weeks, suggesting that the bulls might be regaining their footing. The question on everyone's mind is whether this current push is sustainable or just another false rally before a deeper correction. We've seen this pattern before, and understanding the nuances of the current market setup is paramount for making informed decisions.
- RSI at 68.5 signals strong bullish momentum, nearing overbought territory on the 1H chart.
- Critical resistance is identified at $65.37, with further levels at $65.62 and $66.38.
- The ADX reading of 29.84 on the 1H chart indicates a strengthening trend, supporting potential upside.
- Correlation analysis shows DXY at 99.71, currently exerting some pressure, but silver's upward trend appears resilient.
The daily chart for XAGUSD paints a picture of a market that has been consolidating for an extended period, but the recent uptick in price action is undeniable. With the price currently sitting at $65.04, we're seeing a clear attempt to break through established resistance. The 1-hour trend is officially neutral, but the strength of the trend on the 4-hour (94% strength) and daily (50% strength, but with positive indicators) charts suggests underlying bullish conviction. This dichotomy between short-term neutrality and longer-term bullish signals creates a dynamic environment where quick reactions can be profitable, but a longer-term perspective is essential for strategic positioning. The ADX on the 4-hour chart is particularly noteworthy, standing at 45.66, which signifies a strong, established uptrend. This isn't a market just testing the waters; it's a market potentially embarking on a significant move.
Digging into the indicators, the RSI(14) on the 4-hour chart is at 71.67, firmly in the overbought territory. While this often signals a potential pullback, the ADX's strength suggests that this uptrend has the power to push even further before exhaustion sets in. Historically, an RSI above 70 doesn't automatically mean sell; it often indicates strong momentum that can continue. The Stochastic indicator on the 4-hour chart, with K at 83.52 and D at 79.76, also points to bullish continuation, though it is nearing extreme overbought levels. The MACD is showing positive momentum, with the MACD line above the signal line, reinforcing the bullish sentiment. On the daily chart, the RSI is at 66.37, still in the neutral zone but trending higher, indicating room for further price appreciation. The MACD on the daily is also positive, supporting the idea of an ongoing uptrend, even if the trend strength (ADX 27.7) is less pronounced than on the 4-hour timeframe.
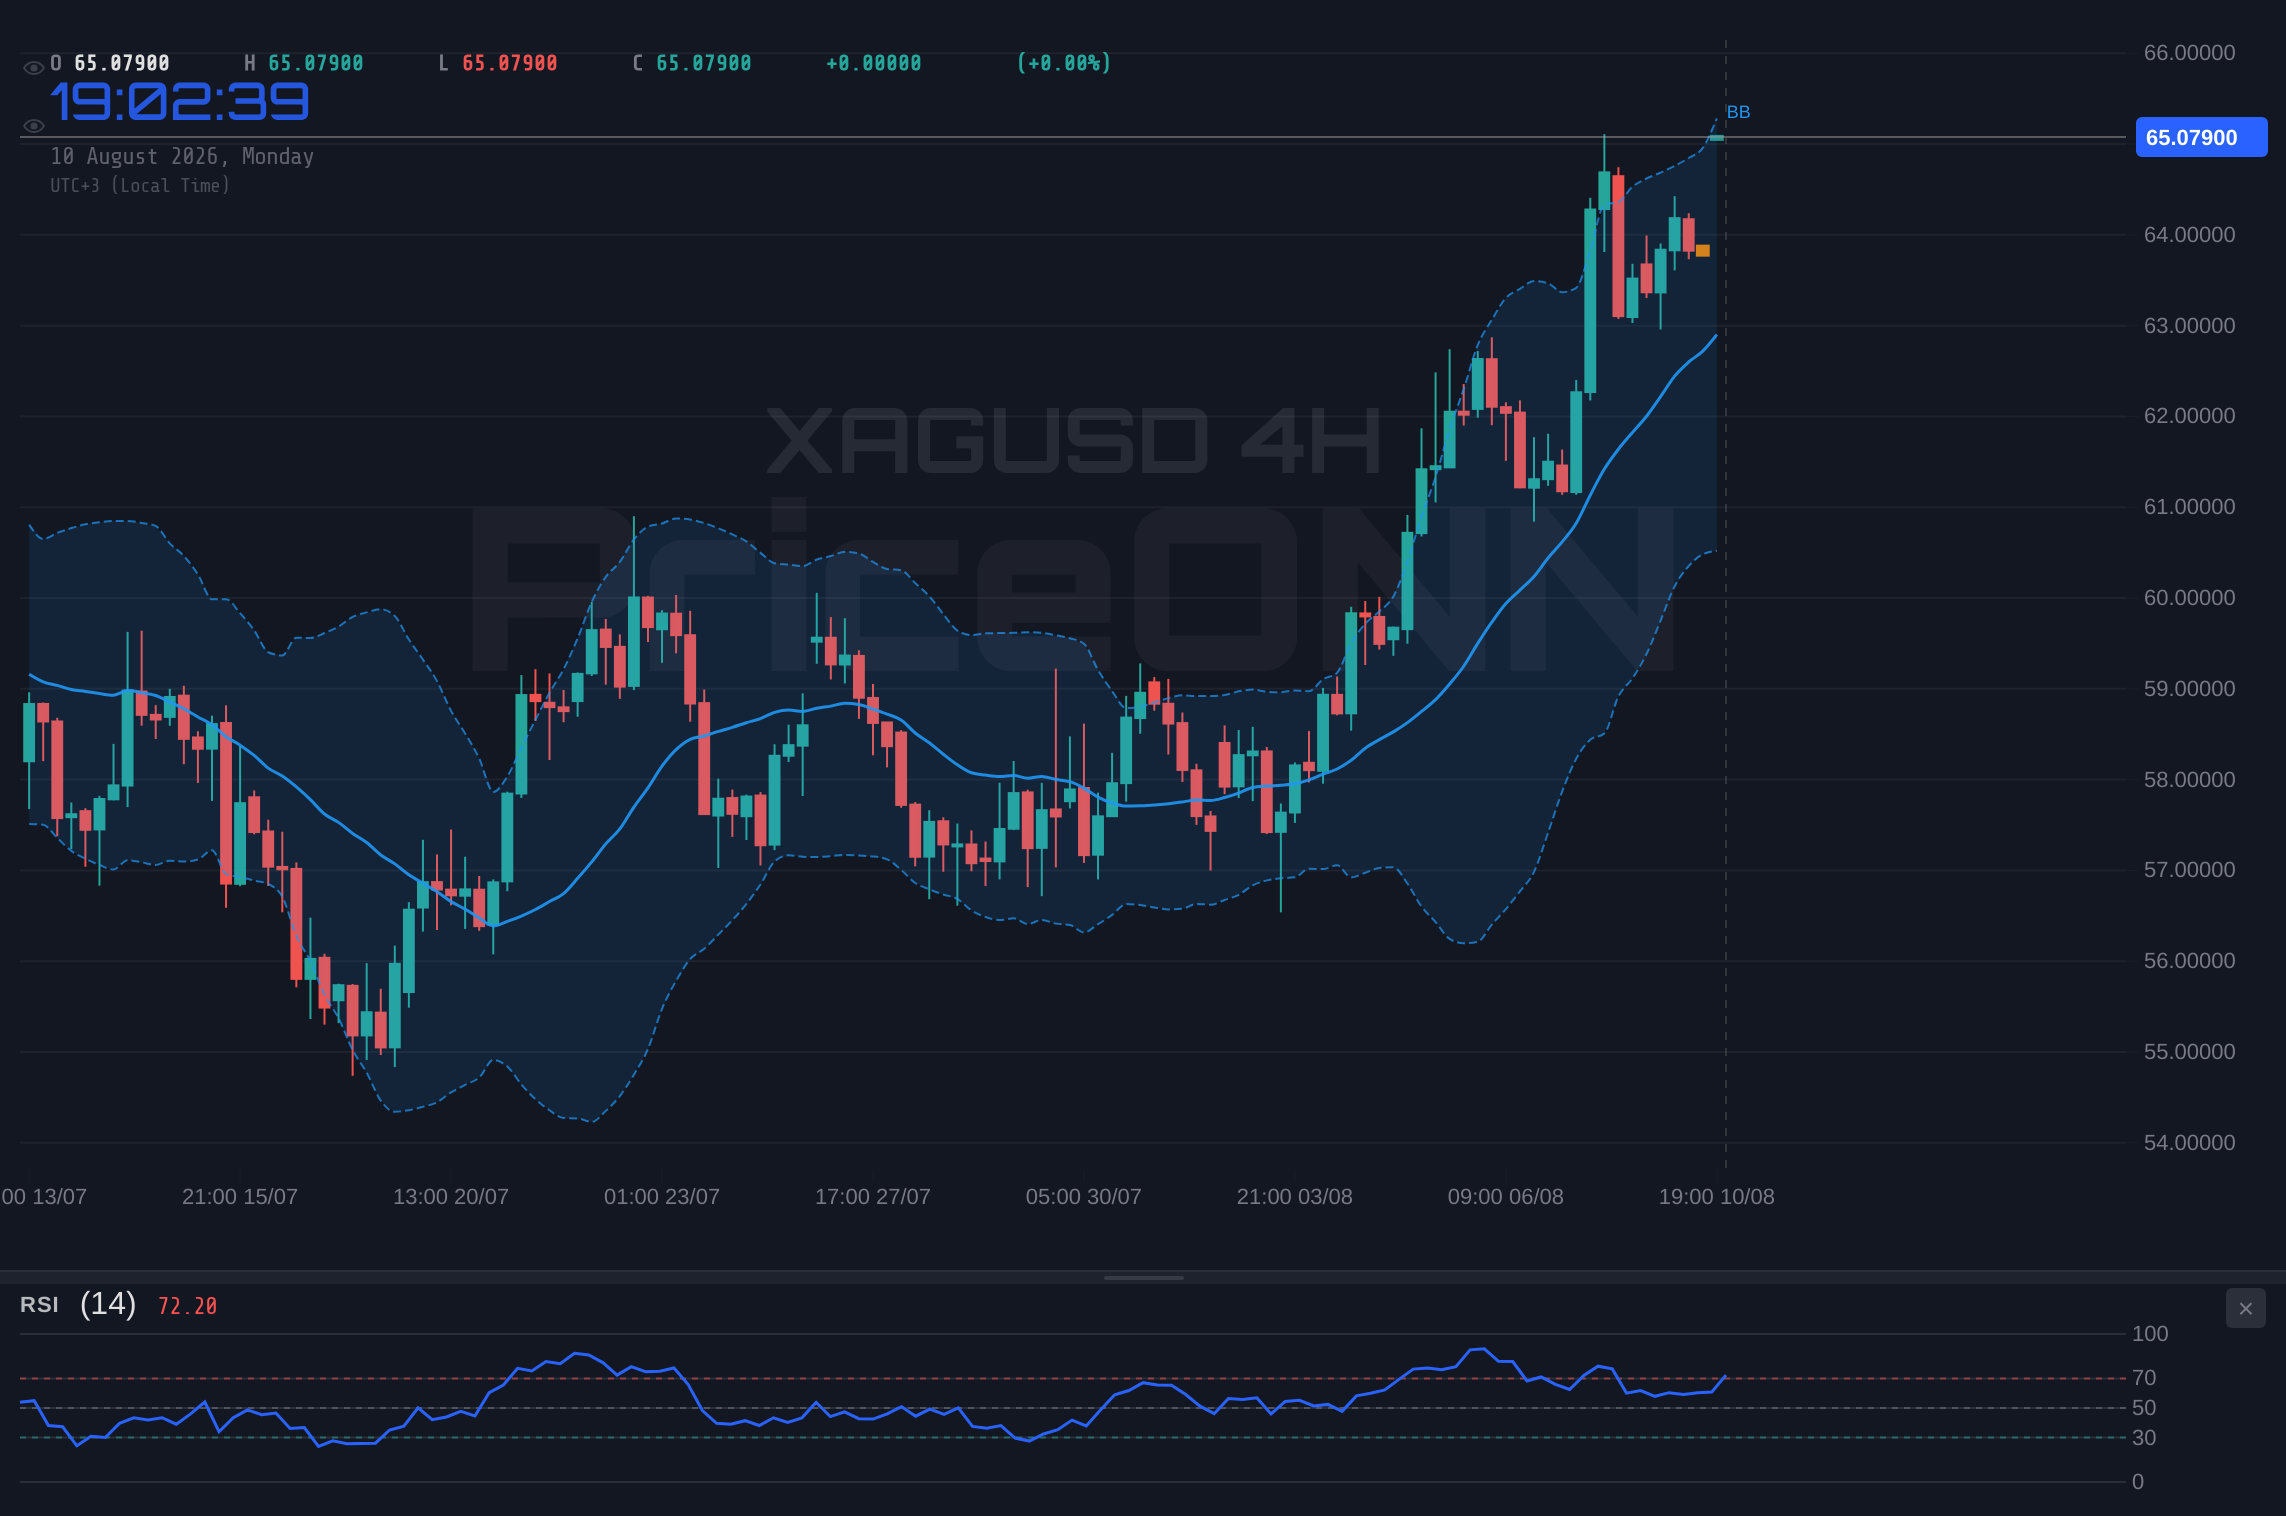
The immediate price action around $65.37 is crucial. This is the first significant resistance level identified in the live data. A decisive break and hold above this level would likely trigger further buying, targeting the next resistance at $65.62, and potentially the $66.38 level. The interplay between the short-term indicators and the longer-term trend is what makes this level so important. While the 1-hour chart shows a neutral trend, the overwhelming bullish signals on the 4-hour and the positive momentum on the daily suggest that the path of least resistance might be upwards. However, traders must remain vigilant. The DXY, currently at 99.71, is showing some strength, which typically acts as a headwind for precious metals like silver. A stronger dollar can make silver more expensive for holders of other currencies, potentially dampening demand. This correlation is a constant factor to monitor, and any significant move in the dollar index will need to be factored into the XAGUSD outlook.
Looking at the broader market context, recent news reports highlight the complex interplay of global factors. Reports of US employment data impacting the USD suggest that macroeconomic shifts can quickly influence currency pairs and, by extension, commodities. While specific news directly impacting silver might not be as prominent as for major currencies or indices, the general sentiment towards risk assets and inflation plays a significant role. The recent strength in US equities, with the S&P 500 at 6572.87 and Nasdaq at 29733.46, generally supports a risk-on environment, which can be positive for silver. However, the dollar's movement is a key counter-factor. If the dollar strengthens significantly due to, for instance, unexpected hawkishness from the Fed, it could put a lid on silver's gains despite positive equity market sentiment.
The 1-hour chart, while showing a neutral trend, is where the immediate battle is taking place. Support at $63.94 is key. A close below this level on the 1-hour chart could signal a short-term reversal, potentially leading to a test of the next support at $63.17. This would invalidate the immediate bullish setup and open the door for further downside. Conversely, a sustained move above $65.37, followed by a hold above it, would strengthen the bullish case considerably. The probability of such a move hinges on the strength of the underlying uptrend and the market's reaction to this key resistance zone. Traders are watching to see if the momentum that drove silver from its lower support levels can overcome the psychological and technical barrier at $65.37.
The divergence between different timeframes is a classic trading scenario. The 4-hour chart screams 'buy' with its strong uptrend and positive indicators. The daily chart also leans bullish, showing room for growth. However, the 1-hour chart's neutrality acts as a cautionary note, suggesting that the path higher might not be a straight line. This is where risk management becomes paramount. A trader might look for a clear break above $65.37 on the 1-hour chart, confirmed by bullish momentum and ideally a slight pullback and hold above that level on a subsequent retest, before committing to a long position. Alternatively, a breakdown below the 1-hour support at $63.94 could signal a short-term shorting opportunity, targeting lower support levels.
Considering the overall market sentiment, the recent upward movement in silver, despite a strengthening dollar at times, indicates a degree of resilience. The fact that silver is pushing towards resistance levels while broader economic indicators remain mixed suggests that specific market dynamics are at play. The ADX at 29.84 on the 1-hour chart is a strong indicator of trend development. While the RSI at 68.5 suggests caution, the overall trend strength implies that dips might be seen as buying opportunities by market participants. This is not a time for complacency; it's a time for careful observation of how price reacts at these critical levels. The market is at a crossroads, and the next few trading sessions will likely provide clarity.
The price action around $65.04 is a testament to the ongoing tug-of-war between buyers and sellers. The support levels identified at $63.94 and $63.17 on the 1-hour chart are the immediate lines in the sand for the bulls. If these levels fail to hold, the bullish narrative would be significantly weakened, potentially leading to a test of the more significant daily support at $61.40. Conversely, a successful breach of $65.37 could ignite a rally towards $65.62 and beyond. The confluence of multiple bullish signals across timeframes, particularly the strong ADX on the 4-hour chart, suggests that the upside potential is currently favored, provided key resistance doesn't hold firm. This makes the $65.37 level a critical inflection point for the near-term direction of XAGUSD.
The interplay between gold and silver (XAUUSD and XAGUSD) is also worth noting. While XAUUSD is trading at $4358.73 and showing a neutral trend on the daily, its momentum is also positive on shorter timeframes. Silver's stronger upward momentum recently suggests a potential outperformance, or it could simply be catching up. Understanding this dynamic can provide additional context. If gold begins to falter while silver continues to climb, it might indicate a specific demand for silver driven by industrial or investment factors, separate from the broader precious metals complex. However, for now, the focus remains squarely on XAGUSD's battle at the $65.37 resistance.
The current technical setup presents a compelling, albeit cautious, bullish outlook for XAGUSD. The strong trend signals on the 4-hour chart, coupled with positive MACD and Stochastic readings, suggest that the upward momentum is building. However, the approaching overbought conditions on the RSI and the proximity to the $65.37 resistance level warrant a degree of prudence. Traders should be looking for confirmation of a breakout above this key level, ideally with increased volume and sustained price action. The alternative scenario, a rejection at resistance, could lead to a retracement towards the established support levels, offering a different trading opportunity for those who prefer to trade pullbacks.
Ultimately, the market is a constant dance between fear and greed, and silver is currently at a point where both emotions are likely to be tested. The bullish case is supported by strong trend indicators and the potential for a breakout from consolidation. The bearish case hinges on the ability of the $65.37 resistance to hold, potentially amplified by a strengthening dollar or a shift in risk sentiment. For active traders, the key is to align with the prevailing trend, manage risk diligently, and wait for clear signals. The $65.04 price point is where the decision is being made, and the action around $65.37 will dictate the next phase.
Bearish Scenario: Resistance Holds Firm
45% ProbabilityNeutral Scenario: Consolidation Around Resistance
30% ProbabilityBullish Scenario: Breakout Confirmation
25% ProbabilityFrequently Asked Questions: XAGUSD Analysis
What happens if XAGUSD breaks above the $65.37 resistance level today?
A confirmed break above $65.37, especially on the 1H chart, would validate the bullish scenario. The immediate target would be $65.62, with potential to extend towards $66.38 if momentum continues. This would signal a continuation of the broader uptrend.
Should I buy XAGUSD at current levels of $65.04 given the RSI at 68.5?
Buying at $65.04 with RSI at 68.5 carries risk due to proximity to resistance and overbought conditions on the 1H chart. A more prudent approach might be to wait for a confirmed breakout above $65.37 or a pullback to a support level like $63.94, with a probability estimate of 45% for a bearish scenario and 25% for bullish confirmation.
Is the RSI at 68.5 a sell signal for XAGUSD right now?
An RSI of 68.5 is nearing overbought territory but is not a definitive sell signal on its own, especially with a strong underlying trend indicated by the 4-hour ADX of 45.66. It suggests potential for a short-term pullback or consolidation rather than an immediate reversal. Confirmation from price action and other indicators is crucial.
How will the DXY at 99.71 affect XAGUSD this week?
With the DXY currently at 99.71 and showing some strength, it poses a potential headwind for XAGUSD. A rising dollar typically puts pressure on precious metals. However, silver's recent resilience suggests that other factors, like strong technical momentum or industrial demand, might be outweighing the dollar's influence for now.
Track markets in real-time
AI-powered analysis, technical indicators and real-time price data.
Join Our Telegram Channel
Breaking market news, AI analysis and trading signals instantly.
Join Channel