
Gold Tests Key Resistance: Can XAUUSD Hold $4,364.58 Amid Shifting Market Winds?
XAUUSD hovers around $4,364.58. With mixed signals from indicators and evolving macro factors, traders eye crucial support and resistance zones.
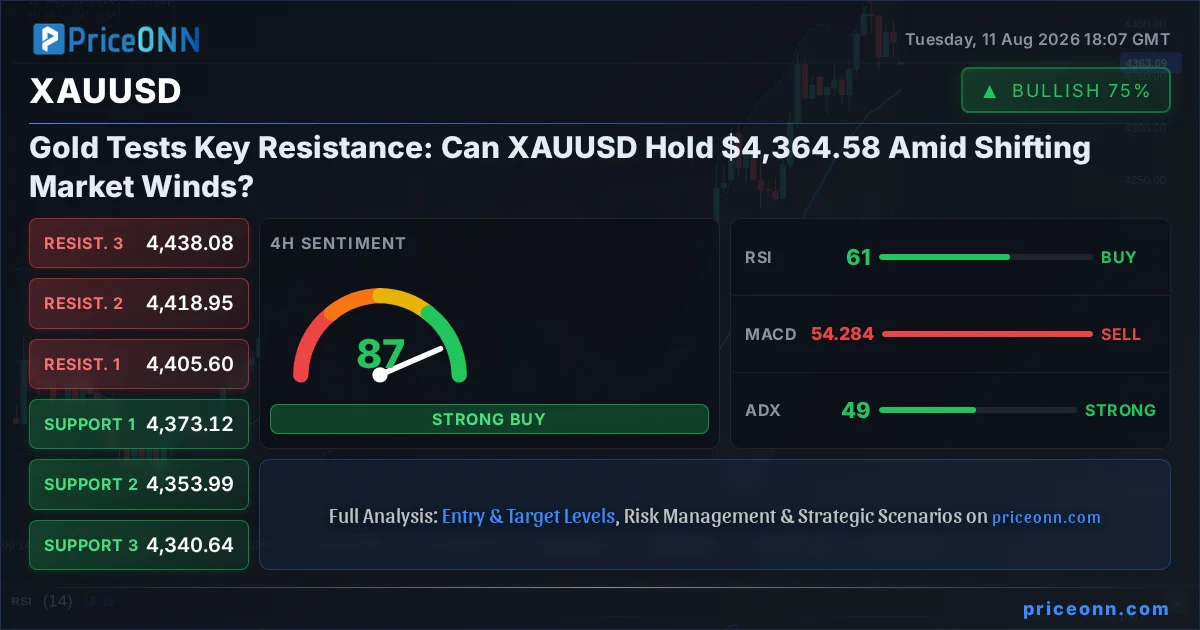
The global financial stage is a complex tapestry, and right now, gold traders are intently watching the threads woven by shifting macroeconomics and technical divergences. As XAUUSD hovers precariously around the $4,364.58 mark, a critical juncture has been reached. This isn't just another trading day; it's a pivotal moment where the interplay of inflation expectations, central bank rhetoric, and evolving geopolitical tensions could dictate the precious metal's short-to-medium term trajectory. The question on everyone's mind is whether the current price action represents a temporary pause before a renewed ascent, or the beginning of a more significant pullback. Understanding the nuances of the current market sentiment, the correlation with the dollar index, and the strength of the underlying trend is paramount for navigating this potentially volatile period.
- Gold's current price of $4,364.58 is testing key resistance levels, with the 1H chart showing a bearish signal despite a strong 4H and 1D bullish trend.
- The Dollar Index (DXY) at 99.89 is showing mixed signals, with a strong daily downtrend but recent upward momentum on shorter timeframes, influencing gold's correlation.
- RSI at 44.94 on the 1H suggests waning momentum for gold, contrasting with stronger bullish signals on longer timeframes, indicating a potential divergence.
- Geopolitical uncertainty and inflation data remain key drivers, with upcoming CPI reports poised to significantly impact gold's direction.
The narrative surrounding gold has been one of resilience, often acting as a safe-haven asset during times of economic uncertainty. Recently, reports indicated gold pushing towards two-month highs, nearing the $4,450 an ounce level, driven by expectations around the U.S. inflation report and evasive geopolitical developments. This upward momentum, however, appears to be facing headwinds as we approach crucial technical levels. The current price of $4,364.58 sits within a zone where shorter-term technical indicators are flashing caution, even as longer-term trends suggest underlying strength. This divergence is a classic recipe for increased volatility, as traders grapple with conflicting signals and the potential for sharp reversals. The market is keenly awaiting confirmation from upcoming economic data, particularly the Consumer Price Index (CPI) report, which could either solidify the case for a Federal Reserve hold on interest rates, or reignite inflation concerns, both of which have significant implications for the precious metal.
Navigating the Technical Crosscurrents: A Multi-Timeframe Perspective
Delving into the technical indicators provides a clearer, albeit complex, picture of gold's immediate prospects. On the 1-hour timeframe, the trend is technically classified as 'Yükseliş' (Uptrend) with a strong 87% conviction, yet the indicators paint a more cautious scenario. The RSI(14) is sitting at 44.94, firmly in neutral territory but exhibiting a downward lean, suggesting that the immediate buying pressure is softening. The MACD is also showing negative momentum, with its signal line below the MACD line, a bearish sign for intraday traders. Bollinger Bands are trading below the middle band, reinforcing this short-term bearish inclination. Stochastic oscillator confirms this, with %K at 37.66 below %D at 55.67, signaling a potential move lower. The ADX at 23.25 indicates a trend of moderate strength, but in the context of these other indicators, it leans towards a weakening upward move rather than a robust one. The overall signal on this timeframe is 'SAT' (Sell), with 6 sell signals versus 2 buy signals.
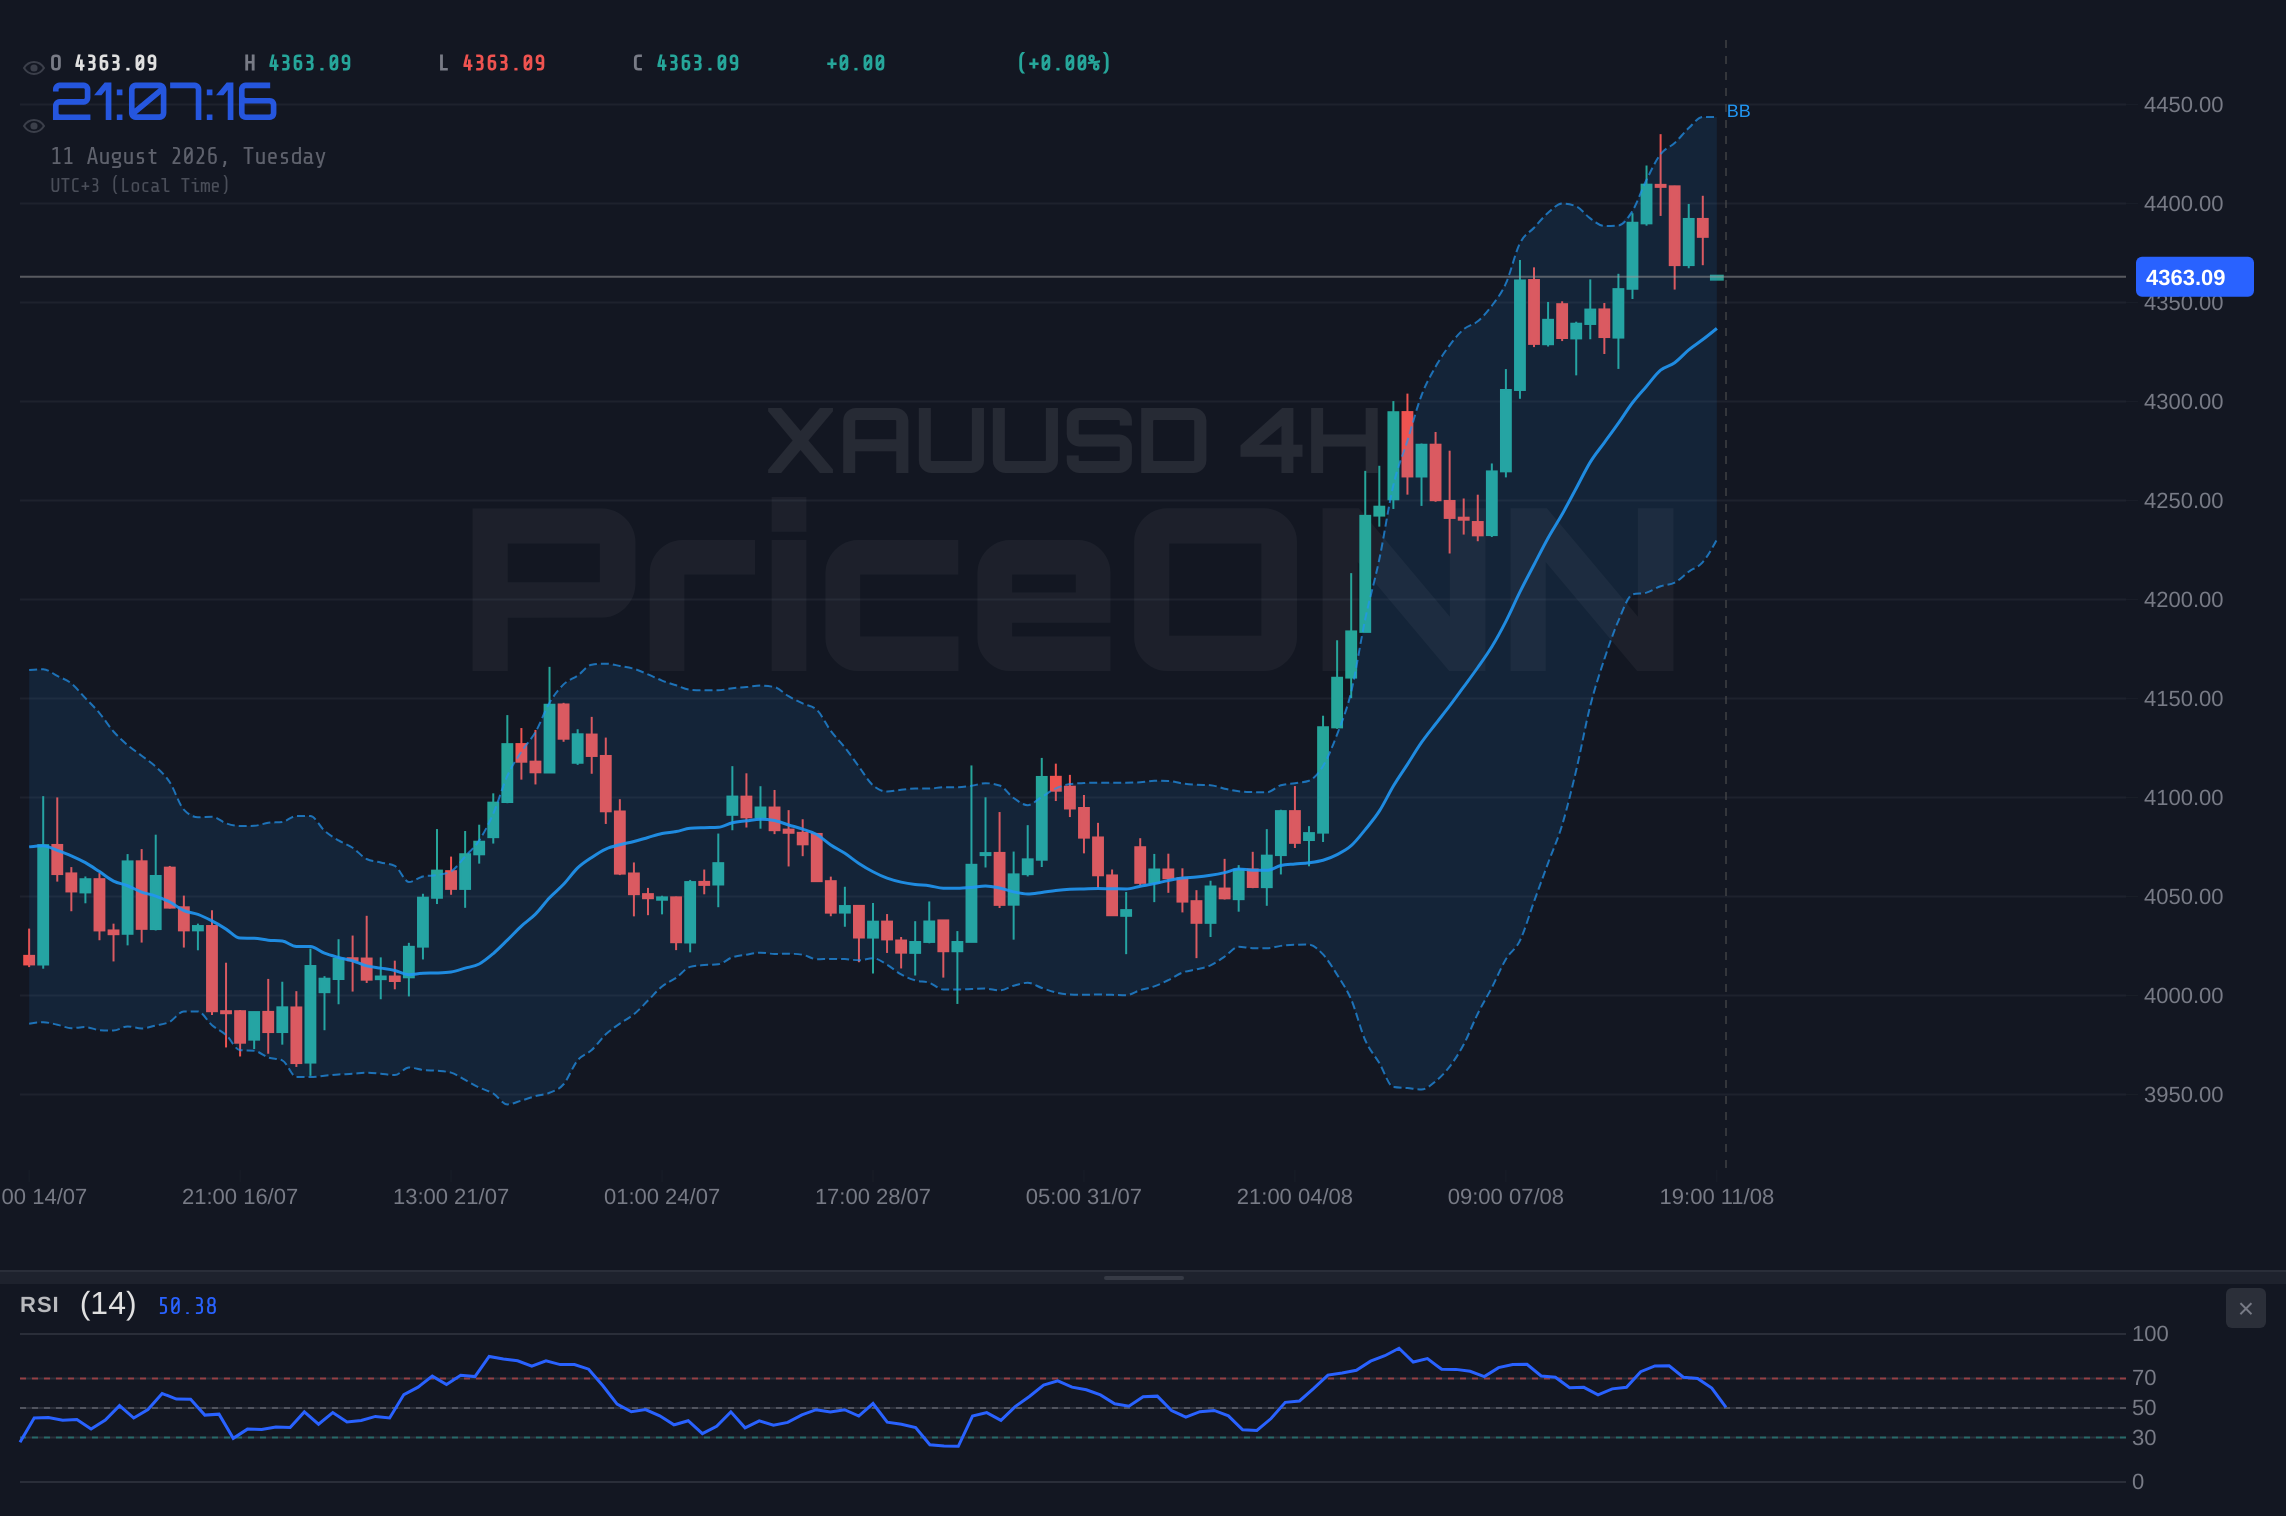
However, broadening the scope to the 4-hour chart reveals a starkly different picture. Here, the trend is unequivocally bullish, with a perfect 100% strength rating. The RSI(14) is at 61.16, comfortably in neutral territory and showing an upward bias, indicating room for further gains. MACD, while still showing negative momentum on the 1H, appears to be consolidating or preparing for a shift on this timeframe. Crucially, the Bollinger Bands are trading above the middle band, suggesting an upward bias. The Stochastic oscillator, despite showing a %K of 50.37 below %D of 74.74 (a bearish cross), is still in a position that doesn't scream 'oversold' or 'overbought', leaving room for price action. The ADX reading here is a significant 48.5, indicating a strong uptrend. This timeframe's general signal is 'AL' (Buy), with a strong 6 buy signals to 2 sell signals. This sharp contrast between the 1H and 4H charts highlights the intraday choppiness versus the established medium-term trend.
The daily chart solidifies the bullish argument, showing a neutral trend with 50% strength but heavily favoring upside potential based on other indicators. The RSI(14) at 65.34 is in the upper neutral zone, showing a clear upward inclination, suggesting buyers are still in play. The MACD is positive and above its signal line, confirming bullish momentum on a daily basis. The Bollinger Bands are trading above the upper band, which can signal either a strong uptrend continuation or an overextended move ripe for a pullback. The Stochastic oscillator is showing a strong bullish signal with %K at 91.27 well above %D at 74.42, indicating the market is entering or is in overbought territory. The ADX at 29.01 also points to a strong uptrend. The overall signal for the daily timeframe is 'AL' (Buy), with 7 buy signals to 1 sell signal. This confluence of bullish signals on the daily chart, despite the bearish lean on the 1H, creates a critical decision point for traders: does the longer-term trend prevail, or do the immediate intraday signals dictate a short-term correction?
The Dollar's Dance and Gold's Dilemma
The intricate relationship between the U.S. Dollar Index (DXY) and gold is a cornerstone of precious metals analysis. Currently, the DXY is at 99.89, showing a daily downtrend with a 41.4 RSI but exhibiting upward momentum on shorter timeframes. This mixed picture for the dollar adds another layer of complexity to gold's outlook. A strengthening dollar typically exerts downward pressure on gold, as dollar-denominated commodities become more expensive for holders of other currencies. Conversely, a weakening dollar can boost gold prices. The DXY's current stance, with its daily chart showing weakness but intraday charts suggesting a potential rebound, creates a neutral to slightly bullish bias for the dollar in the very short term. This could be a contributing factor to gold's intraday struggles, as seen on the 1H chart. However, the broader downtrend on the daily DXY, if it resumes, could provide a tailwind for gold, especially if coupled with rising inflation fears.
The market sentiment surrounding the dollar is also influenced by the U.S. Federal Reserve's monetary policy stance. Recent data, including employment figures, have led to expectations of a Fed pause on interest rate hikes. This has historically been supportive of gold prices, as lower interest rates reduce the opportunity cost of holding non-yielding assets like gold. The upcoming CPI report is therefore crucial. If inflation proves to be stubbornly high, it could force the Fed's hand, potentially leading to further rate hikes and a stronger dollar, which would likely pressure gold. Conversely, if inflation cools significantly, it would reinforce the Fed pause narrative, weaken the dollar, and potentially send gold prices higher. The current price action of XAUUSD around $4,364.58 is occurring precisely at this crossroads of monetary policy expectations and inflation data dependency.
Looking at the correlation, when the DXY strengthens, XAUUSD often weakens, and vice versa. With the DXY currently at 99.89, exhibiting a mixed short-term trend, this inverse correlation suggests that any sustained upward move in the dollar could cap gold's immediate gains or even trigger a pullback. Conversely, a failure of the dollar to hold its gains, or a renewed push lower, would likely provide a boost to gold. The analysis of the DXY's 1H chart shows a bullish signal (6 buy, 2 neutral) while the 4H also leans bullish (6 buy, 2 neutral), but the 1D chart presents a strong bearish signal (2 buy, 6 sell). This divergence within the dollar index itself mirrors the conflicting signals seen in gold, emphasizing the current market's indecision and the critical nature of upcoming economic releases.
Geopolitical Undercurrents and Inflationary Pressures
Beyond the immediate technicals and dollar dynamics, the broader macroeconomic environment continues to shape gold's appeal. News reports from August 10th highlighted gold inching higher amid expectations of a soft landing for the U.S. economy, coupled with an evasive U.S.-Iran deal. This suggests that geopolitical uncertainty, even if not escalating dramatically, continues to provide a baseline level of support for the precious metal. Safe-haven demand typically rises when global tensions are high, and while the current situation may not be at peak crisis levels, the lingering risks contribute to gold's allure. Analysts noted gold rallying towards $4,400 on August 11th, reaching a two-month high, with growing demand for the precious metal and expectations of a Fed hold on rates following softer labor market data.
The energy markets also play a significant role in the inflation narrative, which directly impacts gold. Brent crude is trading at $87.29, showing a daily increase of 0.89%, and WTI is at $84.04, up 0.96%. This rise in oil prices, often a leading indicator of broader inflation, adds another layer of complexity. Higher energy costs translate to higher transportation and production costs across the economy, potentially fueling inflationary pressures. If inflation remains elevated, it could force central banks to maintain a hawkish stance, which would typically be negative for gold. However, if inflation is perceived as being driven by supply-side shocks that central banks cannot easily control, gold might benefit as a hedge against eroding purchasing power. The current upward trend in oil prices suggests that inflationary pressures might persist, creating a supportive, albeit complex, backdrop for gold.
The market is closely watching the upcoming CPI report, scheduled for release this Wednesday. This report will be a critical determinant of whether the Federal Reserve maintains its current monetary policy or contemplates further tightening. A higher-than-expected CPI reading could reignite fears of persistent inflation, potentially leading to a stronger dollar and pressure on gold in the short term, or alternatively, it could boost gold as an inflation hedge if the market anticipates the Fed's actions to be insufficient. Conversely, a cooler CPI print would likely solidify expectations of a Fed pause or even future rate cuts, which would typically be bullish for gold and bearish for the dollar. The current price of $4,364.58 for XAUUSD is poised to react strongly to this data, making it a key event for traders to monitor.
Trade Scenarios and Risk Management at $4,364.58
Given the current technical divergence and the critical macro backdrop, multiple scenarios are plausible for XAUUSD. The 4-hour and daily charts suggest a continuation of the bullish trend, targeting higher resistance levels. However, the bearish signals on the 1-hour chart, coupled with a mixed DXY and the uncertainty surrounding the upcoming CPI data, introduce significant risk. Patience and disciplined risk management are therefore essential. Traders should be looking for clear confirmation before committing to a direction. The current price of $4,364.58 represents a key battleground between short-term profit-taking and longer-term accumulation.
Bearish Scenario: Pullback Underway
65% ProbabilityNeutral Scenario: Consolidation Around $4,364.58
25% ProbabilityBullish Scenario: Trend Continuation
10% ProbabilityThe immediate outlook for XAUUSD hinges on the ability of price to either break decisively through the intraday resistance levels or hold the key support zones identified on the 1-hour chart. The 1H chart's 'SAT' signal, coupled with RSI at 44.94 and MACD momentum favoring sellers, suggests that a pullback towards the $4,370s is the most probable short-term outcome. However, the strength of the 4H and 1D bullish trends, with higher ADX readings and positive MACD on the daily, indicates that any dip could be a buying opportunity for those betting on the continuation of the larger trend. The critical support level to watch on the 1H chart is $4,379.14, followed by $4,375.06. A break below these levels would validate the bearish scenario. On the flip side, a sustained move above the 1H resistance at $4,386.44, and more importantly, above $4,393.74, would signal a continuation of the bullish trend, potentially targeting the 4H resistance at $4,405.60 and the daily resistance at $4,419.24.
The upcoming CPI report is a significant market mover. Traders should exercise extreme caution around its release. High volatility is expected, and positions may be subject to rapid reversals. Consider reducing position sizes or waiting for volatility to subside before entering new trades.
The interplay between the dollar index, oil prices, and the impending CPI data creates a complex environment. While the longer-term technicals for gold remain supportive, the short-term signals and the broader macroeconomic uncertainties warrant a cautious approach. The price of $4,364.58 represents a critical pivot point. A failure to hold the immediate support levels could lead to a test of lower ground, potentially triggering stop-losses and accelerating a move towards the $4,370s. Conversely, a successful defense of these levels, coupled with positive inflation data or dovish Fed commentary, could fuel another leg higher, targeting the $4,400+ levels. The market is clearly at a crossroads, and the next few trading sessions will likely be decisive in setting the tone for gold's next major move.
Frequently Asked Questions: XAUUSD Analysis
What happens if XAUUSD breaks below $4,371.84 support?
A break below $4,371.84, a key 1H support level, would invalidate the immediate bullish outlook and could trigger a sell-off towards $4,356.58, the low of the daily range. This would align with the bearish scenario, suggesting profit-taking or a broader risk-off sentiment.
Should I buy XAUUSD at current levels of $4,364.58 given the mixed 1H signals?
Buying at $4,364.58 carries risk due to the bearish 1H signals. A more prudent approach might be to wait for confirmation, such as a hold of the $4,375.06 support or a clear break above the $4,386.44 resistance, aligning with the respective bullish or bearish scenarios.
Is the RSI at 44.94 a sell signal for XAUUSD right now?
An RSI of 44.94 on the 1H chart is in neutral territory but leaning bearish, suggesting waning momentum for buyers. While not an outright sell signal on its own, it supports the possibility of a short-term pullback, especially when viewed alongside other bearish 1H indicators.
How will the upcoming CPI data affect XAUUSD this week?
The CPI report is critical. A higher-than-expected number could fuel inflation hedges, boosting gold initially, but might also lead to Fed tightening fears, weakening it. A cooler print could signal Fed pause, supporting gold by weakening the dollar. Expect volatility around the release.
| Indicator | Value | Signal | Interpretation |
|---|---|---|---|
| RSI (14) (1H) | 44.94 | Bearish | Momentum waning, nearing oversold territory on 1H |
| MACD (1H) | Negative Momentum | Bearish | Below signal line, indicating downward pressure |
| Stochastic (1H) | K:37.66, D:55.67 | Bearish | %K below %D, confirming short-term selling bias |
| ADX (1H) | 23.25 | Neutral Trend | Moderate trend strength, but showing signs of weakening |
| RSI (14) (4H) | 61.16 | Bullish | Comfortably in neutral zone, upward bias |
| ADX (4H) | 48.5 | Strong Trend | Indicates a robust uptrend on the 4-hour chart |
| RSI (14) (1D) | 65.34 | Bullish | Upper neutral zone, indicating buyer interest |
| MACD (1D) | Positive Momentum | Bullish | Above signal line, confirming daily uptrend |
Track markets in real-time
AI-powered analysis, technical indicators and real-time price data.
Join Our Telegram Channel
Breaking market news, AI analysis and trading signals instantly.
Join Channel