
S&P 500 Tests Key Resistance at $6,572.87: What's Next?
The S&P 500 hovers around $6,572.87, facing crucial resistance. Analysis reveals mixed signals across timeframes, with bulls eyeing a breakout while bears watch for weakness.
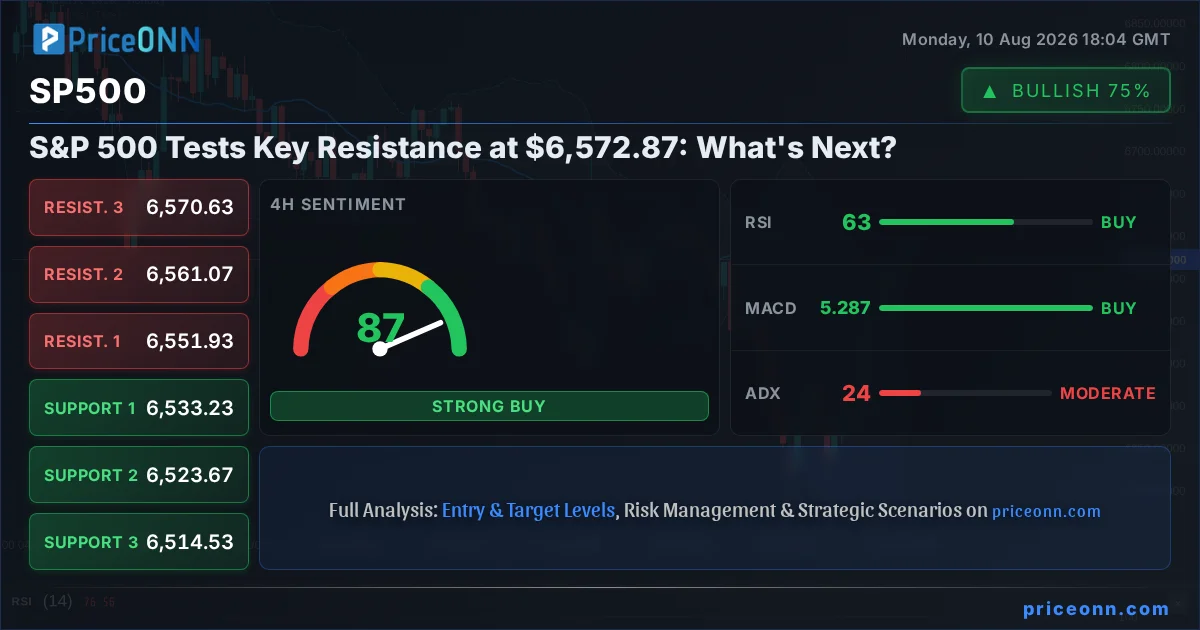
The S&P 500 is currently trading at $6,572.87, teetering on the edge of a significant resistance level that could dictate its short-term trajectory. This pivotal moment demands a deep dive into the technicals, correlating market forces, and potential scenarios that traders are closely watching. With the index showing strength on shorter timeframes but facing headwinds on longer ones, understanding the confluence of indicators and price action is paramount for navigating the current market landscape. This analysis delves into the multi-timeframe technical picture, exploring the implications of current indicator readings and key price levels to map out potential trading strategies.
- The S&P 500 is trading at $6,572.87, testing a critical resistance zone.
- RSI at 70.95 on the 1H chart signals overbought conditions, suggesting potential short-term selling pressure.
- ADX at 49.72 on the 1H chart indicates a strong trend, but the conflicting MACD histogram points to potential weakening momentum.
- Key resistance is identified at $6,568.73, with a decisive break above needed to confirm further upside.
- The DXY is at 99.82, currently supporting risk assets but facing potential headwinds from its daily chart signals.
Navigating the $6,572.87 Crossroads: A Multi-Timeframe Technical Deep Dive
The S&P 500's current position around $6,572.87 is more than just a price point; it represents a critical juncture where the market's sentiment and directional conviction will be tested. The upward momentum observed on shorter timeframes, particularly the 1-hour and 4-hour charts, suggests underlying buying interest. However, the daily chart paints a more cautious picture, indicating that the broader trend might be losing steam or consolidating. This divergence between short-term strength and potential long-term weakness is a classic setup that requires careful analysis. Traders are dissecting every tick, looking for confirmation of a sustained move higher or signs of a reversal. The interplay between risk appetite, reflected in indices like the S&P 500 and Nasdaq, and safe-haven assets like gold and the dollar index (DXY), further complicates the immediate outlook. Understanding these dynamics is key to deciphering whether the current price action is a prelude to a new rally or a precursor to a pullback.
The Bullish Case: Charting a Path Above Resistance
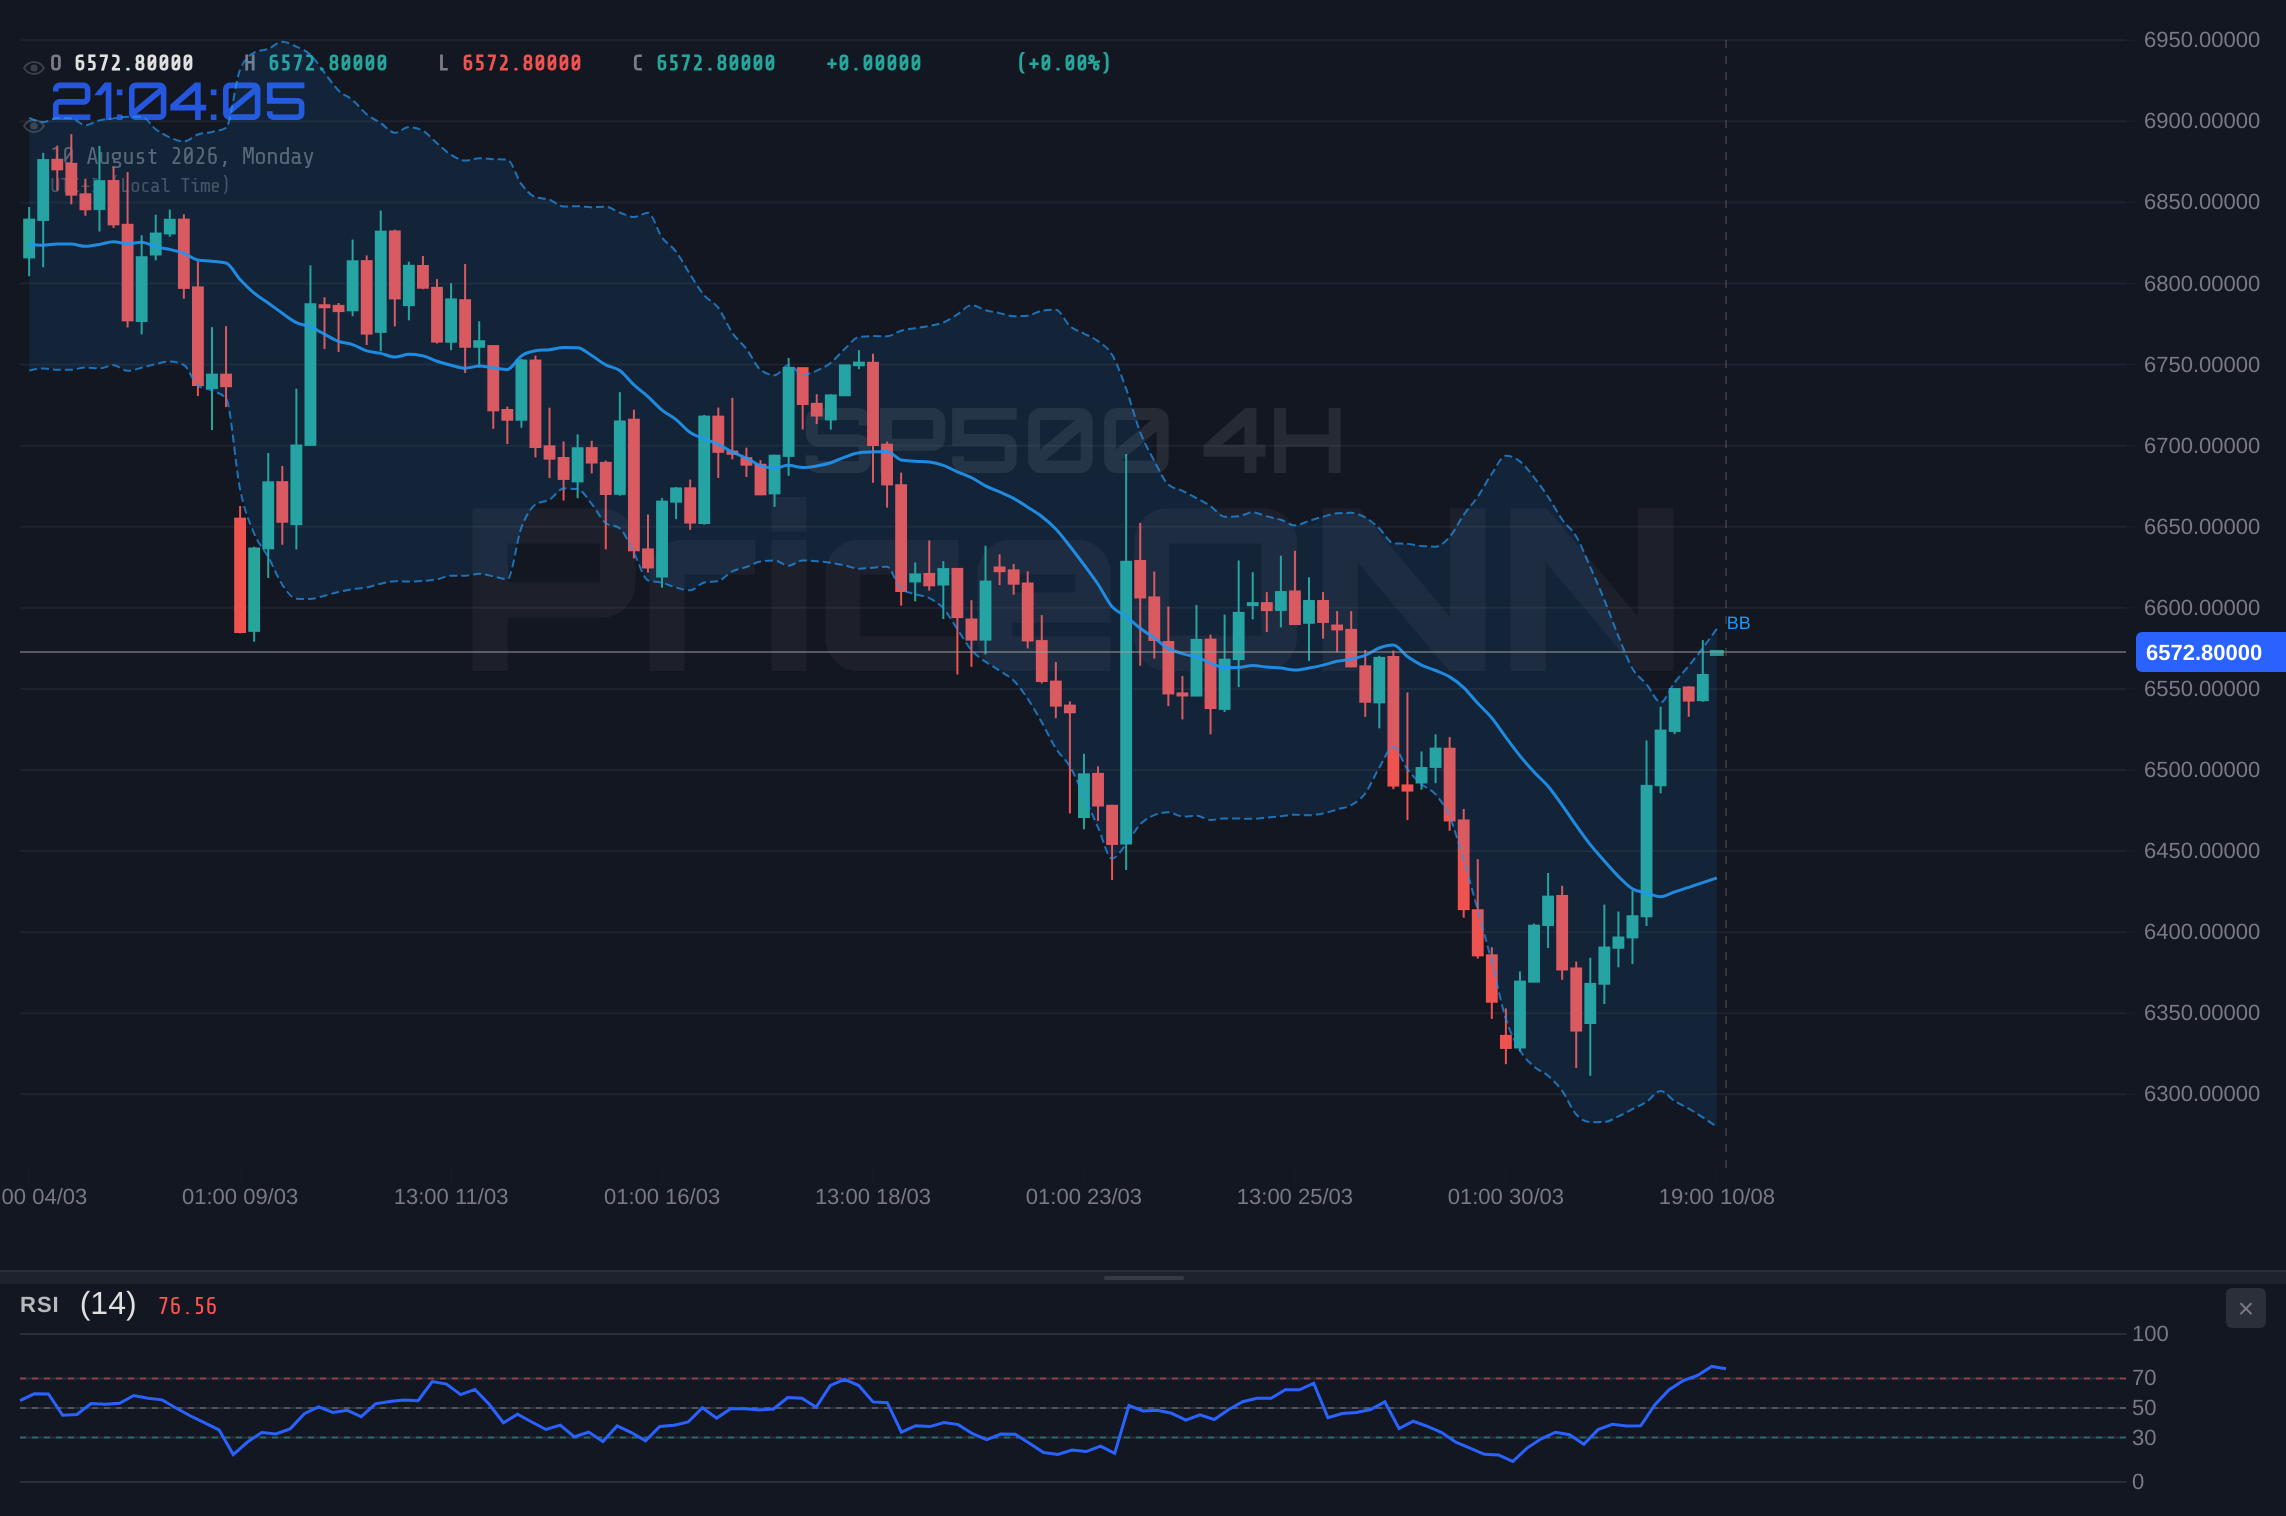
For the bulls to maintain control, a decisive breach above the immediate resistance at $6,568.73 is essential. The 1-hour chart shows a strong upward trend with an ADX reading of 49.72, indicating a robust trend is in play. However, the RSI at 70.95 on this timeframe is flashing an overbought signal, suggesting that the recent rally might be extended and vulnerable to short-term profit-taking. The Stochastic Oscillator, with its %K line at 65.73 and %D line at 73.5, also shows a potential bearish crossover signal, reinforcing the idea that the immediate upward momentum could be waning. Despite these short-term overbought conditions, the overall trend strength on the 4-hour chart, with an ADX of 24.23, remains moderately positive, and the MACD is above its signal line, suggesting that underlying bullish sentiment could prevail. A break above $6,568.73, followed by consolidation above this level, would likely target the next resistance at $6,577.27 and potentially push towards $6,589.83. Confirmation would require sustained buying volume and a clear rejection of any pullbacks to the $6,547.63 support level.
The Bearish Scenario: Identifying Weakness and Reversal Signals
Conversely, the bears have several technical indicators suggesting a potential downturn. The 1-hour RSI at 70.95 is a primary concern, often preceding a correction or consolidation phase. Furthermore, the MACD histogram on the 1-hour chart shows negative momentum, and the Stochastic Oscillator is indicating a potential bearish crossover, with the %K line (65.73) falling below the %D line (73.5). While the ADX at 49.72 suggests a strong trend, this strength could be leading towards exhaustion. If the S&P 500 fails to break decisively above $6,568.73, a move back towards the support at $6,547.63 becomes probable. A break below this level would then open the door to further downside, targeting $6,535.07 and potentially $6,526.53. The daily chart's trend is currently classified as 'Düşüş' (Bearish) with a 100% strength rating, and an RSI of 45.35, which, while not oversold, indicates a bearish lean. A close below the $6,526.53 support would strongly validate the bearish thesis, especially if accompanied by increasing volume and a risk-off sentiment in broader markets, potentially exacerbated by a strengthening DXY. The daily MACD also shows negative momentum, reinforcing the bearish outlook on the longer timeframe.
The Waiting Game: Consolidation and Range-Bound Dynamics
Between the clear bullish and bearish scenarios lies the possibility of consolidation. The current price action, hovering around $6,572.87, could represent a period of indecision. On the 4-hour chart, the trend is neutral with a strength of 50%, and the ADX at 24.23 indicates a moderate trend, not a strong, directional one. The RSI at 62.83 is in neutral territory, and Bollinger Bands show the price trading above the middle band, suggesting an upward bias but not an aggressive rally. The Stochastic Oscillator on this timeframe is in overbought territory (K=97.85, D=86.96), which can sometimes lead to range-bound trading rather than a sharp reversal. If neither the bulls nor the bears can gain decisive control, the S&P 500 might oscillate between the immediate support at $6,547.63 and resistance at $6,568.73, or even widen its range to test $6,535.07 and $6,577.27. This sideways movement could be influenced by upcoming economic data, such as inflation reports or central bank commentary, which might temporarily pause directional trading. Such a period of consolidation could also be seen as a 'cooling off' phase after recent gains, allowing momentum indicators to reset before the next significant move.
The Bull's Roadmap: Targeting New Highs
For the bullish scenario to materialize, several conditions must be met. Firstly, price must decisively break and hold above the immediate resistance at $6,568.73. This breakout needs to be supported by strong trading volume, indicating significant institutional interest. Confirmation would come from the 1-hour RSI moving out of overbought territory without a sharp drop and the Stochastic Oscillator completing its potential bearish crossover without a significant price decline, or ideally, showing a bullish divergence if a minor pullback occurs. A sustained move above $6,568.73 would then target the next resistance level at $6,577.27. If this level is also cleared with conviction, the focus would shift to $6,589.83. The overall trend strength on the 4-hour chart (ADX 24.23) and the positive MACD momentum provide a foundational basis for this bullish outlook. However, it's crucial to monitor the daily trend, which is currently bearish. A sustained move above $6,589.83 would challenge this daily bearish bias, potentially signaling a shift in the broader market sentiment. The DXY at 99.82 is currently showing mixed signals, which could offer some breathing room for equities, but any significant strengthening of the dollar would pose a headwind to this bullish thesis.
Bullish Breakout: Chasing the $6,589.83 Target
35% ProbabilityBearish Reversal: Retreating from Resistance
55% ProbabilityConsolidation Phase: The Waiting Game
10% ProbabilityWhere Bears Take Control: The Daily Chart's Warning
The daily chart presents a significant challenge to the bullish narrative. Classified as having a 'Düşüş' (Bearish) trend with 100% strength, it suggests that longer-term selling pressure could dominate. The RSI(14) at 45.35 is below the 50-midpoint, indicating a bearish lean, and the MACD is firmly in negative territory with its histogram below the signal line. This points to weakening upward momentum and increasing downside risk. If the S&P 500 fails to break decisively above the resistance at $6,568.73 and subsequently breaks below the 1-hour support at $6,547.63, the bearish scenario gains significant traction. The primary target in this case would be the 4-hour support at $6,535.07, followed by the more significant daily support at $6,526.53. A break below $6,526.53 would confirm the daily bearish trend and could trigger a much larger sell-off, potentially targeting the next daily support at $6,472.06. Such a move would likely be amplified by a strengthening DXY (currently at 99.82, but with a bearish daily signal) and a general flight to safety in global markets, potentially driven by inflation concerns or geopolitical events.
Correlation Analysis: DXY, Oil, and the Equity Market
The relationship between the S&P 500, the US Dollar Index (DXY), and oil prices is crucial for understanding the broader market context. The DXY is currently trading at 99.82, showing mixed signals across timeframes. While the 1-hour and 4-hour charts suggest a potential upward bias, the daily chart indicates a bearish trend with an RSI at 40.06. A strengthening dollar typically exerts downward pressure on equities and commodities priced in dollars, like gold. If the DXY breaks decisively above its daily resistance around 99.90, it could add significant headwinds to the S&P 500's ascent. Conversely, a weaker dollar often correlates with higher stock prices and rising commodity prices. Brent crude is trading at $86.37, showing a strong bullish move on the 1-hour chart, which could signal rising inflation expectations. If oil prices continue to climb, it might increase inflation concerns, potentially prompting a more hawkish stance from central banks, which could indirectly pressure equity markets. The current strong upward move in oil, coupled with the S&P 500's own bullish momentum, creates a complex environment where inflation fears and growth optimism are in a tug-of-war.
The Indicator Dashboard: A Technical Confluence
Examining the indicators across different timeframes provides a nuanced view of the S&P 500's current standing. On the 1-hour chart, the ADX at 49.72 signals a strong trend, but the RSI at 70.95 and the Stochastic's bearish crossover suggest overbought conditions and potential exhaustion. The MACD histogram, while positive on the 4-hour and daily charts, shows negative momentum on the 1-hour, adding to the mixed picture. The 4-hour chart offers a more balanced perspective, with a neutral trend strength (ADX 24.23), RSI in neutral territory (62.83), and positive MACD momentum, but overbought Stochastic readings (K=97.85, D=86.96). The daily chart, however, leans bearish, with a bearish trend classification, RSI below 50 (45.35), and negative MACD momentum. This conflict between short-term strength and longer-term weakness suggests that the market is at a critical decision point. Confirmation of a sustained move, either up or down, will likely come from clearer signals on the daily chart or a decisive break of key intraday levels accompanied by strong volume and clear directional cues from correlated assets like the DXY.
| Indicator | Value | Signal | Interpretation |
|---|---|---|---|
| RSI (14) | 70.95 | Overbought | Potential for pullback or consolidation on 1H chart. |
| MACD Histogram | -0.01 | Negative Momentum | Weakening upside momentum on 1H chart. |
| Stochastic | K:65.73, D:73.5 | Bearish Crossover | Potential short-term reversal signal on 1H chart. |
| ADX | 49.72 | Strong Trend | Indicates a strong trend on 1H chart, but could be nearing exhaustion. |
| Bollinger | Middle Band Break | Uptrend Bias | Price above middle band on 1H suggests bullish bias. |
What I'm Watching This Week: Key Triggers for SP500
The immediate future of the S&P 500 hinges on several key triggers that traders will be scrutinizing. Firstly, the ability to decisively break and hold above the $6,568.73 resistance level is paramount. This is not just about price; it's about volume confirmation and sustained momentum that can overcome the overbought signals on shorter timeframes. Secondly, the reaction to the $6,547.63 support level will be critical. A failure to hold this level, especially on the 1-hour chart, could signal the start of a more significant pullback, aligning with the bearish sentiment on the daily chart. Finally, the movement of the DXY and oil prices will provide crucial contextual clues. A strengthening dollar or a continued surge in oil prices could introduce macro-economic headwinds that might overshadow technical signals. Monitoring these levels and correlated assets will be essential for discerning the next probable direction for the S&P 500.
Frequently Asked Questions: S&P 500 Analysis
What happens if the S&P 500 breaks above the $6,568.73 resistance level?
A sustained close above $6,568.73, particularly on the 1-hour chart with strong volume, would likely trigger further upside. This would invalidate immediate bearish concerns and could target the next resistance levels at $6,577.27 and potentially $6,589.83 within the week.
Is the RSI at 70.95 a sell signal for the S&P 500 right now?
An RSI of 70.95 on the 1-hour chart indicates overbought conditions, suggesting potential selling pressure or consolidation in the short term. While not a direct sell signal on its own, it warrants caution and increases the probability of a pullback from current levels around $6,572.87.
How will the DXY's movement at 99.82 affect the S&P 500 this week?
The DXY at 99.82 presents mixed signals across timeframes. If the dollar index strengthens significantly, breaking daily resistance, it could put downward pressure on the S&P 500. Conversely, a weaker dollar would likely offer support to equities, especially if other macro factors remain positive.
Should traders consider buying the S&P 500 at current levels of $6,572.87?
Buying at $6,572.87 carries risk due to the proximity of strong resistance at $6,568.73 and overbought indicators on the 1-hour chart. A more prudent approach might be to wait for a confirmed breakout above resistance or a pullback to support levels like $6,547.63, depending on risk tolerance.
Track markets in real-time
AI-powered analysis, technical indicators and real-time price data.
Join Our Telegram Channel
Breaking market news, AI analysis and trading signals instantly.
Join Channel