

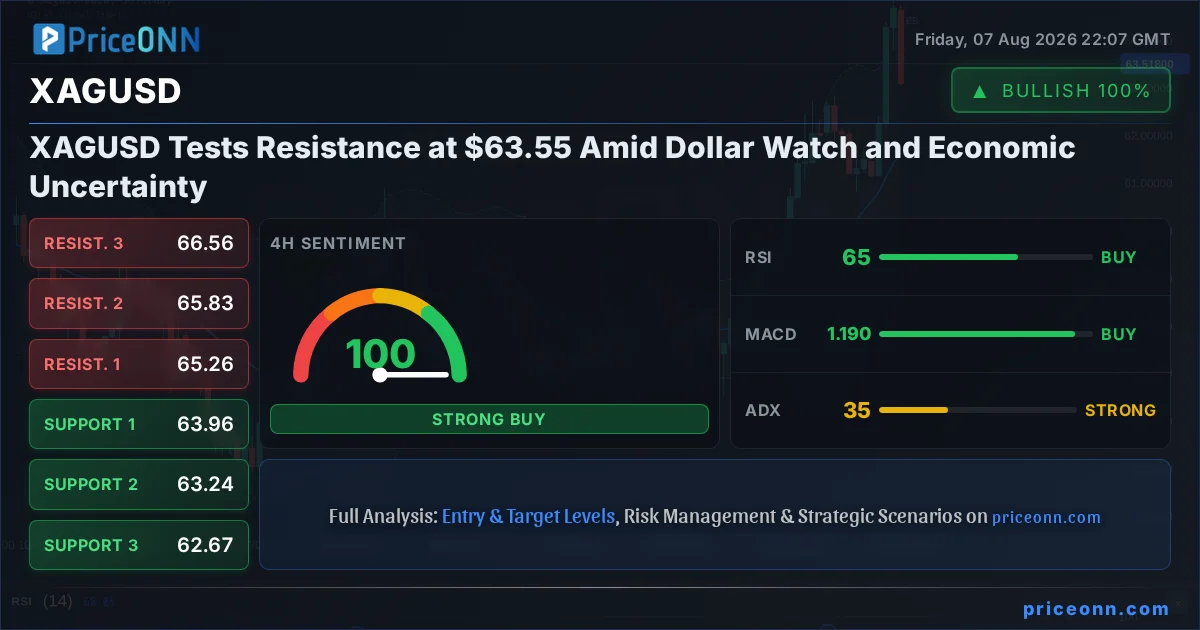
Silver, or XAGUSD as it's known in the trading world, is currently finding itself at a critical juncture, hovering just below resistance at the $63.55 mark. This price point is more than just a number; it represents a battleground where the forces of economic data, central bank policy expectations, and geopolitical undercurrents are clashing. The recent surge in silver prices, mirroring gold's upward trajectory, has been fueled by a complex interplay of factors, but as we approach key economic releases, the market is holding its breath. Understanding the nuances of this current price action requires a deep dive into the technical indicators, the macro-economic landscape, and the ever-present influence of the US Dollar Index (DXY). This analysis aims to dissect these elements to provide a clear picture of where XAGUSD might be heading next.
- The RSI at 65.46 on the 4-hour chart signals that silver is nearing overbought territory, suggesting potential for consolidation or a pullback.
- Critical resistance is forming around the $63.65 level, a break above which could signal further upside potential.
- The ADX at 34.5 indicates a strong upward trend on the 4-hour chart, but this strength needs to be weighed against other indicators.
- The US Dollar Index (DXY) is currently trading around 99.58, with its downward trend potentially offering support to silver prices.
- Upcoming US Non-Farm Payrolls data is a significant event that could trigger a sharp move in XAGUSD.
Navigating the Silver Landscape: Technical Indicators in Focus
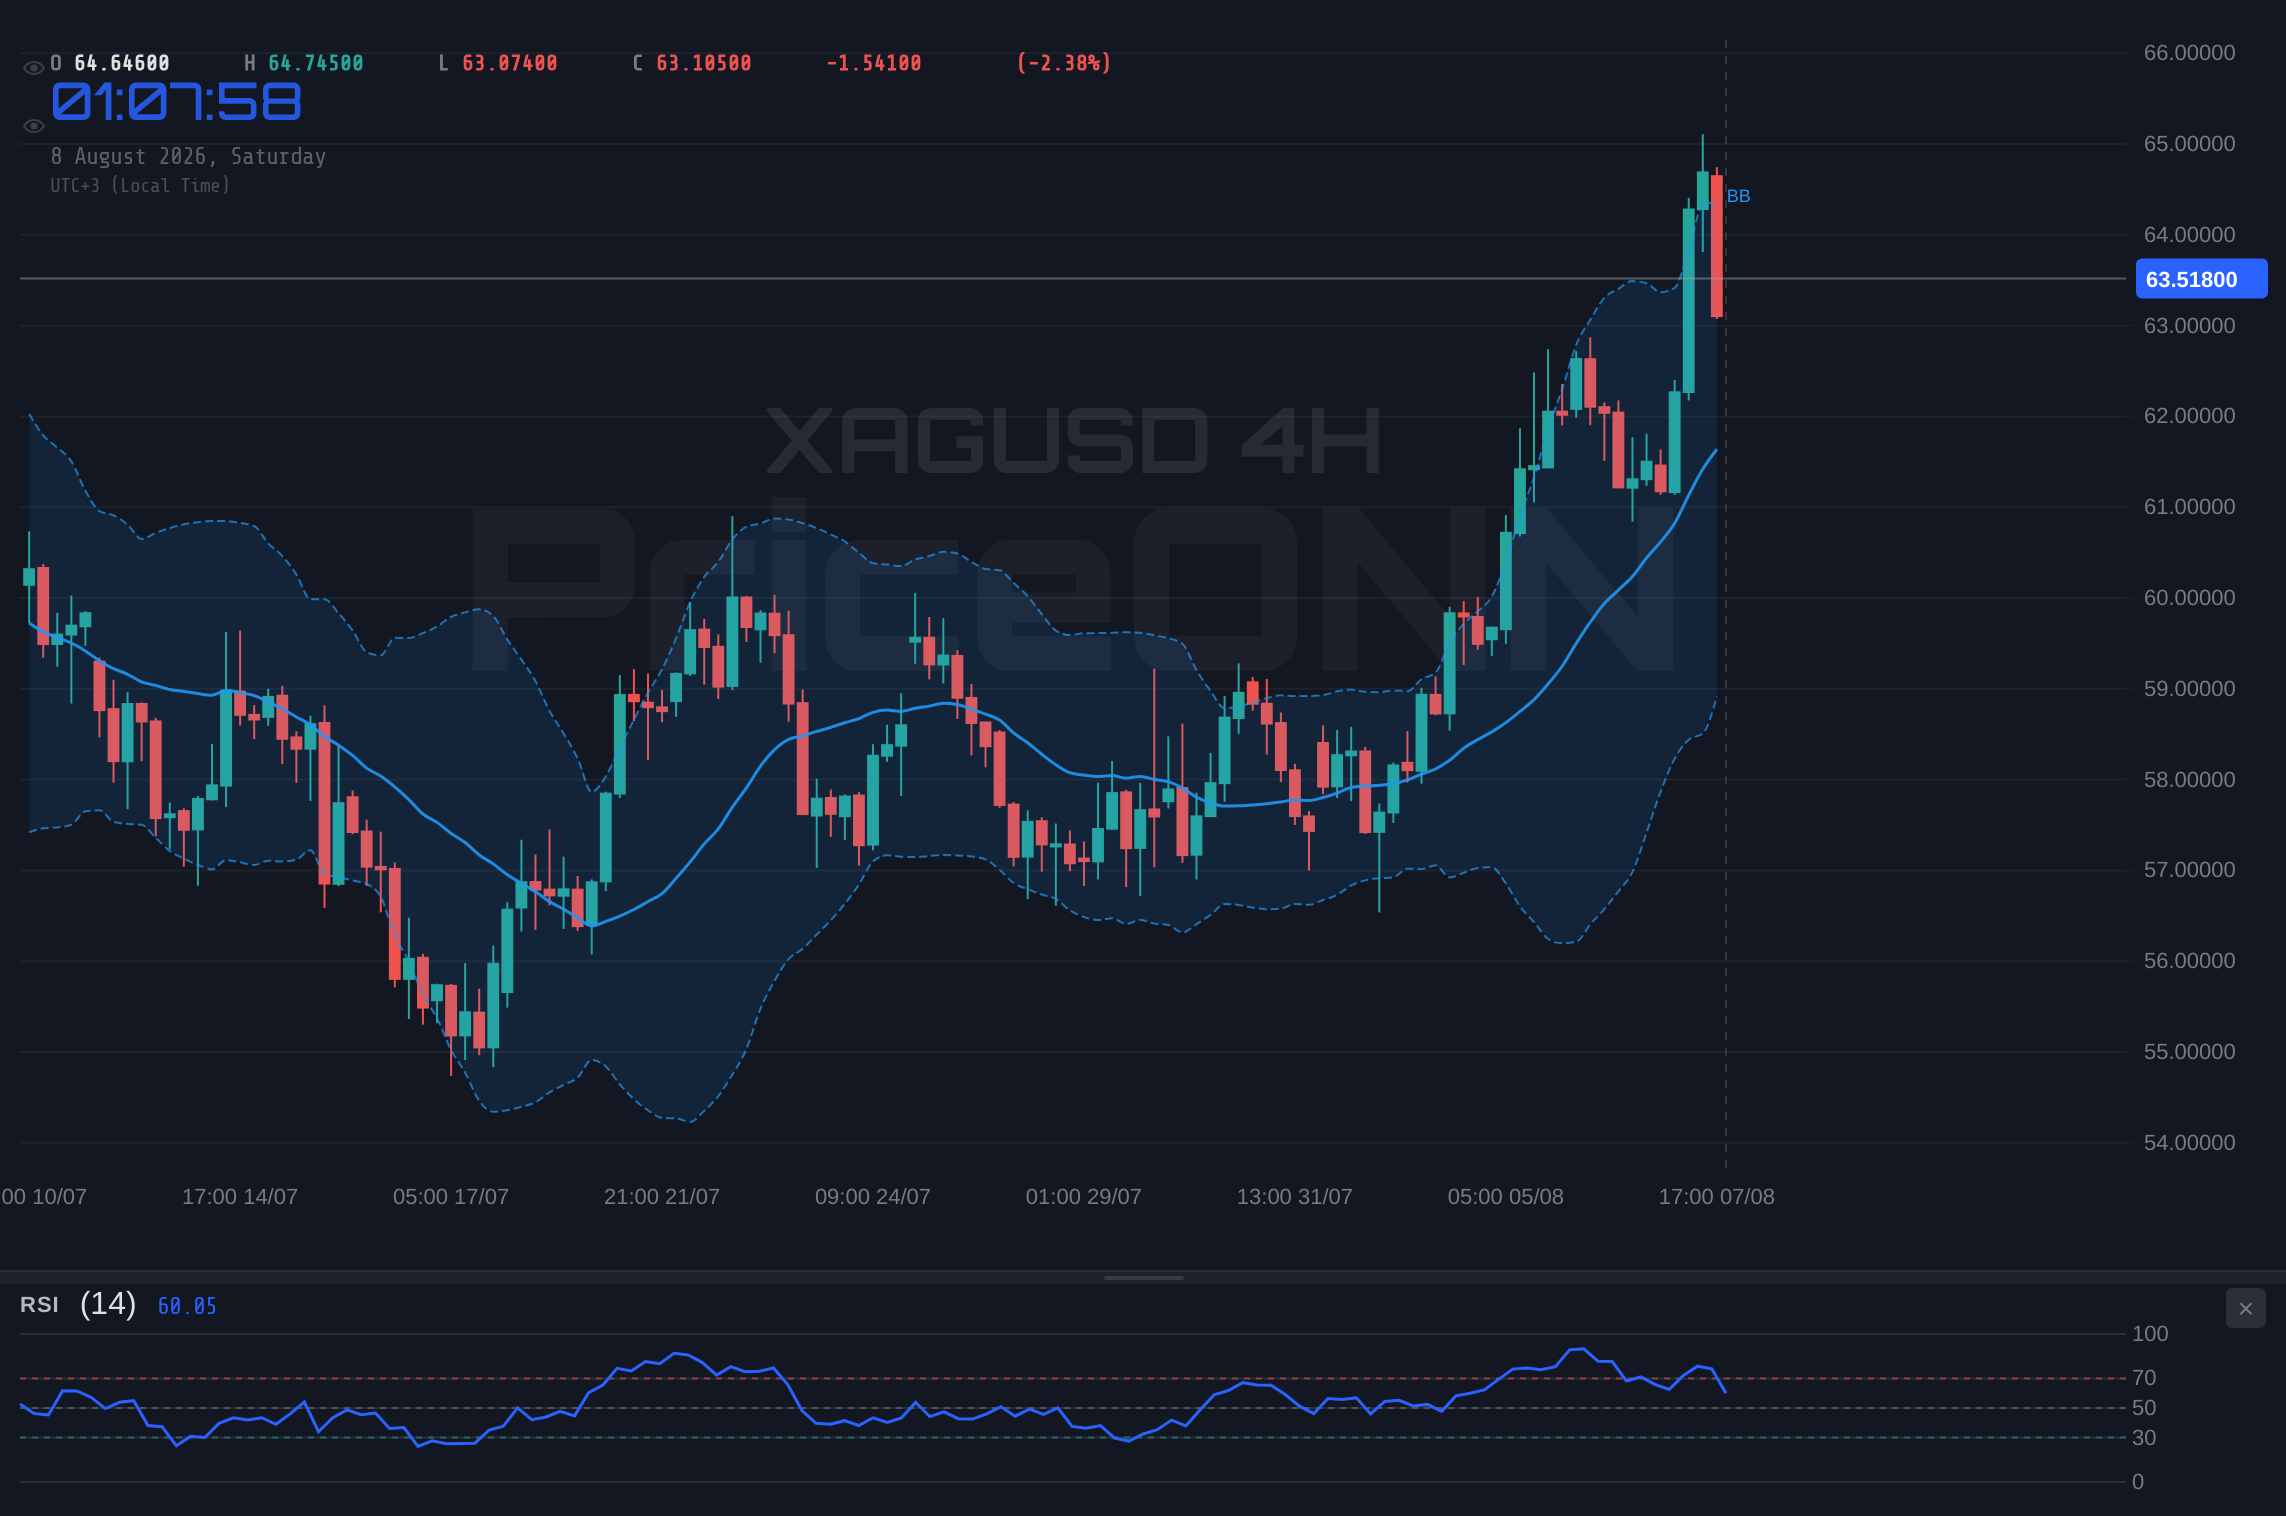
Delving into the technicals, the 4-hour chart for XAGUSD presents a compelling, albeit mixed, picture. The trend is currently marked as neutral with a strength of 50%, which, paradoxically, exists alongside an ADX reading of 34.5. This suggests that while a trend may be present, its conviction is not yet fully established across all timeframes. The RSI(14) on this timeframe sits at 65.46, firmly in the neutral zone but showing a clear upward eğilim, indicating momentum is building. However, this is a level where caution is warranted, as a move above 70 typically signals overbought conditions. Simultaneously, the Stochastic Oscillator shows K=83.35 and D=65.85, a strong bullish signal with %K well above %D, suggesting further immediate upside potential. The MACD is also painting a positive picture, with positive momentum and the MACD line above its signal line. This confluence of bullish signals from Stochastic and MACD, against a backdrop of a neutral trend strength, creates a fascinating dynamic. The Bollinger Bands are also showing the price above the middle band, supporting the bullish inclination, but the upper band's proximity means any significant upward push could quickly lead to overextension.
On the 1-day timeframe, the narrative shifts slightly. The trend is again neutral with 50% strength, but the ADX drops to 27.02, indicating a less robust trend compared to the 4-hour chart. The RSI(14) is at 60.05, still in neutral territory but showing a continued upward push. What's particularly noteworthy here is the Stochastic oscillator, with K=82.86 and D=63.25, presenting a strong bullish signal where %K is significantly higher than %D, pushing into overbought territory. The MACD continues to display positive momentum, and Bollinger Bands are showing the price pushing above the middle band with an upward tendency. However, the lower ADX value on the daily chart suggests that the strength observed on the 4-hour chart might be more short-lived or less sustainable over a longer period. This divergence in trend strength between timeframes - strong on 4H, weaker on 1D - is a key point of analysis for traders trying to gauge the longevity of the current move. The overall signal across all observed timeframes leans towards 'BUY' (8 buys, 0 sells, 0 neutral on 4H; 7 buys, 1 sell, 0 neutral on 1D), but the nuances in RSI and ADX across these charts demand a careful approach.
The Dollar's Shadow: DXY and its Influence on XAGUSD
The price action in silver cannot be viewed in isolation. Its correlation with the US Dollar Index (DXY) is a fundamental aspect of its movement, especially in the current market environment. The DXY is currently trading around 99.58, showing a daily change of -0.36%. On the 1-hour chart, the DXY exhibits a neutral trend with 50% strength, an ADX of 37.69 indicating a strong downward trend, and RSI at 36.17, pointing to further downside potential. The MACD is negative, and Bollinger Bands are below the middle band, reinforcing the bearish short-term outlook for the dollar. This weakening dollar environment typically provides a tailwind for precious metals like silver. As the dollar loses value, it becomes cheaper for holders of other currencies, increasing demand and, consequently, its price. Conversely, a stronger dollar tends to put pressure on commodities priced in dollars, as they become more expensive for international buyers.
Looking at the 4-hour timeframe for the DXY, the trend remains neutral with 50% strength, but the ADX at 28.46 suggests a strong downward trend is still in play. The RSI is at 36.95, continuing the bearish narrative, while the MACD shows positive momentum, which is somewhat contradictory but could indicate a potential shift. The Stochastic oscillator, with K=40.87 and D=72.29, provides a clear bearish signal (%K
Economic Catalysts on the Horizon: NFP and Beyond
The market's current indecision, as reflected in the neutral trend strengths across various timeframes for XAGUSD, is largely attributable to anticipation of key economic data. The most significant event looming is the US Non-Farm Payrolls (NFP) report. Historically, this data point has been a major driver of currency and commodity markets, influencing central bank policy expectations. The provided market context indicates that the US economy unexpectedly lost 23,000 jobs in July, a stark contrast to the projected increase of 83,000. This negative payroll figure, coupled with the unemployment rate holding steady at 4.2%, has already sent shockwaves, causing the dollar to weaken and gold prices to surge above $4,300. The implications for silver are substantial. A weaker-than-expected jobs report typically reduces the likelihood of aggressive interest rate hikes by the Federal Reserve. This, in turn, can decrease the attractiveness of dollar-denominated assets and boost demand for safe-haven assets like silver, especially when coupled with geopolitical risks.
The immediate reaction to the negative NFP data has been a clear boost for precious metals. Gold prices breaking above $4,300 is a strong indicator of this sentiment. For XAGUSD, this could translate into renewed upward pressure, potentially pushing it beyond the current resistance at $63.55. However, the context also highlights rising geopolitical risks, including the Hormuz crisis and US-China tensions. These factors add a layer of complexity, as they can independently drive demand for safe-haven assets, creating a dual support for silver. The market's response to the NFP data has been to price in lower odds of a September rate hike from the Fed, which is a significant shift. This fundamental shift in expectations is likely to be a primary driver for XAGUSD in the short to medium term. The challenge for traders now is to discern whether this move is a sustainable trend or a knee-jerk reaction to a single data point, especially as other indicators on the 4-hour chart suggest a strong trend, while daily indicators show less conviction.
Key Levels and Potential Scenarios for XAGUSD
With XAGUSD currently trading at $63.55, the immediate price action is dictated by the interplay between key support and resistance levels. On the 1-hour chart, immediate support is identified at $63.14, followed by $63.00 and $62.88. Resistance is observed at $63.40, $63.51, and crucially, $63.65. A decisive break above $63.65 would be a significant bullish signal, potentially opening the door for further gains. On the 4-hour chart, the support levels are more distant: $63.96, $63.24, and $62.67. Resistance is seen at $65.26, $65.83, and $66.56. The daily chart places support at $60.60, $59.71, and $58.57, with resistance levels at $62.63, $63.77, and $64.66. The $63.65 resistance level on the 1-hour chart aligns closely with the daily resistance at $63.77, making this area a critical zone to watch.
Considering the mixed signals from technical indicators and the significant economic event risk, several scenarios are plausible. The bullish case hinges on a sustained push above the immediate resistance at $63.65, potentially fueled by continued dollar weakness and strong safe-haven demand. If XAGUSD can decisively clear this level, the next targets would be the 4-hour resistance at $65.26 and then $65.83. However, the overbought readings on the Stochastic and RSI on higher timeframes suggest that such a move might face headwinds or require consolidation. The bearish scenario would be triggered if XAGUSD fails to break above $63.65 and instead pulls back, testing the immediate support at $63.14. A break below this level could see a move towards the 4-hour support at $62.67, and potentially lower towards the daily support at $60.60. The neutral scenario involves price action consolidating between the current resistance at $63.65 and the support at $63.14, particularly if the upcoming economic data provides a mixed picture or fails to offer a clear direction. This consolidation phase would allow indicators to cool off from their current levels, setting the stage for a more decisive move later.
Bearish Scenario: Resistance Holds Firm
40% ProbabilityBullish Scenario: Breakout Beyond $63.65
45% ProbabilityNeutral Scenario: Consolidation Phase
15% ProbabilityThe Broader Economic Picture: Inflation, Rates, and Geopolitics
The recent economic data, particularly the surprisingly negative US Non-Farm Payrolls report, has significantly altered the market's perception of future Federal Reserve policy. With jobs unexpectedly shedding, the odds of a September rate hike have diminished considerably. This shift is a potent catalyst for precious metals. Lower interest rates, or even the prospect of rates holding steady for longer, reduce the opportunity cost of holding non-yielding assets like silver. Furthermore, the weakening dollar, as evidenced by the DXY's current bearish trend, provides a secondary layer of support. The geopolitical tensions, including the ongoing situation in the Strait of Hormuz and broader US-China relations, also contribute to a 'risk-off' sentiment that often benefits safe-haven assets. This complex web of factors - economic weakness, dovish central bank expectations, a weaker dollar, and geopolitical uncertainty - creates a supportive environment for silver, even as some technical indicators hint at overextension.
The narrative around inflation also plays a crucial role. While the negative jobs report might suggest cooling demand, other inflationary pressures could still be at play. The Brent crude oil price, currently at $81.31 and showing a daily drop of 1.3%, is a key indicator of energy costs, which feed into broader inflation metrics. Although oil has seen a slight pullback, any resurgence in energy prices due to geopolitical events could reignite inflation concerns, further bolstering the case for precious metals as an inflation hedge. The market will be closely watching upcoming economic releases, such as Consumer Price Index (CPI) and Producer Price Index (PPI) data, to gauge the true state of inflation. If inflation remains stubbornly high despite weak employment, the Federal Reserve could find itself in a difficult position, potentially leading to increased volatility across all asset classes, including XAGUSD.
Weighing the Signals: A Balanced Perspective
The current technical setup for XAGUSD presents a classic case of conflicting signals that demands careful interpretation. On one hand, the 4-hour and 1-day charts show strong bullish momentum, with MACD and Stochastic oscillators pointing towards further upside. The ADX readings on these timeframes suggest a robust trend is in motion. The positive correlation with gold, which has surged above $4,300, also adds conviction to the bullish argument. The recent US jobs report significantly weakens the case for immediate Fed rate hikes, providing a fundamental tailwind. However, on the other hand, the RSI is approaching overbought territory on both the 4-hour and daily charts, and the ADX strength on the daily timeframe is notably weaker than on the 4-hour. The price is currently testing significant resistance around the $63.65 level, a break of which is needed for sustained upward momentum. The DXY's bearish trend offers support, but any unexpected shift in its direction could quickly challenge silver's gains. This creates a scenario where caution is paramount. Traders should not blindly follow the bullish signals without acknowledging the risks of overextension and potential pullbacks. The price action around the $63.65 resistance level will be critical in determining the next short-term direction.
The market is at a crossroads, where the immediate technical picture is somewhat stretched, yet the fundamental backdrop - weakening dollar, dovish rate expectations, and geopolitical risk - remains supportive. This is a typical environment for increased volatility. The key for traders will be to observe how XAGUSD behaves around the $63.65 resistance. A clean break and hold above this level, perhaps confirmed by a slight pullback and retest, would validate the bullish scenario. Conversely, a rejection from this resistance, coupled with a break below the $63.14 support, would signal a potential reversal or at least a deeper correction. The upcoming economic data releases will likely be the catalyst that forces a resolution to this current indecision. Until then, managing risk and looking for clear confirmation signals will be essential for navigating these choppy waters.
Frequently Asked Questions: XAGUSD Analysis
What happens if XAGUSD breaks above the $63.65 resistance level?
A sustained break above $63.65, especially if confirmed by strong volume and followed by a successful retest of this level as support, would likely trigger further upside. The next key resistance levels to watch would be $65.26 and $65.83 on the 4-hour chart. This scenario is supported by continued dollar weakness and positive safe-haven flows.
Should I consider buying XAGUSD at current levels around $63.55 given the RSI at 65.46?
Buying at current levels requires caution due to the RSI approaching overbought territory on the 4-hour chart. While the overall trend signals are bullish, waiting for a pullback to a support level like $63.14 or confirmation of a breakout above $63.65 would offer a better risk-reward ratio. The current price is testing significant resistance.
Is the ADX at 34.5 on the 4-hour chart a strong buy signal for XAGUSD?
An ADX of 34.5 indicates a strong trend, which is generally bullish given the overall positive momentum. However, it's crucial to interpret this in conjunction with other indicators. The RSI nearing overbought levels and the Stochastic's strong bullish signal suggest the trend has momentum, but the daily ADX is weaker at 27.02, implying less conviction over longer periods.
How will the recent negative US jobs report impact XAGUSD this week?
The unexpectedly weak US jobs report has already weakened the dollar and boosted gold, suggesting a positive impact for XAGUSD. This data reduces the likelihood of imminent Fed rate hikes, which typically supports precious metals. We could see continued upward pressure on XAGUSD if this sentiment persists and safe-haven demand remains elevated.
| Indicator | Value | Signal | Interpretation |
|---|---|---|---|
| RSI (14) | 60.05 | Neutral | Approaching overbought on daily, suggests upward momentum continues but with caution. |
| MACD | Positive Momentum | Bullish | MACD line above signal line, indicating positive momentum. |
| Stochastic | K=82.86, D=63.25 | Bullish | Strong bullish signal with %K well above %D, moving into overbought territory on daily. |
| ADX | 27.02 | Neutral Trend | Indicates a trend is present but not yet overwhelmingly strong on the daily timeframe. |
| Bollinger | Upper Band | Watch | Price trading above the middle band, indicating bullish bias, but near upper band suggests potential resistance. |
Track markets in real-time
AI-powered analysis, technical indicators and real-time price data.
Join Our Telegram Channel
Breaking market news, AI analysis and trading signals instantly.
Join Channel