
S&P 500 Tests Key $6,572.87 Level: Bulls vs. Bears Debate Intensifies
The S&P 500 hovers around $6,572.87, with RSI at 67.3 signaling overbought pressure. A critical resistance at $6,605 is in focus.
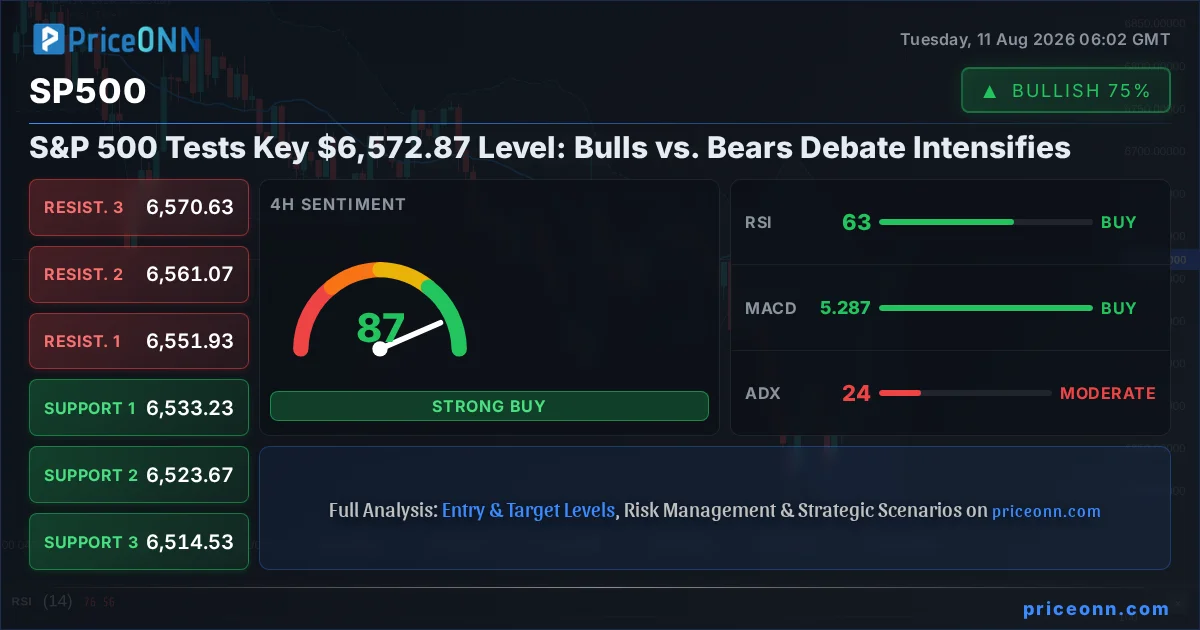
The S&P 500 is currently locked in a tense tug-of-war, trading precariously close to a pivotal resistance level at $6,572.87. This isn't just another trading day; it's a crucial juncture where the market's sentiment, driven by a complex interplay of technical signals, macroeconomic undertones, and geopolitical whispers, will likely determine the next significant move. With the Dollar Index (DXY) showing signs of life and oil prices nudging higher, the broader market context adds layers of complexity to the S&P 500's immediate trajectory. This analysis dives deep into the conflicting forces at play, dissecting the bull and bear arguments to map out potential pathways forward.
- With RSI at 67.3, overbought pressure is building, suggesting caution for further upside.
- The critical resistance level for the S&P 500 is $6,605.07, a break above which could signal continued strength.
- MACD histogram shows negative momentum, indicating that bullish momentum might be fading despite the upward trend.
- The correlation with DXY at 99.82 suggests that a strengthening dollar could put pressure on US equities.
The battleground is set around the $6,572.87 mark for the S&P 500. This price point is more than just a number; it represents a critical psychological and technical barrier. On the 4-hour chart, the ADX at 24.23 indicates a moderately trending market, but the confluence of a 62.83 RSI and a Stochastic reading in the upper reaches of the overbought territory (97.85 K, 86.96 D) paints a picture of an index that is showing signs of fatigue. While the overall trend on the daily chart is technically neutral, the strong ADX of 47.51 on the same timeframe suggests that any moves, up or down, could be significant. This divergence between timeframes and indicators creates a fascinating scenario, forcing traders to weigh conflicting signals and prepare for a potentially decisive price action.
On the bullish side, the narrative is supported by the persistent strength seen in the 1-hour and 4-hour charts. The 1-hour trend strength is a robust 100%, with price action comfortably above the middle Bollinger Band, indicating upward momentum. The MACD on the 1-hour chart is showing positive momentum, and the Stochastic oscillator, while not extreme, is in a favorable position for continuation. Furthermore, the daily RSI at 45.35, while not overtly bullish, suggests there's still room for upward movement before hitting overbought conditions on that longer timeframe. The fact that the S&P 500 has managed to push towards resistance, despite broader market concerns, speaks to the underlying resilience of equity markets, possibly fueled by strong corporate earnings reports that have dominated headlines recently. The Nasdaq 100, trading at 29,681.01, also shows a generally positive, albeit mixed, sentiment on shorter timeframes, reinforcing the idea that tech heavyweights continue to drive market sentiment.
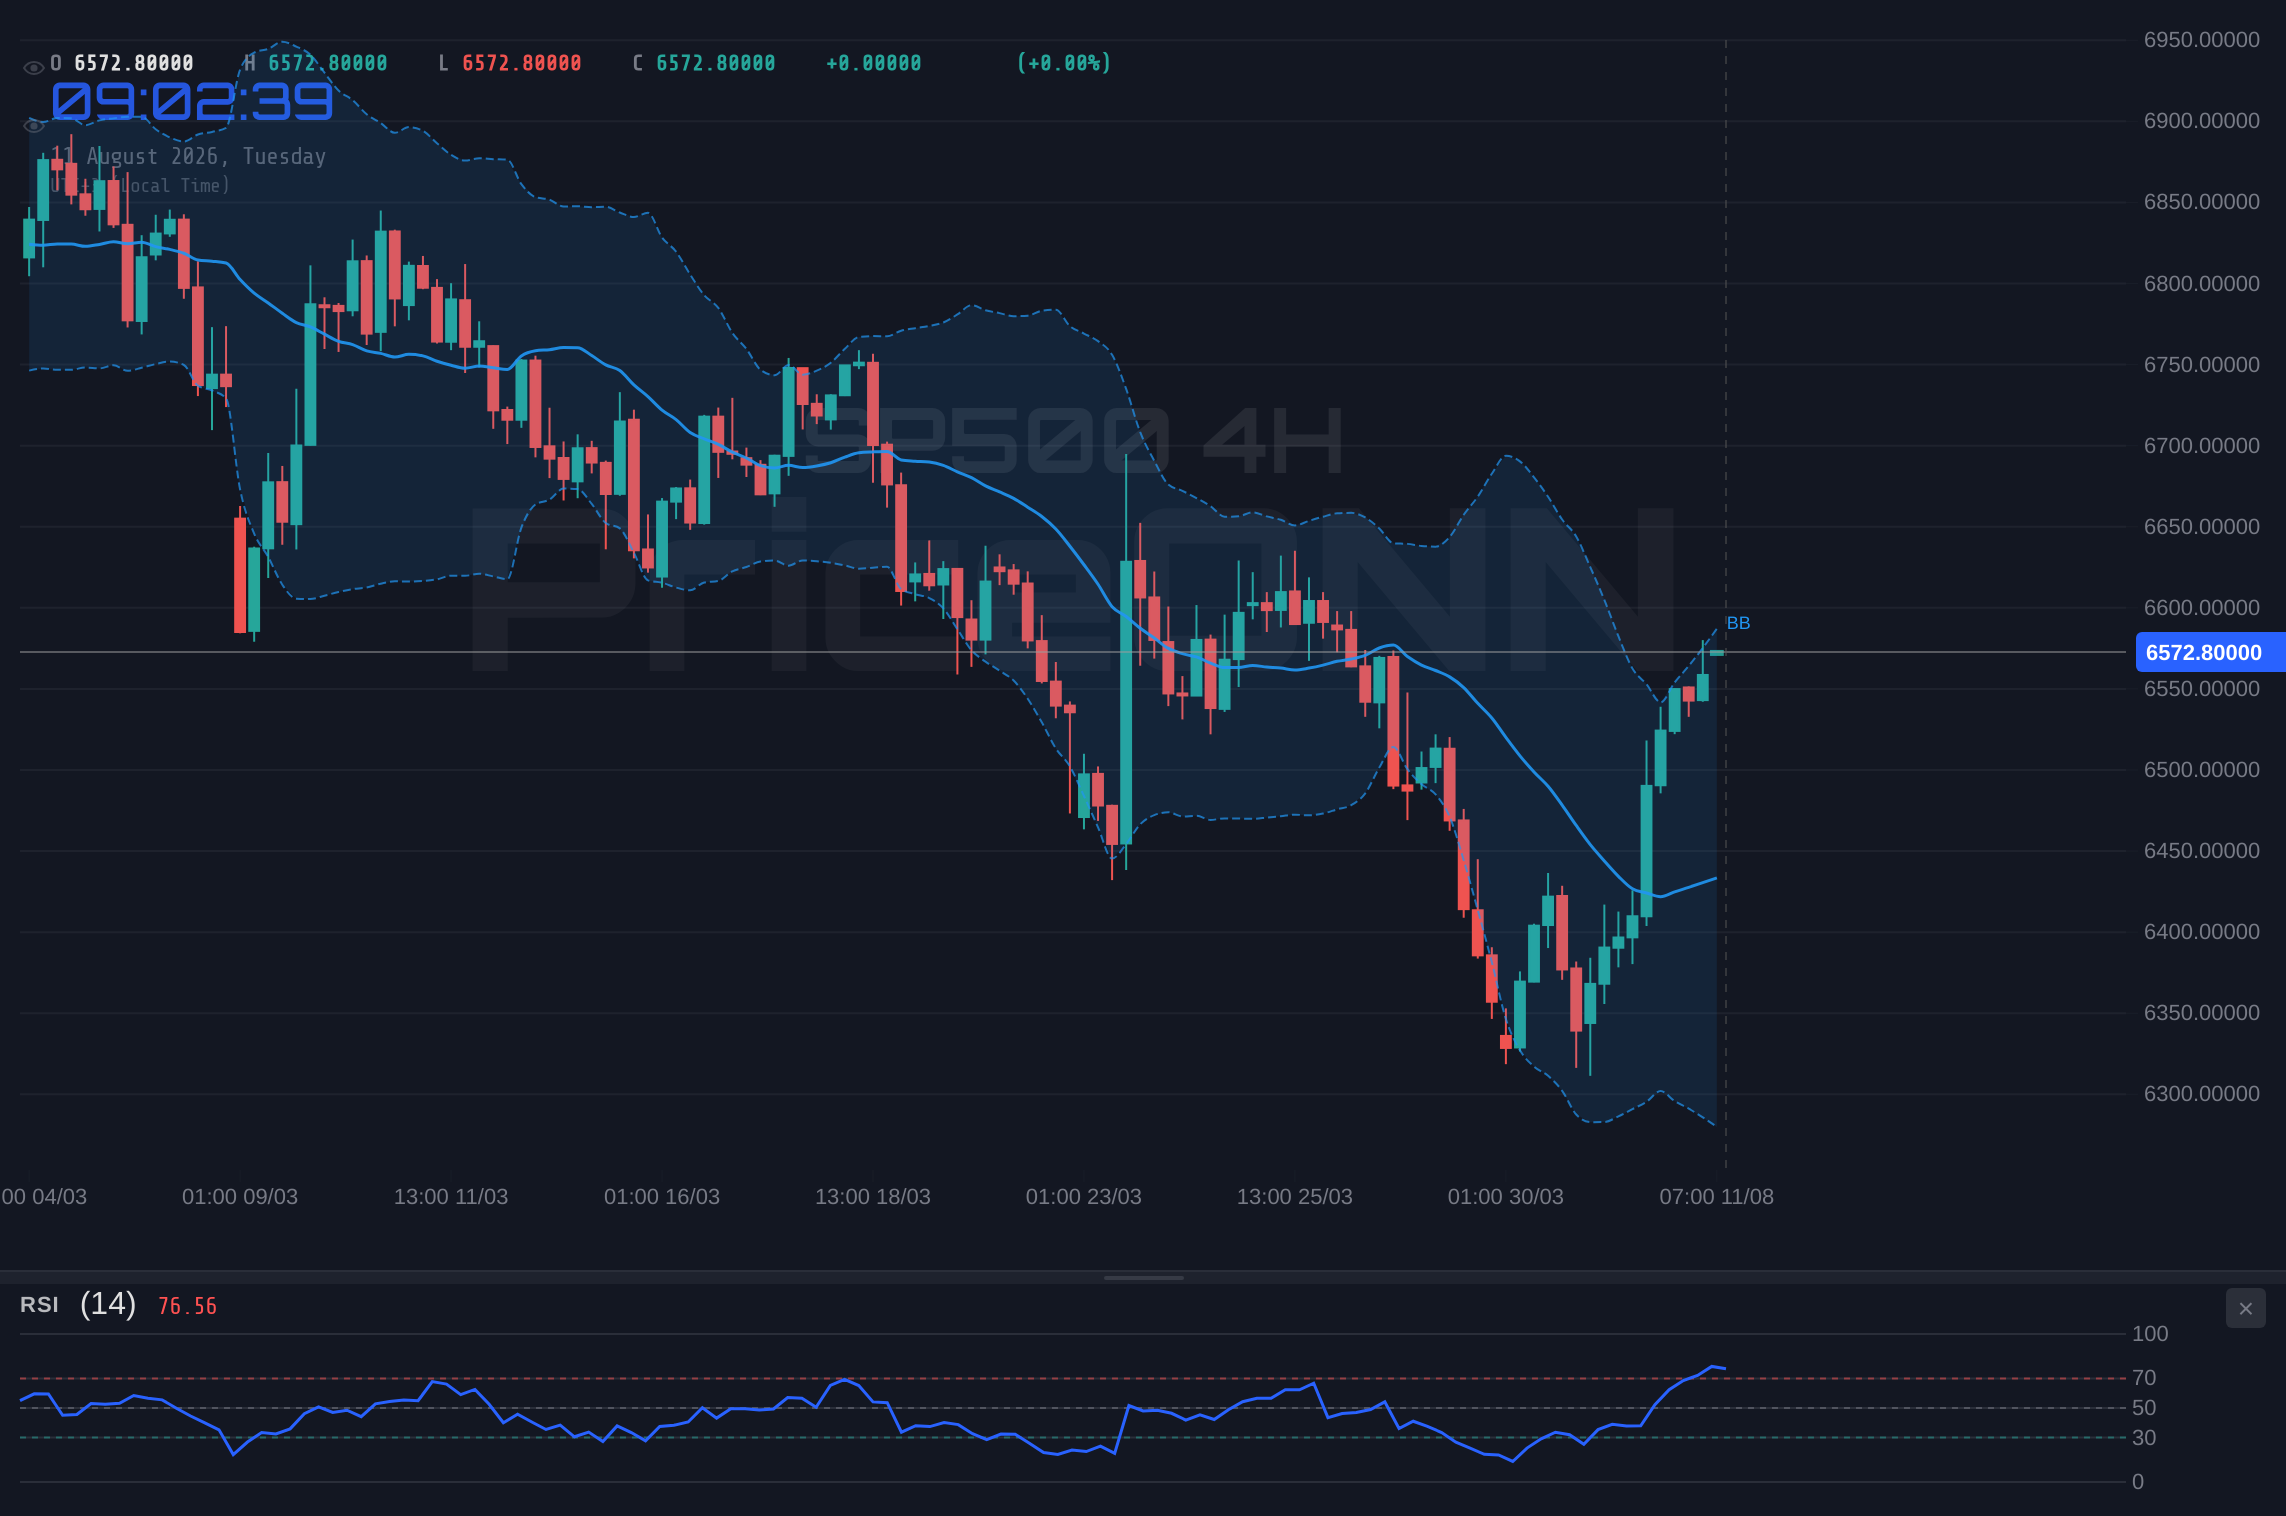
However, the bear case cannot be ignored. The daily chart presents a stark warning: an ADX of 47.51 signifies a strong downward trend, and the RSI at 45.35 suggests that momentum is leaning towards the downside, despite the recent price action. The MACD histogram on the daily chart is also negative, reinforcing this cautionary signal. The DXY, currently at 99.82, is showing a strong downward trend on its daily chart (ADX 29.13), which typically correlates with a risk-off environment, potentially pressuring US equities like the S&P 500. While recent news has highlighted strength in specific sectors like AI-related stocks, the broader economic outlook, including inflation concerns and central bank policy expectations, remains a significant overhang. The fact that Brent crude is trading at $86.66 and WTI at $83.48, both showing upward momentum, could also signal rising inflation expectations, which might prompt a more hawkish stance from central banks, thus acting as a headwind for stocks.
The correlation with other markets is particularly telling. The Dollar Index (DXY) is currently showing a daily downtrend with an ADX of 29.13, which, in a typical risk-off scenario, would be supportive of gold and potentially other safe havens. Gold itself is trading at $4,373.55, and while its 1-hour and 4-hour indicators show a bullish trend, the daily chart is neutral, suggesting a potential pause or consolidation. If the DXY were to reverse its downtrend and move higher, it would likely add significant pressure to the S&P 500, especially given the current resistance levels. Conversely, if the DXY continues its slide, it could fuel further risk appetite, potentially propelling the S&P 500 higher, but this would need to overcome the bearish signals on the daily chart.
Looking at the broader economic calendar, events like the upcoming CPI data, even if not explicitly listed in the provided snippet, are always critical. Traders are keenly watching any hints about inflation trends, as this directly impacts central bank policy. A hotter-than-expected inflation reading could spook markets and reinforce the bear case for equities, while a cooler print might support the bullish outlook. The recent news flow, mentioning the U.S.-Japan intervention and its impact on USD/JPY, also underscores the sensitivity of markets to currency movements and central bank actions. While not directly impacting the S&P 500, such events highlight a global environment of policy intervention and intervention, which can spill over into broader risk sentiment.
The technical indicators on the S&P 500 present a mixed but leaning bearish picture on the daily timeframe, which is crucial for longer-term outlooks. The RSI at 45.35 indicates room for decline, and the MACD's negative momentum is a clear warning. The ADX at 47.51 reinforces the idea that if a downtrend begins, it could be strong. The Stochastic's higher K value (42.97) compared to D (29.88) on the daily chart is a bullish signal in isolation, but it contradicts the broader bearish leaning of other daily indicators. This is where careful interpretation is key: the Stochastic might be showing a short-term bounce within a larger potential downtrend, or it could be a false signal ahead of a significant move.
On the shorter timeframes, however, the picture is more constructive. The 1-hour chart shows a strong bullish trend (ADX 49.72) with price above the middle Bollinger Band and positive MACD momentum. The RSI at 70.95 is in overbought territory, which on this timeframe could suggest a continuation of the upward move before a potential pullback. The Stochastic K value of 65.73, while high, is below the D value of 73.5, suggesting a potential short-term dip or consolidation rather than an immediate reversal. This short-term strength is what bulls are latching onto, hoping it can overcome the longer-term bearish signals. The Nasdaq 100's short-term strength, despite its own mixed signals, also lends some support to this view.
The 4-hour timeframe offers a middle ground. The trend is neutral, but the ADX at 24.23 indicates a moderate trend strength. The RSI at 62.83 is in the neutral zone, leaning towards bullish, and the MACD is positive. However, the Stochastic is flashing an overbought warning with K at 97.85 and D at 86.96. This suggests that while the upward momentum has been strong, the index is nearing a point where profit-taking could emerge. The key resistance levels on the 4-hour chart are $6,551.93, $6,561.07, and $6,570.63, with the immediate price sitting just above the highest of these. The next significant hurdle is clearly marked at $6,605.07.
Considering the current price of $6,572.87 and the immediate resistance at $6,568.73 (1H) and $6,570.63 (4H), a break above these levels would be the first sign that the bulls are gaining traction. The ultimate test, however, lies at $6,605.07. If the S&P 500 can decisively break and hold above this level, it would invalidate the short-term bearish signals and could open the door for a move towards higher resistance levels. The ADX on the 1-hour chart at 49.72 supports the idea of a strong move if a breakout occurs. This is the level where many traders will be watching for confirmation – a close above $6,605.07 on a significant volume would likely trigger further buying interest.
Conversely, failure to break $6,605.07 and a subsequent move below the immediate support levels like $6,551.93 (4H) would validate the bearish sentiment seen on the daily chart. The support levels to watch on the daily chart are $6,377.47, $6,230.63, and $6,149.87. A break below the recent lows, especially if accompanied by a spike in the DXY and a flight to safety, could signal a more significant correction. The strong ADX of 47.51 on the daily chart means that if sellers take control, the move could be swift and substantial, potentially targeting those lower support levels quite rapidly. The current consolidation around $6,572.87 is a critical phase, and the direction of the break will likely set the tone for the coming days or even weeks.
The overall market sentiment is currently leaning towards caution, despite the intraday strength. The conflicting signals across different timeframes and indicators highlight a market at a crossroads. The bulls have managed to push the price towards resistance, but the bearish undertones on the daily chart, coupled with potential headwinds from a strengthening dollar or rising inflation expectations, make further upside uncertain. The bears, on the other hand, are waiting for a clear signal of weakness, a failure at resistance, or a macroeconomic catalyst to drive prices lower. The upcoming economic data releases will be crucial in tipping the scales. Traders should exercise discipline, manage risk diligently, and wait for clear confirmation before committing to a directional trade.
The current price action around $6,572.87 is a classic example of market indecision where short-term momentum clashes with longer-term trends. While the 1-hour and 4-hour charts show potential for further upside, the daily chart's bearish leanings and the ADX of 47.51 cannot be ignored. The key will be how the index reacts to the $6,605.07 resistance. A decisive breakout could signal a continuation of the bullish trend, while a rejection here might usher in a period of consolidation or a more significant pullback. Given the mixed signals and the critical level being tested, a neutral stance or waiting for clearer confirmation seems prudent for now. Patience will be key as the market decides its next direction.
Bearish Scenario: Resistance Holds Firm
60% ProbabilityNeutral Scenario: Consolidation Phase
25% ProbabilityBullish Scenario: Breakout Confirmation
15% ProbabilityFrequently Asked Questions: S&P 500 Analysis
What happens if the S&P 500 fails to break above $6,605.07 resistance?
If the S&P 500 fails to decisively break above the $6,605.07 resistance level, it could lead to a bearish scenario. This might trigger a pullback towards the 4-hour support at $6,533.23, especially if the DXY strengthens or negative economic data emerges.
Should I buy SP500 at current levels of $6,572.87 given RSI at 67.3?
Buying at $6,572.87 with an RSI of 67.3 presents a moderate risk. While the shorter timeframes show bullish momentum, the daily RSI at 45.35 and the strong ADX of 47.51 suggest caution. A high-probability entry would ideally wait for a confirmed breakout above $6,605.07 or a pullback to a stronger support level.
Is the MACD histogram showing negative momentum a sell signal for SP500 right now?
The negative MACD histogram on the daily chart, coupled with an ADX of 47.51, indicates bearish momentum is building on the longer timeframe. While shorter timeframes show positive MACD, this divergence suggests that the current uptrend might be losing steam and could be vulnerable to a reversal if key support levels break.
How will the Fed's stance on inflation affect SP500 this week?
Any indication from the Fed regarding inflation persistence could significantly impact the S&P 500. If inflation data suggests a need for continued hawkishness, it could pressure the index lower, validating the bearish scenario. Conversely, signs of cooling inflation might support a dovish pivot, potentially fueling a breakout above resistance.
Technical Outlook Summary
| Indicator | Value | Signal | Interpretation |
|---|---|---|---|
| RSI (14) | 45.35 | Bearish | Daily RSI indicates room for decline. |
| MACD Histogram | -0.38 | Bearish | Negative momentum on the daily chart. |
| Stochastic | K=42.97, D=29.88 | Bullish Crossover | Daily Stochastic shows a bullish crossover but contradicts other daily signals. |
| ADX | 47.51 | Strong Downtrend | Daily ADX indicates a very strong trend, currently leaning bearish. |
| Bollinger Bands | Price below Middle Band | Bearish | On daily chart, price is below the middle band. |
Track markets in real-time
AI-powered analysis, technical indicators and real-time price data.
Join Our Telegram Channel
Breaking market news, AI analysis and trading signals instantly.
Join Channel