

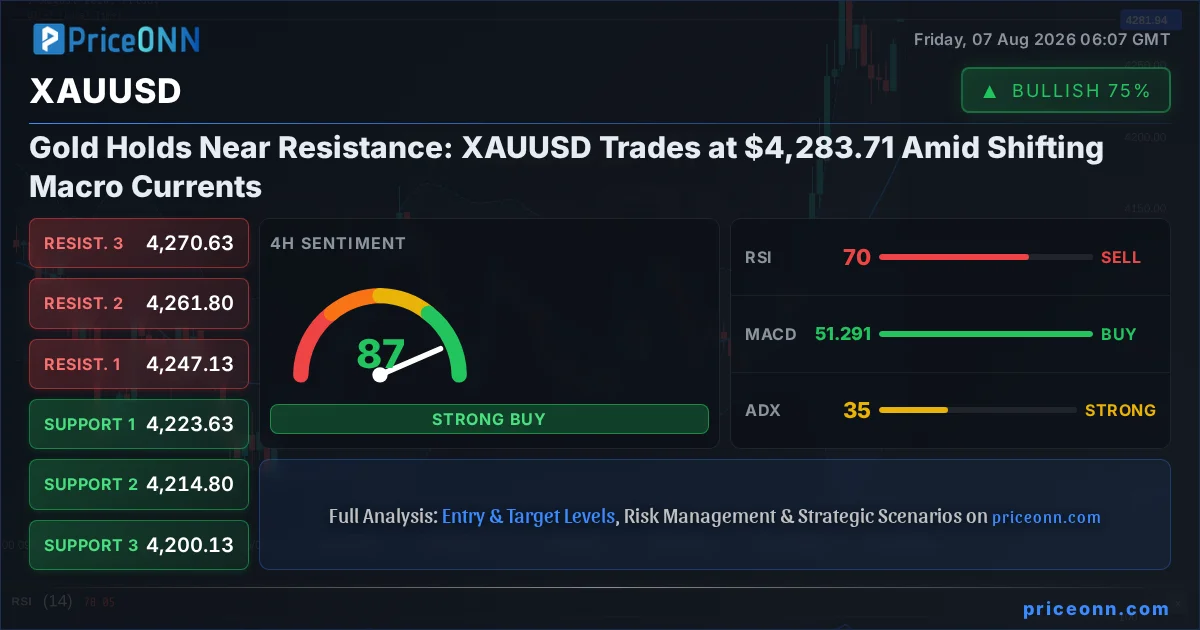
Now this is where it gets interesting! Gold, or XAUUSD as we traders call it, has been carving out a fascinating path, currently testing the crucial resistance zone right around the $4,283.71 mark. This isn't just another day at the office; we're witnessing a confluence of technical signals and macroeconomic undercurrents that are painting a complex, yet potentially rewarding, picture for those watching the yellow metal closely. The bulls have certainly been pushing, but the question on everyone's mind is whether this upward momentum has the legs to break through, or if we're heading for a pullback. Understanding the interplay between gold's price action, the Dollar Index (DXY), and broader market sentiment is key to navigating this volatile environment.
- XAUUSD is currently trading at $4,283.71, hovering near significant resistance levels.
- The 1-hour RSI at 61.75 suggests a neutral stance with a slight upward bias, while the 4-hour RSI at 70.1 indicates overbought conditions potentially leading to profit-taking.
- The Dollar Index (DXY) is at 99.99, showing a neutral-to-bullish trend on lower timeframes but a bearish signal on the daily, creating complex correlation dynamics.
- Upcoming economic data releases, particularly employment figures and central bank policy cues, will be critical in determining the next directional move for gold.
Having tracked XAUUSD through the recent market gyrations, it's clear that the price action is becoming increasingly sensitive to both technical levels and macroeconomic shifts. The current price of $4,283.71 is not just a number; it represents a battleground where buyers and sellers are locked in a critical tug-of-war. On the 1-hour chart, the trend strength is a robust 92% in favor of the bulls, supported by an RSI of 61.75 and a MACD showing positive momentum. However, looking at the 4-hour timeframe, the RSI climbs to 70.1, signaling overbought territory, and Stochastic indicates a potential pullback with %K below %D. This divergence across timeframes is a classic sign of market indecision, where short-term optimism clashes with medium-term caution.
Navigating the Technical Landscape: A Multi-Timeframe Perspective
The Shifting Sands of Short-Term Momentum
On the immediate 1-hour chart, gold is presenting a decidedly bullish face. The trend is strongly upwards with 92% strength, and the general signal across multiple indicators leans towards a 'BUY'. RSI at 61.75, while in neutral territory, clearly favors the ascent. The MACD is comfortably above its signal line, and even the Stochastic oscillator, with %K at a strong 96.43, is shouting 'buy'. This paints a picture of immediate upward pressure. However, this short-term strength needs to be viewed within the broader context. The ADX reading of 23.43, while indicating a trend, suggests it's of medium strength. This means that while the current direction is up, the underlying conviction might not be ironclad, leaving room for quick reversals if sentiment shifts.
The 4-Hour Cautionary Tale: Overbought Signals Emerge
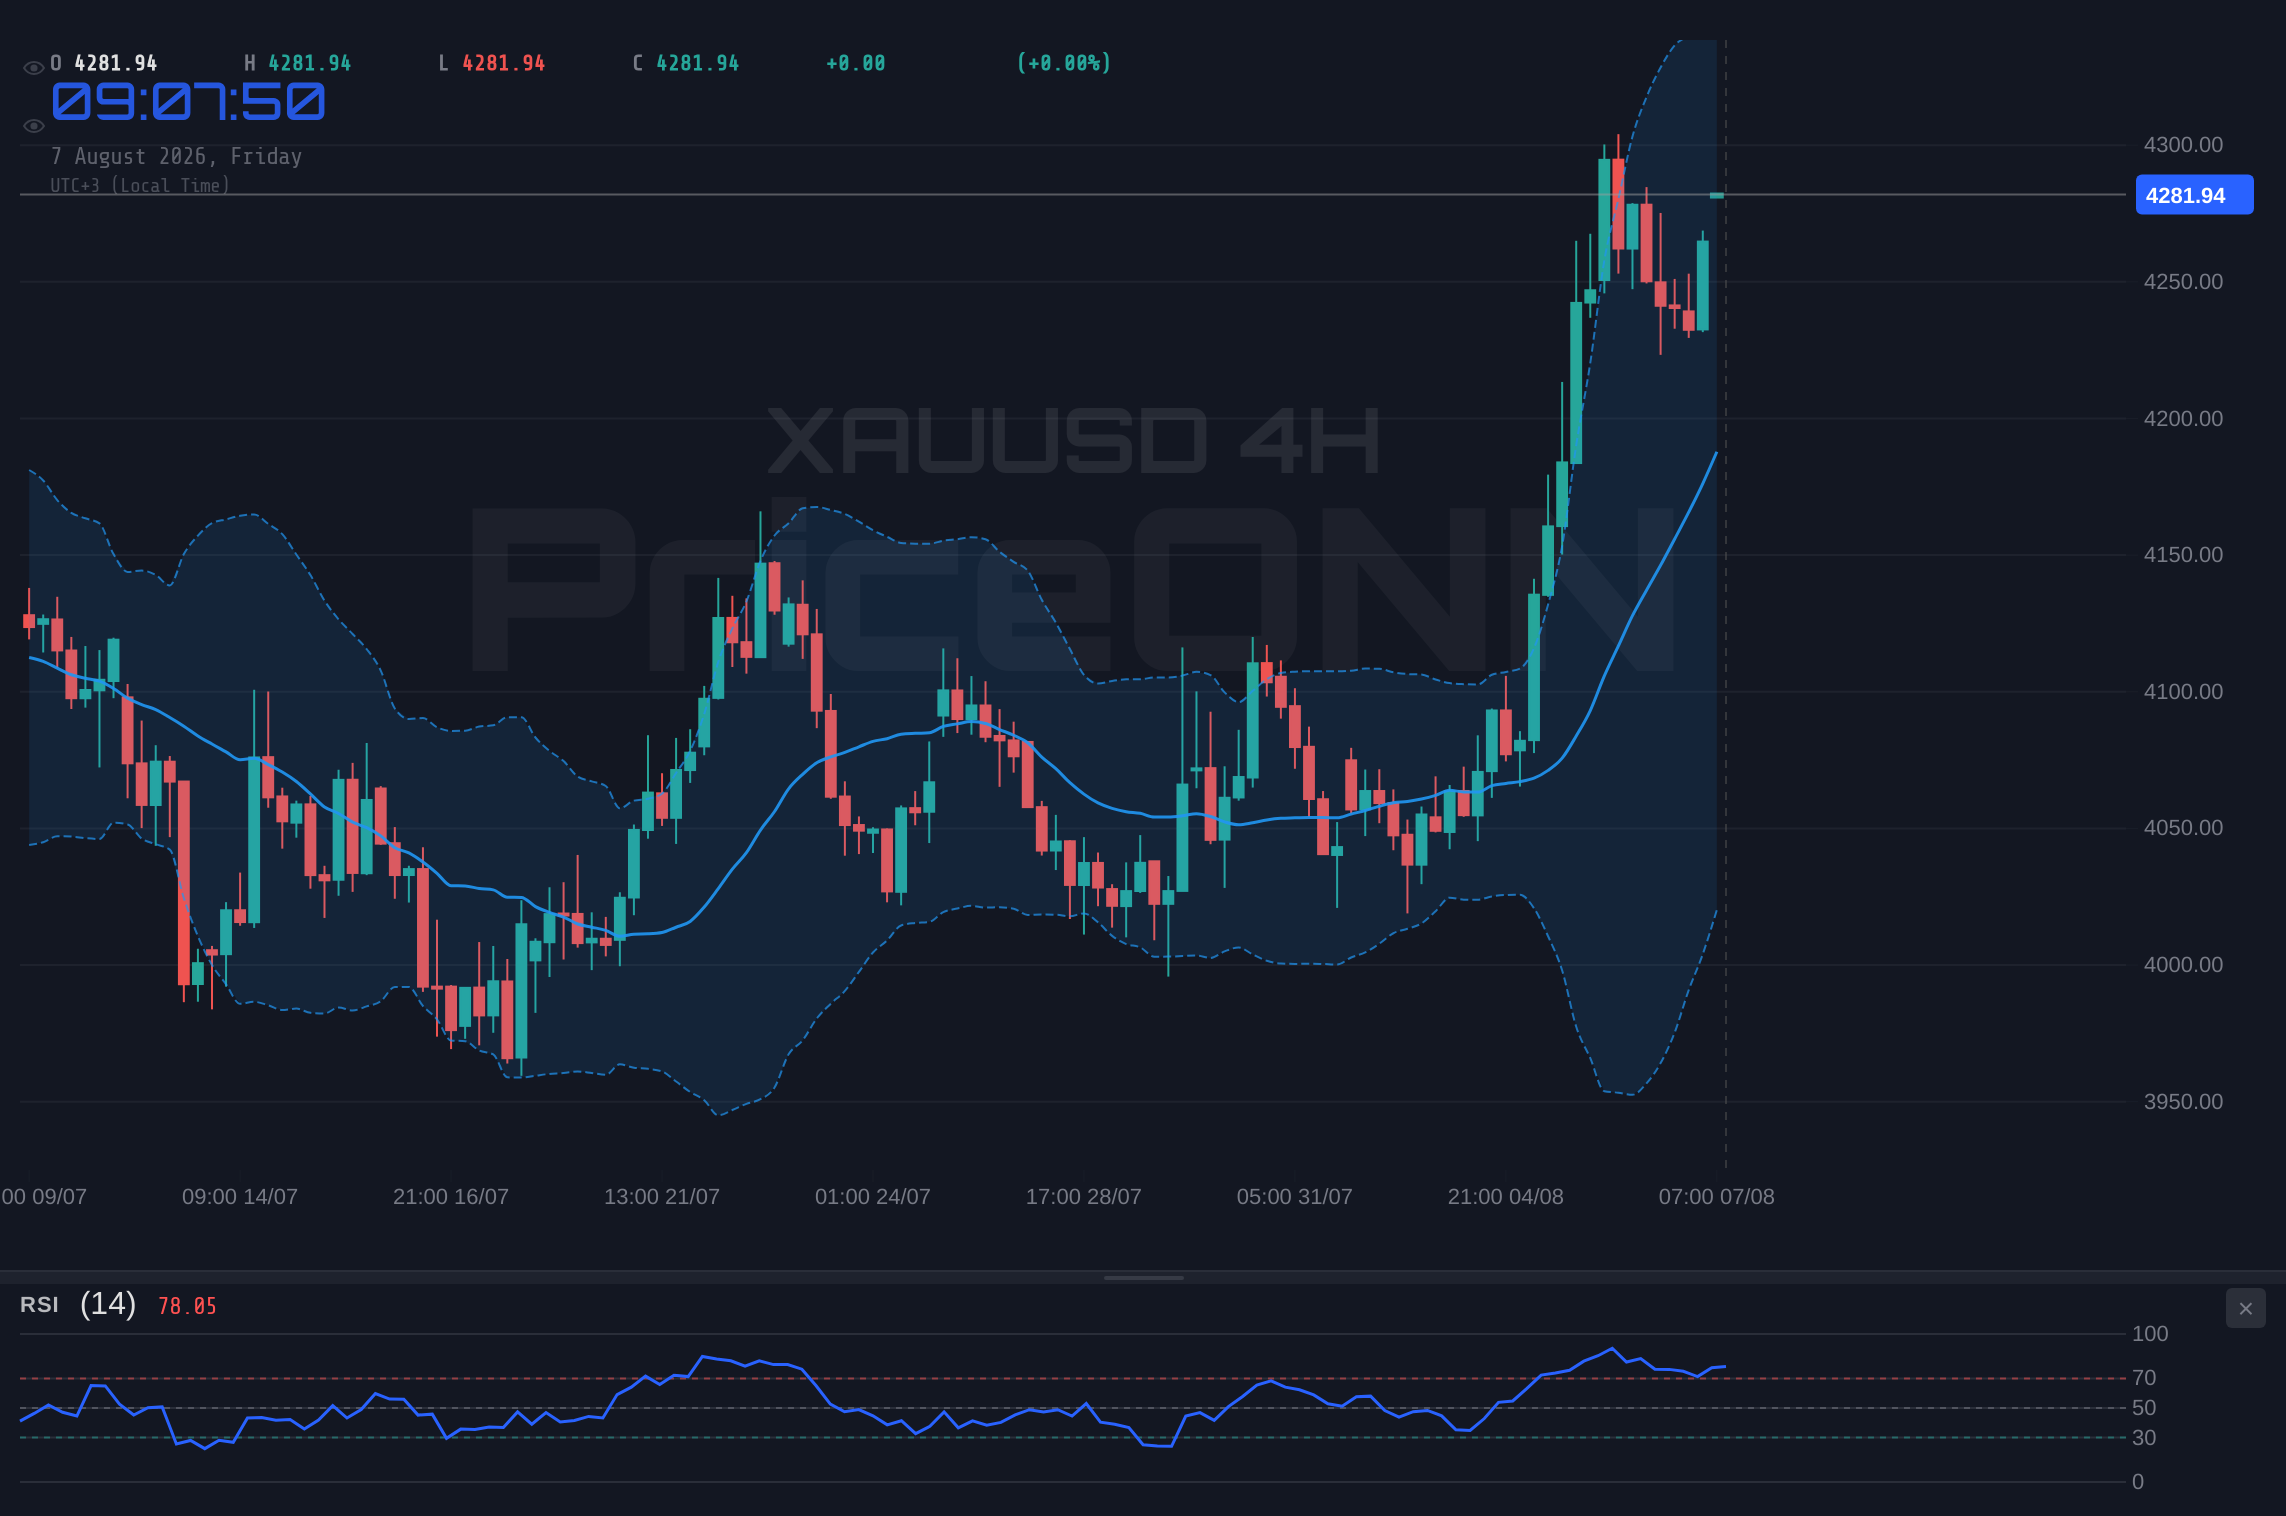
Stepping back to the 4-hour chart, the narrative begins to shift. Here, the trend is still bullish with an impressive 98% strength, but the indicators are flashing warning signs. The RSI has surged to 70.1, firmly within the overbought zone. This is a critical level where traders often start to anticipate profit-taking or a potential reversal. While the MACD continues to show positive momentum, the Stochastic oscillator presents a clear bearish signal, with %K dipping below %D. Furthermore, the ADX here is higher at 35.51, indicating a strong trend, but when combined with the overbought RSI, it suggests the trend might be reaching an unsustainable peak. This is precisely the kind of conflicting signal that demands careful observation; the immediate push higher might be losing steam.
The Daily Chart: A Neutral Ground with Underlying Strength
The daily timeframe offers a more balanced perspective. Here, the trend is classified as 'Neutral' with 50% strength, reflecting a period of consolidation or indecision after recent moves. Support levels are clearly defined at 4207.78, 4175.16, and 4127.03, while resistance lies at 4288.53, 4336.66, and 4369.28. The RSI at 62.55 is back in neutral territory, leaning slightly upwards, which is less concerning than the 4-hour's overbought reading. MACD remains positive, and the Stochastic is also signaling a buy, with %K above %D. Crucially, the ADX at 26.43 still points to a strong trend, which, when viewed on the daily, suggests that the overall upward bias might be intact despite short-term overbought conditions on lower timeframes. This daily view offers a glimmer of hope for the bulls, indicating that the underlying structure might still support further gains if key resistance can be breached.
The divergence between the 1-hour's bullish momentum and the 4-hour's overbought RSI is a critical point. It suggests that while intraday traders might be pushing prices higher, a broader pause or correction could be imminent if $4,288.53 resistance isn't decisively broken soon.
Macroeconomic Undercurrents: The Dollar, Inflation, and Central Bank Whispers
The Dollar Index's Delicate Dance
No analysis of gold is complete without a deep dive into the Dollar Index (DXY). Currently trading at 99.99, the DXY presents a mixed picture across different timeframes. On the 1-hour and 4-hour charts, it shows a neutral-to-bullish trend, with positive momentum and a general 'BUY' signal. This suggests the dollar is finding some footing, which typically puts pressure on gold. However, the daily chart paints a different story: a bearish trend with negative MACD momentum and an RSI at 40.45, leaning towards oversold conditions. This conflict means the dollar's direction is far from certain. If the DXY strengthens significantly, it will act as a headwind for XAUUSD, potentially capping any upside. Conversely, a sustained weakness in the dollar, especially if it breaks below key daily support levels, could provide a significant tailwind for gold, pushing it towards higher resistance.
Inflationary Pressures and the Safe-Haven Appeal
Gold's role as an inflation hedge remains a primary driver. While specific inflation data like CPI or PCE isn't provided in the live feed, the general market context often hints at underlying pressures. Brent crude oil trading at $82.16 and WTI at $78.95, both showing signs of upward trend strength on shorter timeframes, suggest that energy prices, a key component of inflation, are holding firm or even rising. This persistent inflationary environment naturally boosts gold's appeal as a safe-haven asset. Investors tend to flock to gold when they fear that fiat currencies are losing purchasing power. The fact that XAUUSD has managed to hold its ground and even push higher, despite potential dollar strength on lower timeframes, underscores this underlying demand driven by inflation concerns.
Central Bank Rhetoric and Market Expectations
While no specific central bank meeting minutes or statements are provided in the live data, the market is always anticipating future policy moves. The general consensus often revolves around interest rate expectations. If the Federal Reserve (and other major central banks) signals a hawkish stance – suggesting higher-for-longer interest rates to combat inflation – this typically strengthens the dollar and makes non-yielding assets like gold less attractive. Conversely, any hint of a dovish pivot, such as an indication that rate hikes are nearing their end or that cuts could be on the horizon, tends to weaken the dollar and boost gold prices. Traders are constantly dissecting every piece of economic data, from employment reports to PMI surveys, for clues about the future path of monetary policy. The upcoming US jobs report, mentioned in the breaking news, will be a crucial data point in shaping these expectations.
The current price action for XAUUSD at $4,283.71 is occurring against a backdrop where the DXY shows conflicting signals across timeframes. This ambiguity means that gold's correlation with the dollar might be less predictable than usual, making fundamental drivers like inflation expectations and central bank policy even more critical.
Trading Scenarios: What Lies Ahead for Gold?
Given the current technical picture and macroeconomic backdrop, several scenarios could unfold for XAUUSD. The $4,283.71 level is pivotal. A decisive break above the immediate resistance at $4,277.06, and more importantly, above the daily resistance at $4,288.53, could signal a continuation of the bullish trend. This would likely be fueled by positive economic data, dovish central bank commentary, or a significant weakening of the US dollar. Such a move would target higher resistance levels, potentially drawing in more buyers looking to capitalize on the upward momentum. The strength of the trend on the daily chart (ADX at 26.43) supports this possibility, suggesting that once a breakout occurs, it could be sustained.
Conversely, failure to break through the $4,288.53 resistance could lead to a retest of the support levels. The overbought conditions on the 4-hour RSI (70.1) and the bearish Stochastic signal on the same timeframe are key indicators that a pullback is a very real possibility. If key support levels like $4,260.58 or $4,223.63 were to break, it would likely trigger further selling pressure as stop-loss orders are hit and short-sellers enter the market. This bearish scenario would be exacerbated by strong dollar performance or hawkish signals from the Fed. It's crucial to remember that gold has tested resistance multiple times, and a failure to break through could lead to a more significant correction.
A neutral or consolidation scenario is also highly probable, especially leading up to significant economic data releases. Market participants might adopt a 'wait-and-see' approach, keeping XAUUSD trading within a defined range. In this scenario, gold could hover around the current $4,283.71 level, consolidating its recent gains while awaiting clearer direction from upcoming news events. This period of consolidation often occurs when conflicting signals abound – bullish short-term momentum versus bearish medium-term indicators, or a mixed macroeconomic outlook. Traders would need to watch for clear breakouts from the established range, either above resistance or below support, to signal the next directional move.
Bearish Scenario: Resistance Holds Firm
60% ProbabilityBullish Scenario: Breakout Confirmation
30% ProbabilityConsolidation Scenario: Waiting Game
10% ProbabilityActionable Insights for Today's Trader
The Critical Juncture at $4,283.71
For the intraday trader, the immediate focus remains on the $4,283.71 price point and the immediate resistance at $4,277.06. A failure to push decisively higher from here, especially with the 4-hour RSI nearing overbought territory, suggests caution. Scalpers might look for short-term opportunities on pullbacks towards the 1-hour support at $4,260.58, anticipating a bounce. However, swing traders will be keenly watching the daily close. A daily close above $4,288.53 would be a significant bullish signal, potentially opening the door for further upside towards $4,336.66. Conversely, a daily close below the $4,260.58 support level would invalidate the bullish short-term trend and suggest a deeper correction is underway.
The interplay with the DXY is also paramount. With the DXY currently at 99.99 and showing mixed signals, any clear directional move in the dollar index will likely have a pronounced impact on gold. If the DXY breaks decisively above 100.05, it could put significant pressure on XAUUSD. Conversely, a break below 99.93 on the DXY could provide the catalyst needed for gold to push through its resistance. Traders should be prepared for increased volatility around upcoming economic data, particularly the US jobs report, which could provide the fundamental catalyst needed to break the current stalemate.
Ultimately, patience appears to be the most rewarding strategy right now. While the short-term trend is bullish, the conflicting signals on lower timeframes and the proximity to key daily resistance at $4,288.53 warrant a measured approach. Waiting for confirmation of a breakout above resistance, or a clear breakdown below support, will be crucial for higher-probability trades. The market is giving us signals; the art lies in interpreting them correctly and acting only when the risk/reward setup is clearly in our favor. Manage your risk, wait for your setup - the market always gives a second chance.
Frequently Asked Questions: XAUUSD Analysis
What happens if XAUUSD breaks above the $4,288.53 daily resistance level?
A sustained break above $4,288.53 on strong volume, especially with positive economic data or dovish central bank cues, would signal a continuation of the bullish trend. This could target the next resistance at $4,336.66, drawing in more buyers.
Is the RSI at 70.1 on the 4-hour chart a sell signal for XAUUSD right now?
An RSI of 70.1 on the 4-hour chart indicates overbought conditions, suggesting that the current upward move may be losing steam and a pullback or consolidation is likely. While not an immediate sell signal, it warrants caution and suggests that further significant gains might be limited without a pause.
How will the upcoming US jobs report affect XAUUSD trading this week?
A stronger-than-expected jobs report could strengthen the dollar (DXY) and put downward pressure on gold, potentially leading to a test of support levels around $4,223.63. Conversely, a weaker report might weaken the dollar, providing a catalyst for gold to break through resistance near $4,288.53.
Should I buy XAUUSD at current levels around $4,283.71 given the mixed technical signals?
Buying at current levels carries risk due to conflicting signals across timeframes and proximity to resistance. A more prudent approach would be to wait for confirmation: either a decisive breakout above $4,288.53 or a clear breakdown below support at $4,260.58, offering a better risk/reward ratio.
Track markets in real-time
AI-powered analysis, technical indicators and real-time price data.
Join Our Telegram Channel
Breaking market news, AI analysis and trading signals instantly.
Join Channel