

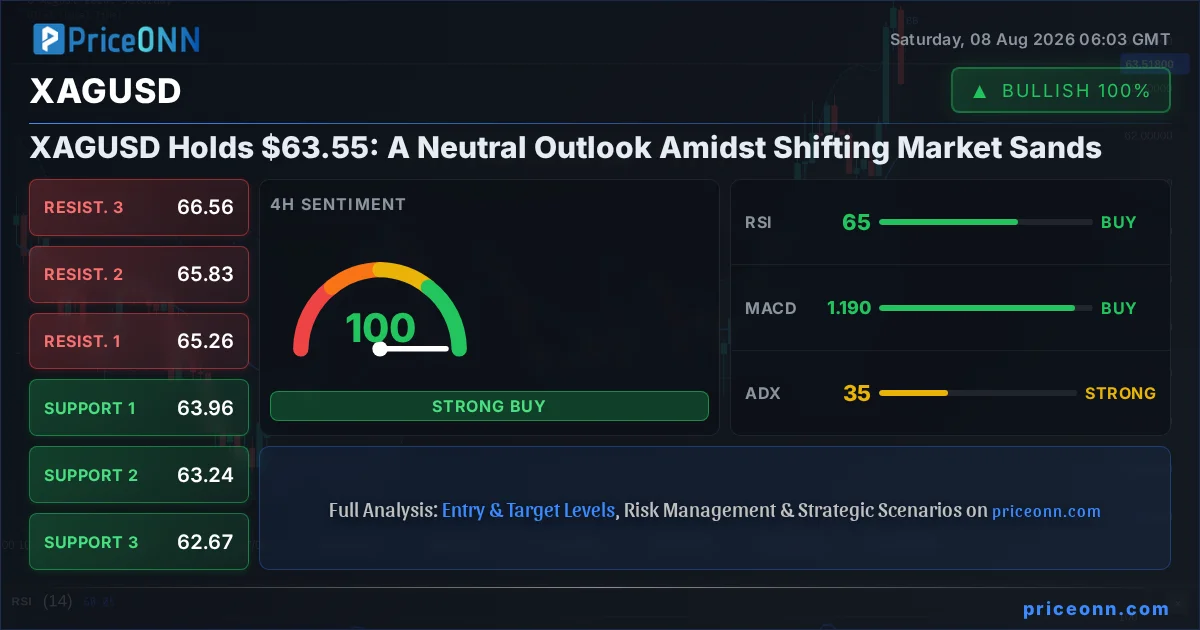
The tug-of-war for silver's direction is intensifying, with XAGUSD currently finding itself locked in a battle around the critical $63.55 mark. Last Friday's close saw the white metal trading precisely at this level, a point that has become a focal point for both bullish aspirations and bearish retrenchments. As we step into the new trading week, the market sentiment surrounding silver is best described as neutral, a delicate balance poised precariously between conflicting technical indicators and the anticipation of significant macroeconomic data releases. The past week was a period of consolidation, punctuated by a sharp, albeit brief, surge following weaker-than-expected US jobs data, which initially sent gold prices soaring above $4,300. However, the optimism was tempered by ongoing geopolitical tensions and a reassessment of central bank policy expectations. This nuanced environment demands a deep dive into the charts and the underlying drivers to understand where silver might be headed next.
- The RSI at 60.05 on the daily chart signals neutral momentum, indicating neither strong overbought nor oversold conditions, but a leaning towards bullish sentiment.
- Critical support for XAGUSD sits at $63.14 (1H) and $60.60 (1D), levels that have shown resilience but could trigger significant downside if breached.
- The ADX at 34.85 on the 1H chart and 40.51 on the 4H chart indicates strong trending conditions, but the conflicting signals from other indicators suggest a potential pause or reversal.
- The US economy shedding 23,000 jobs in July, as reported on August 7th, initially boosted precious metals, but the market is now digesting the implications for future Federal Reserve policy and the DXY's reaction.
The narrative for silver this past week has been one of cautious optimism tempered by significant data-driven volatility. The Non-Farm Payrolls (NFP) report released on August 7th, revealing an unexpected loss of 23,000 jobs, sent shockwaves through the financial markets. This data point, starkly contrasting with the projected increase of 83,000, immediately fueled speculation that the Federal Reserve might be compelled to reconsider its hawkish stance on interest rates. For precious metals, this was a clear signal for a short-term rally. Gold prices surged, and silver followed suit, temporarily breaking above the $65.00 level on some charts. However, the momentum proved difficult to sustain. The initial euphoria surrounding a potentially less aggressive Fed was quickly overshadowed by the broader context of geopolitical risks and the inherent strength of the US Dollar Index (DXY), which, despite a slight dip following the NFP data, remains a formidable force in global currency markets. The market's reaction highlights the complex interplay between employment figures, central bank policy expectations, and the persistent demand for safe-haven assets.
Looking at the 1-hour timeframe for XAGUSD, the technical landscape presents a mixed picture, reflecting the current market indecision. The trend is officially neutral, with a power rating of 50%, suggesting that neither buyers nor sellers have a firm grip. Support levels are identified at $63.14, $63.00, and $62.88, providing potential floors for price action. Conversely, resistance is clustered around $63.40, $63.51, and $63.65, with the current price of $63.55 hovering just below the immediate ceiling. The Relative Strength Index (RSI) at 56.97 resides in neutral territory, leaning towards bullish momentum, which is a positive sign for the bulls. However, the Moving Average Convergence Divergence (MACD) indicator is showing negative momentum, with the MACD line below its signal line, suggesting a potential pullback. The Stochastic Oscillator, with K at 16.9 and D at 21.62, is flashing a bearish signal as %K
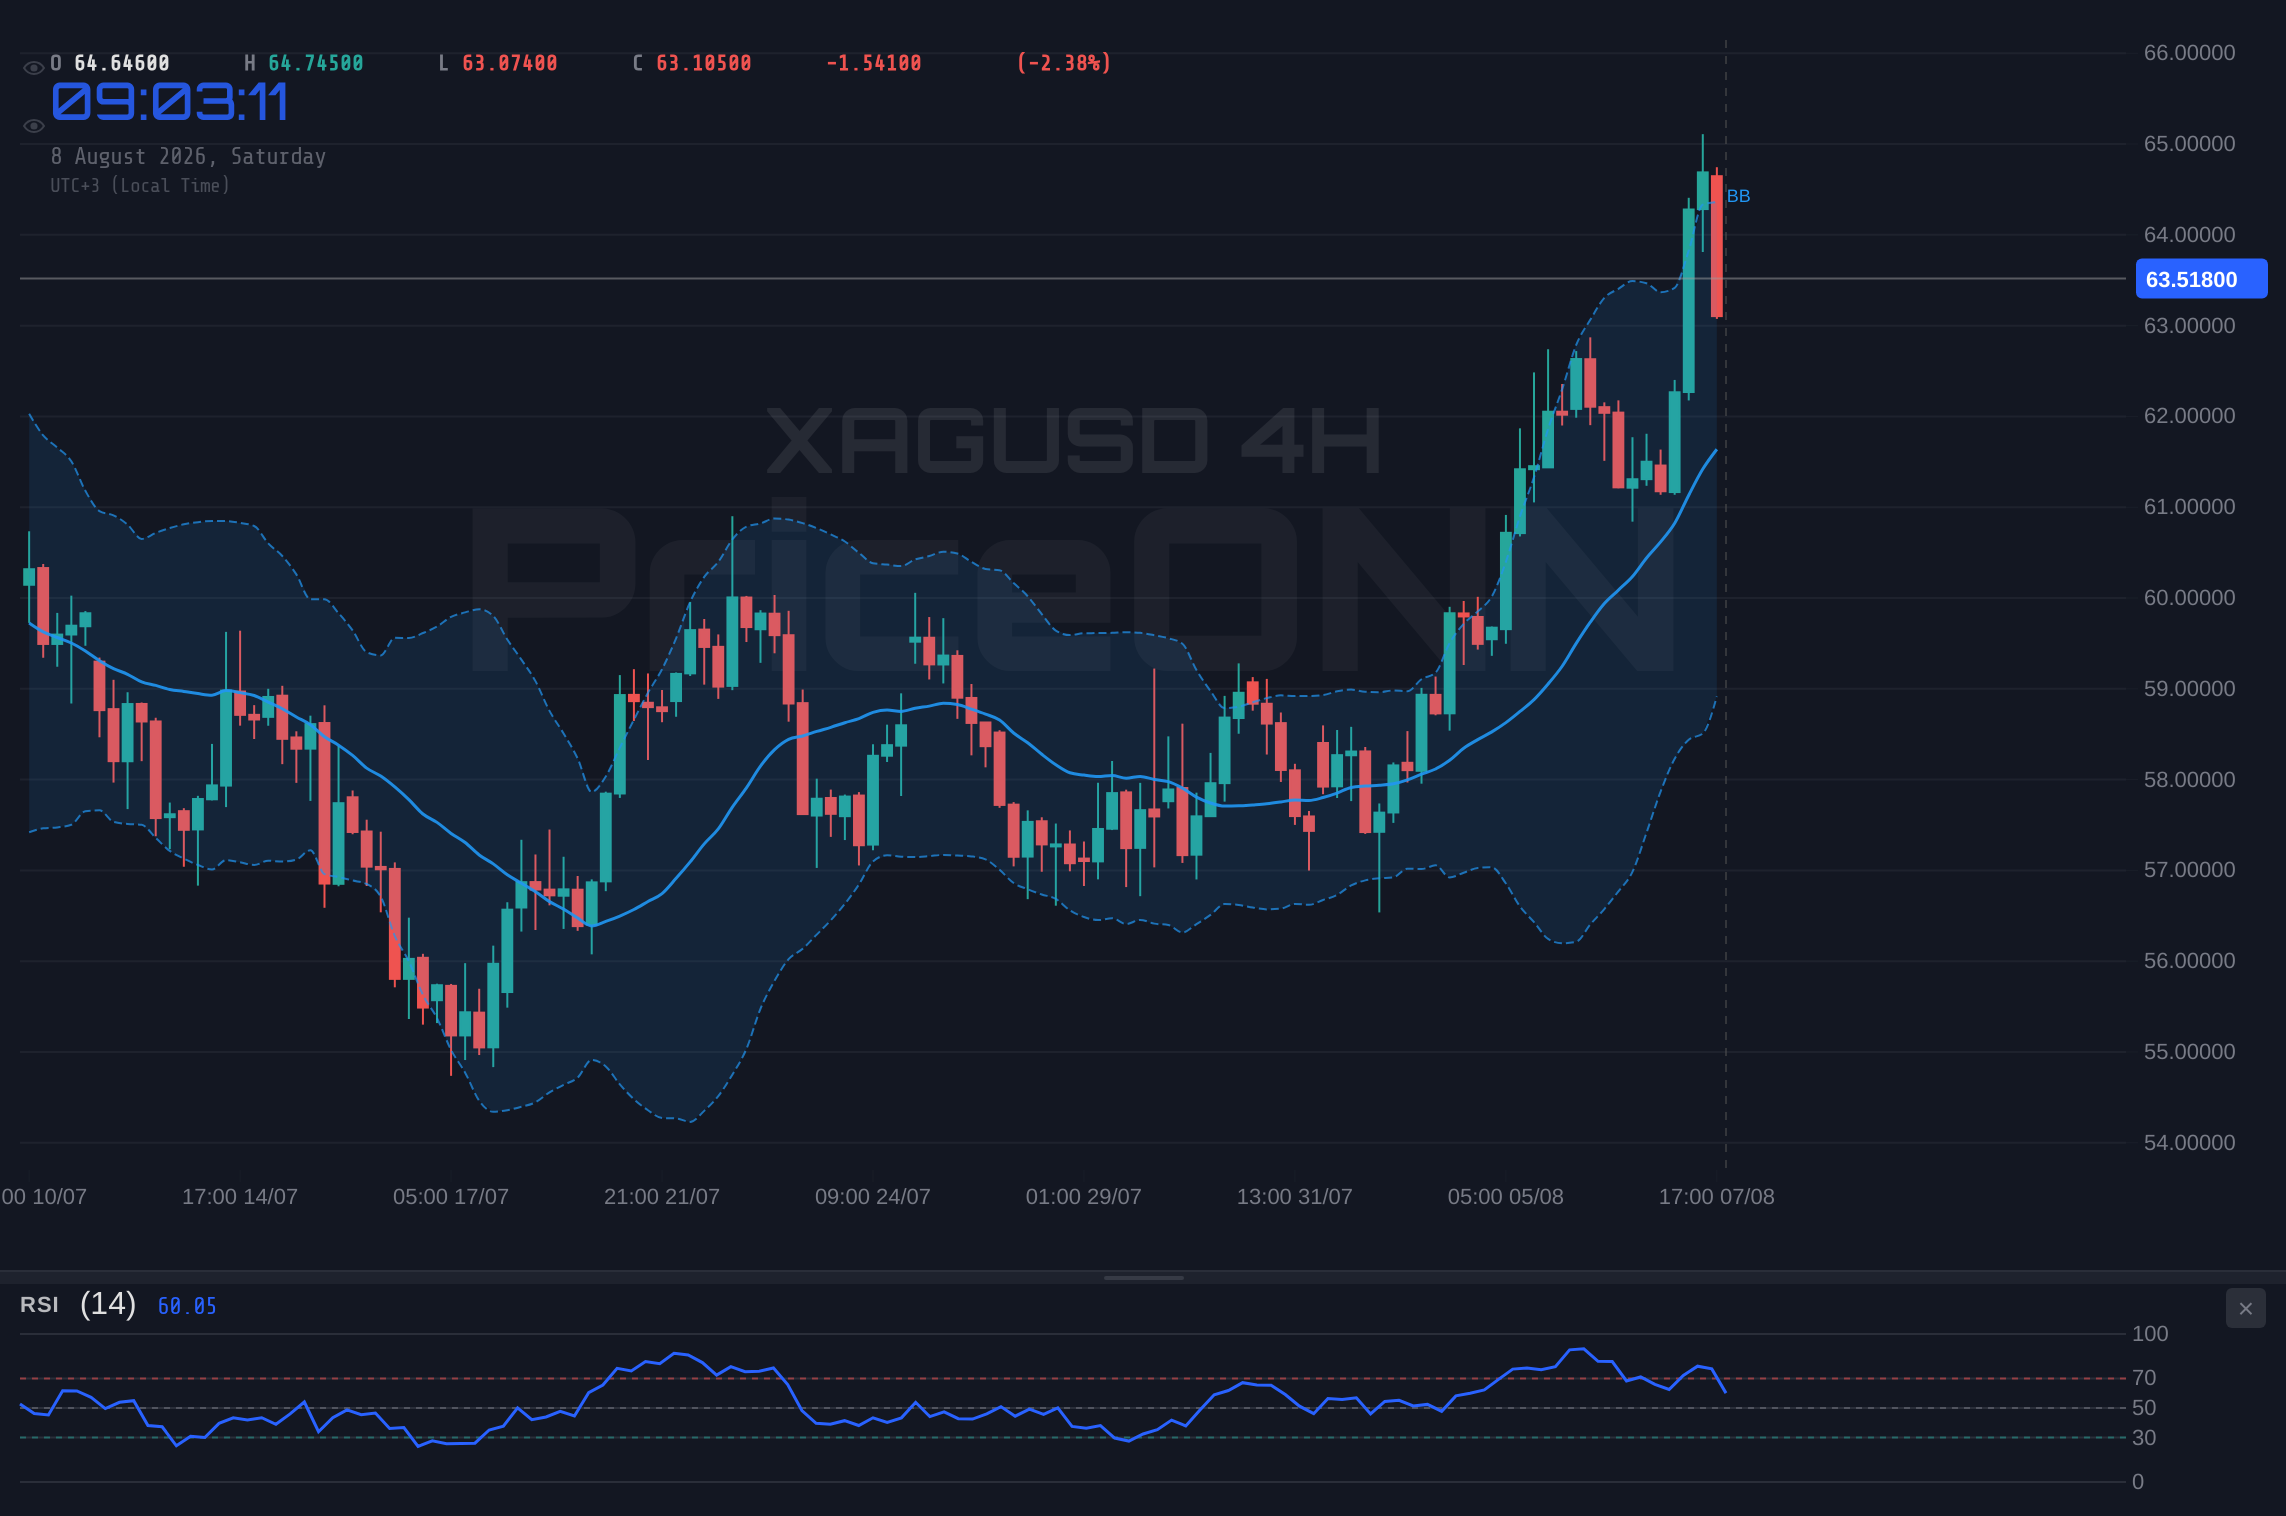
The 4-hour chart offers a slightly more defined, yet still complex, view of XAGUSD's technical posture. Here, the trend is also categorized as neutral, with a 50% power rating, but the indicators paint a more consistently bullish picture than the 1-hour chart. Support is found at $63.96, $63.24, and $62.67, while resistance looms at $65.26, $65.83, and $66.56. The RSI at 65.46 remains in neutral territory but shows a clear upward inclination, suggesting further upside potential before reaching overbought conditions. The MACD indicator here is positive, with the MACD line above its signal line, reinforcing the bullish sentiment. The Stochastic Oscillator shows K at 83.35 and D at 55.51, a strong bullish signal with %K significantly above %D, indicating strong upward momentum that could push prices higher. The ADX, at 34.5, continues to point towards a strong trend, aligning with the bullish leanings of the MACD and Stochastic. The overall signal on the 4-hour timeframe leans towards BUY (8 buys, 0 sells, 0 neutral), suggesting that if the short-term noise from the 1-hour chart can be overcome, the path of least resistance might be upwards. This timeframe provides a more optimistic outlook, but the proximity to resistance levels and the broader market uncertainties cannot be ignored.
Shifting to the daily timeframe, the picture for XAGUSD becomes even more nuanced, highlighting the challenges in charting a definitive course. The trend is once again classified as neutral, with a 50% power rating, reflecting the indecisiveness that has characterized silver's recent price action. Support levels are situated at $60.60, $59.71, and $58.57, representing significant psychological and technical barriers that have previously held firm. Resistance, on the other hand, is identified at $62.63, $63.77, and $64.66. The RSI(14) reading of 60.05 sits comfortably in neutral territory, exhibiting a slight upward bias. The MACD indicator maintains positive momentum, with its line above the signal line, offering a bullish hint. However, the Stochastic Oscillator presents a somewhat conflicting signal: K is at 82.86 and D at 63.25, indicating a bullish crossover and strong upward momentum, yet both values are approaching or within overbought territory, suggesting caution. The ADX, at 26.58, signifies a moderately strong trend, which, when combined with the other indicators, suggests that while a trend might be forming, its conviction is not yet absolute. The overall signal leans towards BUY (7 buys, 1 sell, 0 neutral), but the confluence of neutral trend strength, potential overbought conditions in the Stochastic, and the proximity to daily resistance levels means the daily chart is a critical watchpoint for any significant shifts.
The correlation between silver and the US Dollar Index (DXY) is a perennial factor influencing its price action, and recent market events have underscored this relationship. Following the release of the weaker-than-expected US Non-Farm Payrolls (NFP) data on August 7th, the DXY experienced a moderate decline. The index, which had been consolidating around the 99.50-100.00 range, dipped to approximately 99.40. This inverse correlation is a classic market dynamic: a weaker dollar typically makes dollar-denominated commodities like silver cheaper for holders of other currencies, thus potentially increasing demand and driving prices higher. Indeed, silver saw a noticeable uptick immediately following the NFP report. However, the DXY's recovery towards 99.58 by the end of the session suggests that the dollar's underlying strength, possibly supported by ongoing geopolitical tensions and the market's recalibration of Fed rate hike probabilities for September, remains a significant factor. The fact that the DXY is still hovering near multi-month highs, despite the NFP shock, indicates underlying resilience that could cap silver's upside potential. Traders are closely watching if the DXY can reclaim the 100.00 level, which would likely exert renewed downward pressure on XAGUSD, while a sustained move below 99.00 could provide further tailwinds for the white metal.
Beyond the immediate technical signals and currency correlations, the broader economic and geopolitical landscape continues to shape the outlook for silver. The recent report indicating the US economy shed 23,000 jobs in July, as highlighted by news outlets on August 7th, has significantly altered the calculus for Federal Reserve policy. This unexpected contraction in employment has diminished the probability of a September rate hike, with market participants reassessing the Fed's trajectory. This shift in expectations provides a supportive backdrop for precious metals, which tend to benefit from lower interest rate environments. However, the global stage remains fraught with uncertainty. Heightened tensions in the Middle East, particularly concerning the Strait of Hormuz, continue to fuel safe-haven demand, benefiting gold and, by extension, silver. Furthermore, ongoing diplomatic friction between the US and China adds another layer of risk to the global economic outlook. These geopolitical factors create a persistent undercurrent of demand for assets perceived as safe havens, providing a structural bid for silver even amidst fluctuating economic data. The market's reaction to the NFP data, while initially bullish for silver, also revealed the sensitivity to any signs of economic weakening, which could paradoxically lead to calls for even lower rates or, conversely, increased safe-haven flows.
The interplay between gold (XAUUSD) and silver (XAGUSD) is another crucial element in assessing the precious metals complex. Historically, silver often follows gold's lead, but its volatility means it can also outperform gold during strong bullish phases. Currently, gold is trading around $4341.51, exhibiting a strong upward trend on the 4-hour chart (ADX 40.51) and positive momentum across multiple timeframes. The daily RSI at 65.51 is in neutral territory but trending up, while the 4-hour RSI at 72.44 is approaching overbought levels. This suggests that gold itself is in a robust uptrend, but potentially nearing a point where consolidation or a minor pullback could occur. Silver, trading at $63.55, shows a similar bullish leaning on the 4-hour chart (ADX 34.5), but with more mixed signals on the shorter timeframes. The fact that silver has underperformed gold slightly in percentage terms over the last 24 hours (XAGUSD +3.34%, XAUUSD +2.38%) could suggest that while the overall sentiment is positive for precious metals, gold is currently leading the charge with more conviction. If gold continues its ascent and breaks through significant resistance levels, silver would likely follow, potentially with greater percentage gains due to its higher beta. Conversely, if gold falters or begins to consolidate, silver could be more susceptible to a pullback, especially given its mixed short-term indicators.
The current price action around $63.55 for XAGUSD presents a classic 'bull vs bear' scenario, and understanding the arguments for each side is crucial for navigating this market. On the bullish side, the fundamental backdrop is supportive. The weaker NFP data has diminished near-term rate hike expectations, which is typically positive for non-yielding assets like silver. Geopolitical risks continue to provide a bid for safe-haven assets. Technically, the 4-hour and daily charts show a bullish bias, with positive MACD momentum and strong ADX readings indicating trending conditions. The Stochastic Oscillator on the 4-hour chart is strongly bullish. The overall 'BUY' signals across the 1-hour (6 buys, 2 sells), 4-hour (8 buys, 0 sells), and daily (7 buys, 1 sell) timeframes lend further weight to the bull case. A break above the immediate resistance at $63.65 could open the door for a move towards the $65.00-$65.26 zone, supported by the strong trend indicators.
However, the bearish case cannot be ignored. On the 1-hour chart, the MACD and Stochastic indicators are flashing bearish signals, suggesting that the immediate upward momentum might be fading. The ADX reading of 34.85 on this timeframe, while strong, could also indicate that the market is nearing exhaustion after a significant move. The DXY's resilience, hovering near 99.58 despite the weak jobs report, poses a significant headwind. If the dollar regains strength, it will likely put pressure on silver. Furthermore, the RSI on the 4-hour chart is approaching overbought territory (72.44), and on the daily chart, it is at 60.05, indicating that while not yet overbought, the price has moved significantly higher recently. The overall 'SELL' signals are minimal but present (1 sell on 1H, 1 sell on 4H, 1 sell on 1D), and the neutral trend strength on the daily chart (50%) suggests that the current uptrend lacks deep conviction. A failure to decisively break above the $63.65 resistance could lead to a retracement towards the $63.14 or even $62.88 support levels, especially if broader market sentiment sours.
The critical juncture for XAGUSD lies between the immediate resistance at $63.65 and the support at $63.14. A decisive move above $63.65, ideally with increasing volume and confirmation from other indicators, could signal the continuation of the bullish trend, targeting the $65.26 resistance on the 4-hour chart. Conversely, a breakdown below $63.14, particularly a close below it on the 1-hour or 4-hour chart, would invalidate the short-term bullish structure and likely lead to a test of the $62.88 or even the more significant daily support at $60.60. The prevailing neutral trend on the daily chart suggests that the market is still deciding on the next major direction. Traders should pay close attention to how price action behaves around these levels in the coming sessions, looking for confirmation from volume and other technical indicators before committing to a trade. The upcoming week holds key economic data and central bank commentary, which could provide the catalyst needed to break this stalemate.
Given the current technical readings and market environment, the outlook for XAGUSD remains neutral, but with a slight bullish bias on the medium-term timeframes (4H and 1D). The strong ADX readings across timeframes indicate a trending market, yet the conflicting signals from RSI, MACD, and Stochastic on the shorter timeframes prevent a clear directional call. The immediate price action around $63.55 is key. A break above $63.65 could initiate a move higher, targeting $65.26. However, a failure to hold above $63.14 could precipitate a sharp decline towards $60.60. The recent NFP data has injected uncertainty into Fed policy expectations, which could support silver, but the DXY's resilience and geopolitical risks remain significant counterforces. Patience and risk management will be paramount for traders navigating this period.
Bearish Scenario: Silver Retreats Below Key Support
60% ProbabilityNeutral Scenario: Consolidation Around $63.55
25% ProbabilityBullish Scenario: Silver Breaks Higher
15% ProbabilityThe upcoming week features significant economic data releases, including US CPI and further central bank commentary. These events have the potential to cause sharp volatility and may invalidate technical setups. Traders should exercise caution and employ strict risk management strategies.
| Indicator | Value | Signal | Interpretation |
|---|---|---|---|
| RSI (14) | 60.05 | Neutral | Slightly bullish bias, approaching neutral territory. |
| MACD Histogram | +0.05 | Bullish | Positive momentum, MACD above signal line. |
| Stochastic (%K/%D) | 82.86 / 63.25 | Bullish | Strong bullish crossover, nearing overbought. |
| ADX | 26.58 | Strong Trend | Indicates a strong trend is present. |
| Bollinger Bands | Middle Band | Watch | Price is above the middle band, suggesting upward pressure. |
Frequently Asked Questions: XAGUSD Analysis
What happens if XAGUSD breaks below the $63.14 support level?
A decisive close below $63.14 on the 1-hour chart would invalidate the immediate bullish outlook, likely triggering a sell-off towards the $62.88 and potentially the significant daily support at $60.60. This scenario is assigned a 60% probability due to current mixed signals.
Should I buy XAGUSD at current levels around $63.55 given the neutral outlook and mixed indicators?
Buying at current levels carries risk due to the neutral outlook and conflicting signals. A confirmed breakout above $63.65 resistance, with supporting volume and bullish confirmation from MACD and Stochastic, would offer a higher-probability bullish setup targeting $65.26. Otherwise, waiting for a clearer signal or a pullback to support levels is advisable.
Is the RSI at 60.05 a sell signal for XAGUSD on the daily chart?
An RSI of 60.05 is not a direct sell signal; it resides in neutral territory with a slight upward bias. It indicates that while there is bullish momentum, the market is not yet overbought. A reading above 70 typically signals overbought conditions, which could precede a pullback or consolidation.
How will upcoming US CPI data and Fed commentary affect XAGUSD this week?
Higher-than-expected US CPI data or hawkish Fed commentary could strengthen the US Dollar (DXY) and put downward pressure on XAGUSD, potentially invalidating bullish scenarios. Conversely, softer inflation or dovish remarks could weaken the dollar, supporting higher silver prices and reinforcing the bullish case.
Track markets in real-time
AI-powered analysis, technical indicators and real-time price data.
Join Our Telegram Channel
Breaking market news, AI analysis and trading signals instantly.
Join Channel