
SP500 Tests Resistance: $6,572.87 Trades Near $6,605.07 Amid Mixed Signals
SP500 hovers around $6,572.87 as traders eye resistance at $6,605.07. Mixed technical indicators suggest a cautious market ahead of key economic data.
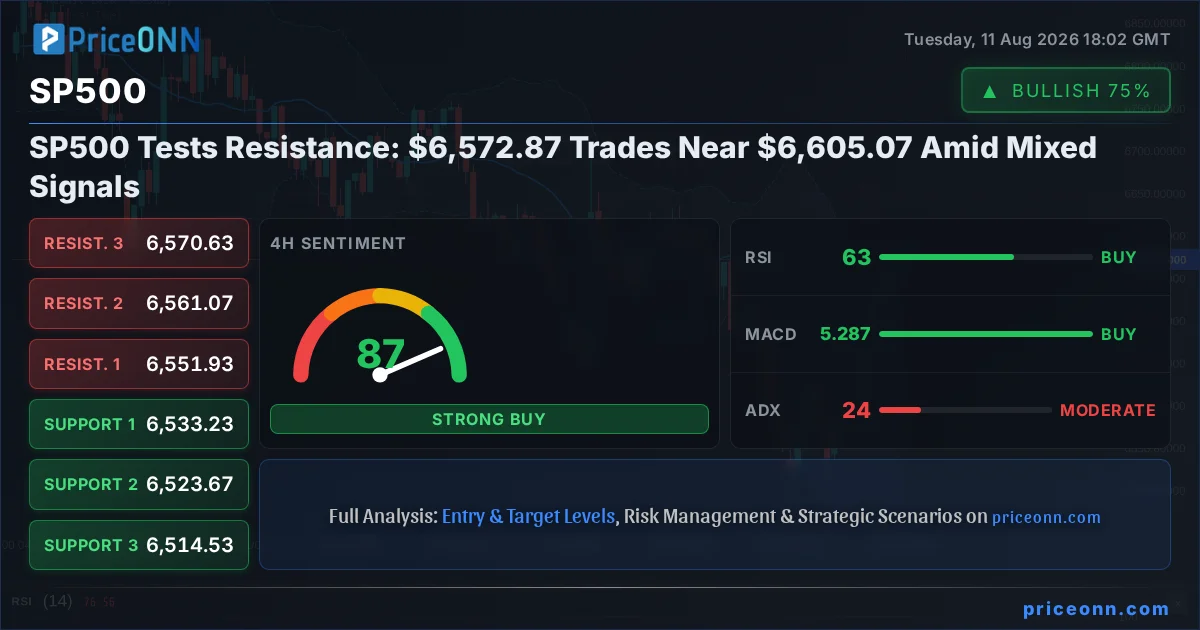
The S&P 500 (SP500) is currently navigating a critical juncture, trading near the $6,572.87 mark. This price point places the index squarely within a zone of intense technical scrutiny, as it approaches the significant resistance level of $6,605.07. While the 1-hour and 4-hour charts paint a cautiously optimistic picture with bullish trends and strong ADX readings, the daily outlook presents a more complex narrative. The daily timeframe shows a neutral trend with a strong ADX, yet indicators like RSI are hovering in neutral territory, and the MACD suggests a potential pullback. This divergence across timeframes creates a dynamic environment where traders are seeking clarity amidst conflicting signals, especially with the specter of upcoming economic events looming large.
- The SP500 is trading near $6,572.87, approaching a key resistance level at $6,605.07.
- 1-hour and 4-hour charts show bullish trends with strong ADX (49.72 and 24.23 respectively), but the daily trend is neutral with a strong ADX (47.51).
- RSI readings are mixed: 70.95 (1H, overbought), 62.83 (4H, neutral), and 45.35 (1D, neutral/bearish).
- MACD histogram indicates negative momentum on the 1H and 1D charts, contrasting with positive momentum on the 4H.
- Key support is identified at $6,526.53, while resistance looms around $6,568.73 on the 1H chart.
The S&P 500's current position near $6,572.87 is a testament to the market's ongoing tug-of-war between bullish momentum and underlying caution. On the shorter timeframes, the picture is decidedly constructive. The 1-hour chart, for instance, displays a robust uptrend with an impressive ADX value of 49.72, indicating strong directional conviction among market participants. This strength is echoed in the 4-hour timeframe, where the trend is also bullish, albeit with a more moderate ADX of 24.23. These shorter-term dynamics suggest that dip-buyers remain active, ready to step in and defend the price action. However, the broader daily perspective introduces a layer of complexity. The daily trend is officially neutral, a stark contrast to the shorter-term bullishness. This neutrality, characterized by an ADX of 47.51 - still indicative of a strong trend, but lacking a clear direction - suggests that the market is at an indecision point. Traders are thus faced with a scenario where shorter-term strength clashes with longer-term uncertainty, demanding careful analysis and risk management.
Diving deeper into the technical indicators, the conflicting signals across different timeframes become even more apparent. On the 1-hour chart, the Relative Strength Index (RSI) at 70.95 is flashing an overbought warning, suggesting that the recent upward move might be extended and susceptible to a pullback. This aligns with the negative momentum indicated by the MACD histogram, which is trading below its signal line. However, the Stochastic Oscillator on the same timeframe presents a mixed picture: the %K line (65.73) is above the %D line (73.5), but both are in the upper range, indicating potential for further upside or a sharp reversal. This ambiguity is precisely what makes the current price action so critical. The 4-hour chart, on the other hand, offers a more balanced view, with an RSI of 62.83 sitting comfortably in neutral territory, and the MACD showing positive momentum. This suggests that the bullish sentiment from the 1-hour chart might have some legs, at least in the medium term. Yet, the daily chart complicates matters further. The RSI here is at 45.35, leaning towards the bearish side, and the MACD histogram continues to show negative momentum, reinforcing the idea that the longer-term trend might be under pressure despite the intraday strength.
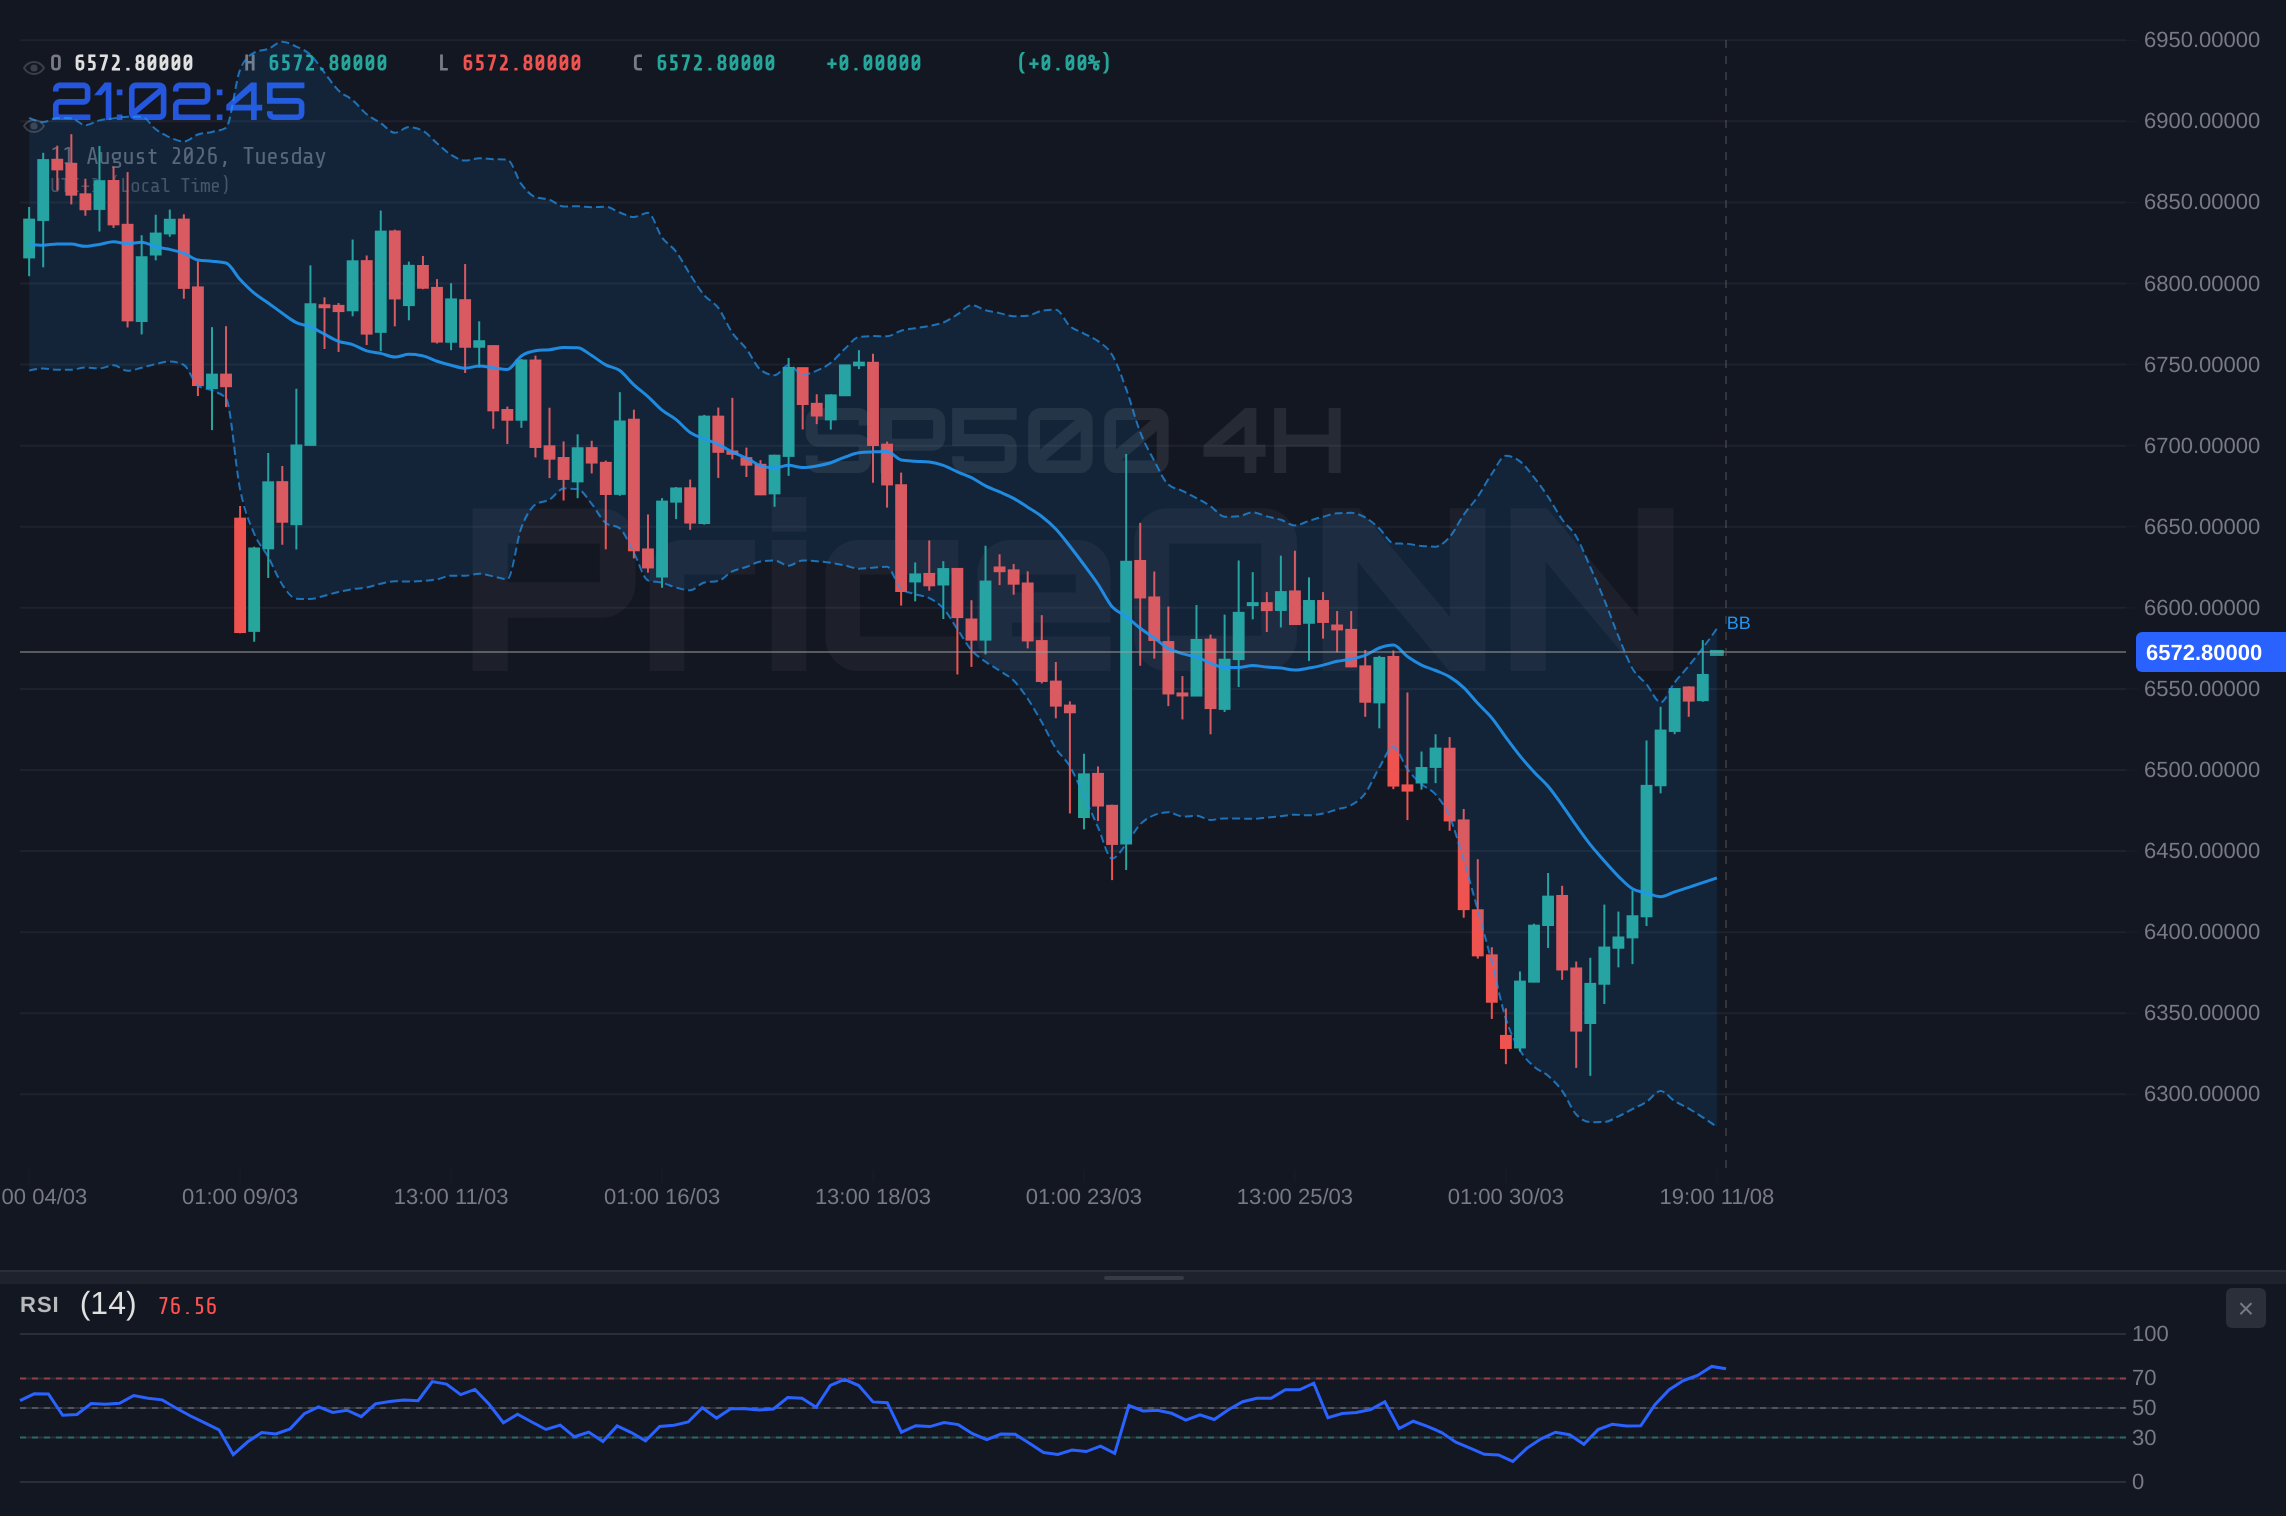
Navigating the Support and Resistance Maze
Understanding the key price levels is paramount for traders attempting to navigate this complex market environment. On the 1-hour chart, immediate support is found at $6,547.63, followed by more significant levels at $6,535.07 and $6,526.53. A break below this $6,526.53 floor would likely signal a shift in sentiment, potentially invalidating the short-term bullish thesis. Conversely, immediate resistance on the 1-hour chart lies at $6,568.73, with further hurdles at $6,577.27 and $6,589.83. The $6,605.07 level mentioned in the title acts as a more substantial psychological and technical barrier. The 4-hour chart offers slightly different support and resistance zones, with support at $6,533.23, $6,523.67, and $6,514.53, and resistance at $6,551.93, $6,561.07, and $6,570.63. The daily chart presents a wider range, with support at $6,377.47 and resistance at $6,605.07, $6,685.83, and $6,832.67. This layering of support and resistance across different timeframes highlights the pivotal nature of the current price action. A decisive move above the $6,568.73 to $6,577.27 zone on the 1-hour chart could pave the way for a test of higher resistance, while a failure to hold above $6,526.53 might trigger a sell-off towards daily support levels.
The current market sentiment for the SP500 appears to be in a state of flux, reflecting the mixed signals from the technical indicators. The 1-hour chart exhibits a strong bullish trend with an ADX of 49.72, suggesting that buyers are in control in the very short term. This is supported by a general signal of 'BUY' from the aggregated indicators on this timeframe. However, this bullishness is tempered by the RSI at 70.95, indicating overbought conditions that could precede a correction. The 4-hour chart presents a more balanced outlook, with a bullish trend and a 'BUY' signal, but the Stochastic Oscillator is showing a bearish crossover (%K
Correlation Analysis: The Dollar and Risk Appetite
To truly understand the SP500's current predicament, we must consider its correlation with broader market forces, particularly the US Dollar Index (DXY) and overall risk appetite. The DXY is currently showing strength, trading at 99.88 and exhibiting a rising trend on the 1-hour and 4-hour charts, though the daily trend is bearish. A stronger dollar typically exerts downward pressure on equities, including the SP500, as it makes US goods more expensive for foreign buyers and can signal tighter monetary policy or global uncertainty. The current DXY level of 99.88, while not at extreme highs, is certainly in a zone that warrants attention. If the DXY continues its upward trajectory, it could act as a headwind for the SP500, potentially capping any further upside moves and increasing the likelihood of a test of lower support levels. Furthermore, the performance of other major indices provides context. The Nasdaq 100 is showing a bearish trend on the 1-hour chart (RSI 36.78) and a neutral trend on the 4-hour (RSI 50.41), while the Dow Jones 30 exhibits mixed signals with a neutral 1-hour trend and a bullish 4-hour trend. This mixed performance across major US indices suggests a lack of broad-based conviction, reinforcing the idea that the SP500's current push towards resistance is being met with significant caution from market participants.
The interplay between oil prices and inflation expectations also adds another layer to the SP500's complex picture. Brent crude is showing a strong bullish trend across all timeframes, currently trading at $87.46. WTI crude is similarly strong, trading at $84.23. Rising oil prices are a significant driver of inflation, and persistent strength in energy markets could influence central bank policy expectations. If inflation remains stubbornly high, driven partly by energy costs, the Federal Reserve might be compelled to maintain a hawkish stance or delay interest rate cuts. This, in turn, could dampen investor sentiment towards equities, as higher borrowing costs and a tighter economic environment tend to weigh on corporate earnings and valuations. While the recent news flow highlights gold's rally towards two-month highs amid expectations of a Fed hold and evasive US-Iran deal developments, it's the underlying inflation narrative driven by commodities like oil that ultimately shapes the Fed's calculus and, by extension, the SP500's trajectory. The market is keenly watching for signs of cooling inflation, but the current energy price action suggests this might be a protracted battle.
Trading Scenarios: A Path Forward
Given the current technical landscape and market correlations, several scenarios are plausible for the SP500. The dominant narrative on the shorter timeframes suggests a potential continuation of the bullish trend, targeting higher resistance levels. However, the daily chart's indecision and the overbought signals on the 1-hour RSI temper this optimism. The confluence of factors - mixed indicator signals, approaching key resistance levels, and the ever-present influence of macroeconomic data and geopolitical events - creates a high-stakes environment for traders. Patience and discipline will be key, as the market consolidates its next move. The upcoming economic calendar, while not explicitly detailed with specific dates in the provided data, is always a critical factor. Any unexpected inflation data, employment figures, or central bank commentary could rapidly shift the narrative and trigger significant price movements. Traders must remain vigilant, ready to adapt their strategies as new information emerges.
Bearish Scenario: Resistance Holds Firm
65% ProbabilityNeutral Scenario: Consolidation and Observation
25% ProbabilityBullish Scenario: Breakout Confirmation
10% ProbabilityThe Path Forward: Navigating Uncertainty
The SP500's current position is a classic case of market indecision, amplified by conflicting signals across different timeframes and the anticipation of key economic data. While the 1-hour chart shows a strong bullish impulse, the daily perspective remains cautious, with a neutral trend and bearish leanings in key oscillators like the RSI. The DXY's current strength at 99.88 adds another layer of complexity, potentially acting as a drag on equity markets. The high ADX values across most timeframes (1H: 49.72, 4H: 24.23, 1D: 47.51) indicate that when a trend does establish, it tends to be strong, but the current lack of directional consensus means volatility could increase as the market digests new information. Traders must remain acutely aware of the $6,526.53 support level on the 1-hour chart and the $6,568.73 to $6,577.27 resistance zone. A decisive move through either of these areas, especially with confirming volume and broader market alignment, will likely dictate the next significant move.
The battle between bulls and bears is palpable as the SP500 hovers around $6,572.87. On the 1-hour chart, the trend strength indicators are robustly bullish, suggesting that short-term traders are pushing prices higher. However, the RSI at 70.95 is a flashing red light, warning of potential exhaustion. This divergence is a common precursor to a market turning point. The Stochastic Oscillator on the 1-hour chart supports this, showing a bearish crossover while still in elevated territory. The 4-hour chart offers a slightly more balanced view, with a bullish trend but a Stochastic showing a bearish signal. It's the daily chart that provides the most sober perspective: a neutral trend with a strong ADX, but a bearish RSI and MACD momentum. This paints a picture of an index that is being pushed higher on shorter timeframes, but lacks the conviction for a sustained breakout. The key takeaway is that while intraday momentum exists, the longer-term structure is not yet confirming a strong bullish continuation, making the upcoming price action highly sensitive to news and data releases.
The recent news surrounding gold prices nearing two-month highs, driven by expectations of a Fed hold and evasive US-Iran deal developments, indirectly influences the SP500. Gold's strength as a safe-haven asset often correlates with a decrease in risk appetite, which can pressure equity markets. While the provided data doesn't show a direct correlation breakdown, the underlying narrative of geopolitical uncertainty and potential shifts in central bank policy is critical. If inflation remains a concern, as suggested by the strength in oil prices (Brent at $87.46, WTI at $84.23), the Fed's path becomes more complex. Any hint of prolonged higher rates could easily spook equity markets, turning the SP500's current resistance test into a significant reversal point. Therefore, while technicals provide the immediate roadmap, the macro-economic backdrop and geopolitical undercurrents are the ultimate arbiters of the SP500's fate in the coming days and weeks.
The market is currently at a crossroads, with conflicting technical signals and a complex macroeconomic backdrop. The strength observed on the 1-hour chart, with its bullish trend and high ADX, is being challenged by the daily chart's neutral stance and bearish RSI reading. This divergence suggests that the current upward momentum may not be sustainable without further confirmation. Traders are advised to exercise caution and focus on risk management. The key levels identified - support at $6,526.53 and resistance between $6,568.73 and $6,577.27 on the 1-hour chart - will be critical in determining the next directional move. A failure to decisively break through resistance could lead to a pullback, while a hold above key support might pave the way for further gains. The overall market sentiment remains cautious, awaiting clearer signals from economic data and central bank policy expectations.
Frequently Asked Questions: SP500 Analysis
What happens if SP500 breaks above the $6,577.27 resistance level?
A sustained move above $6,577.27 on the 1-hour chart could invalidate the bearish scenario, potentially triggering a rally towards the next resistance at $6,589.83. This would signal strong buying conviction and could lead to further upside towards the $6,605.07 daily resistance level.
Is the RSI at 70.95 a sell signal for SP500 right now?
An RSI of 70.95 on the 1-hour chart indicates overbought conditions, which can sometimes precede a price reversal or a period of consolidation. While not an immediate sell signal on its own, it suggests that the recent upward momentum may be losing steam and traders should look for confirmation from other indicators before initiating new long positions.
How will the upcoming economic data affect SP500 this week?
Upcoming economic data, particularly inflation reports like CPI, can significantly impact the SP500 by influencing Federal Reserve policy expectations. Stronger-than-expected inflation could lead to hawkish Fed sentiment, pressuring equities, while softer data might support a dovish stance, potentially boosting the index. Traders should monitor these releases closely for potential shifts in market direction.
Should I buy SP500 at current levels near $6,572.87 given the mixed signals?
Buying at $6,572.87 with mixed signals warrants extreme caution and a well-defined risk management strategy. The bullish 1-hour trend is countered by daily chart weaknesses and overbought conditions. A conservative approach would be to wait for a clear break above $6,577.27 or a pullback to support near $6,535.07 before considering entry points.
| Indicator | Value | Signal | Interpretation |
|---|---|---|---|
| RSI (14) | 67.36 | Neutral | Approaching overbought on 1H (70.95), neutral on 4H (62.83), bearish on 1D (45.35) |
| MACD Histogram | -130.6 | Bearish | Negative momentum on 1H and 1D; positive on 4H. |
| Stochastic (%K, %D) | 65.73, 73.5 | Neutral | Mixed signals: bearish crossover on 1H, bullish on 4H, bearish on 1D. |
| ADX | 47.51 | Bullish | Strong trend strength indicated across timeframes, but direction is mixed. |
| Bollinger Bands | Middle Band | Watch | Price above middle band on 1H & 4H, below on 1D. |
Track markets in real-time
AI-powered analysis, technical indicators and real-time price data.
Join Our Telegram Channel
Breaking market news, AI analysis and trading signals instantly.
Join Channel