

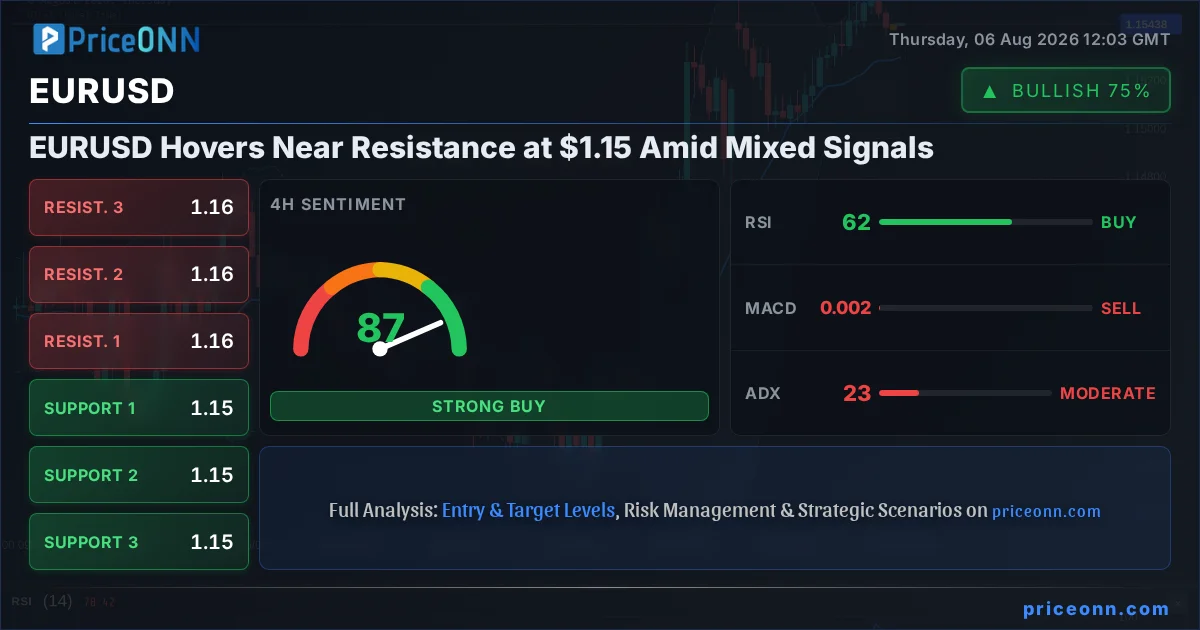
The EURUSD pair is currently navigating a critical juncture, trading near the $1.1544 mark, a level that presents a significant resistance point. This strategic position comes at a time when market participants are closely watching a confluence of technical indicators and upcoming economic data releases that could dictate the euro's next significant move against the US dollar.
- EURUSD is trading near $1.1544, testing resistance levels.
- The 1-hour chart shows mixed signals, with RSI at 50.1 and ADX indicating a weak trend.
- Daily charts show a stronger bullish bias with RSI at 61.06, but Stochastic is in overbought territory at 91.38.
- The US Dollar Index (DXY) is at 99.76, showing a slight upward trend that could pressure EURUSD.
The Euro's recent performance has been characterized by a steady climb, pushing it towards the upper bounds of its recent trading range. However, as it approaches the $1.1544 level, a zone where selling pressure has historically emerged, the momentum appears to be faltering. This hesitation is reflected in the technical indicators, which present a somewhat conflicting picture across different timeframes. On the 1-hour chart, the Relative Strength Index (RSI) hovers around 50.1, indicating a neutral stance, while the Average Directional Index (ADX) at 21.78 suggests only a moderately trending market. This lack of strong directional conviction on shorter timeframes suggests that the market is waiting for a clearer catalyst.
Further complicating the short-term outlook, the Stochastic Oscillator on the 1-hour timeframe shows %K at 26.54 and %D at 19.38, which can be interpreted as a nascent bullish signal as %K crosses above %D. However, this is occurring in oversold territory, and its reliability in the face of broader market sentiment remains to be seen. The MACD indicator, on the other hand, continues to show negative momentum, with the MACD line below its signal line, hinting at potential downward pressure if this trend persists. The Bollinger Bands on the 1-hour chart are also showing the price trading above the middle band, suggesting an upward bias, but the narrow range of the bands themselves indicates low volatility, which often precedes a significant price movement.
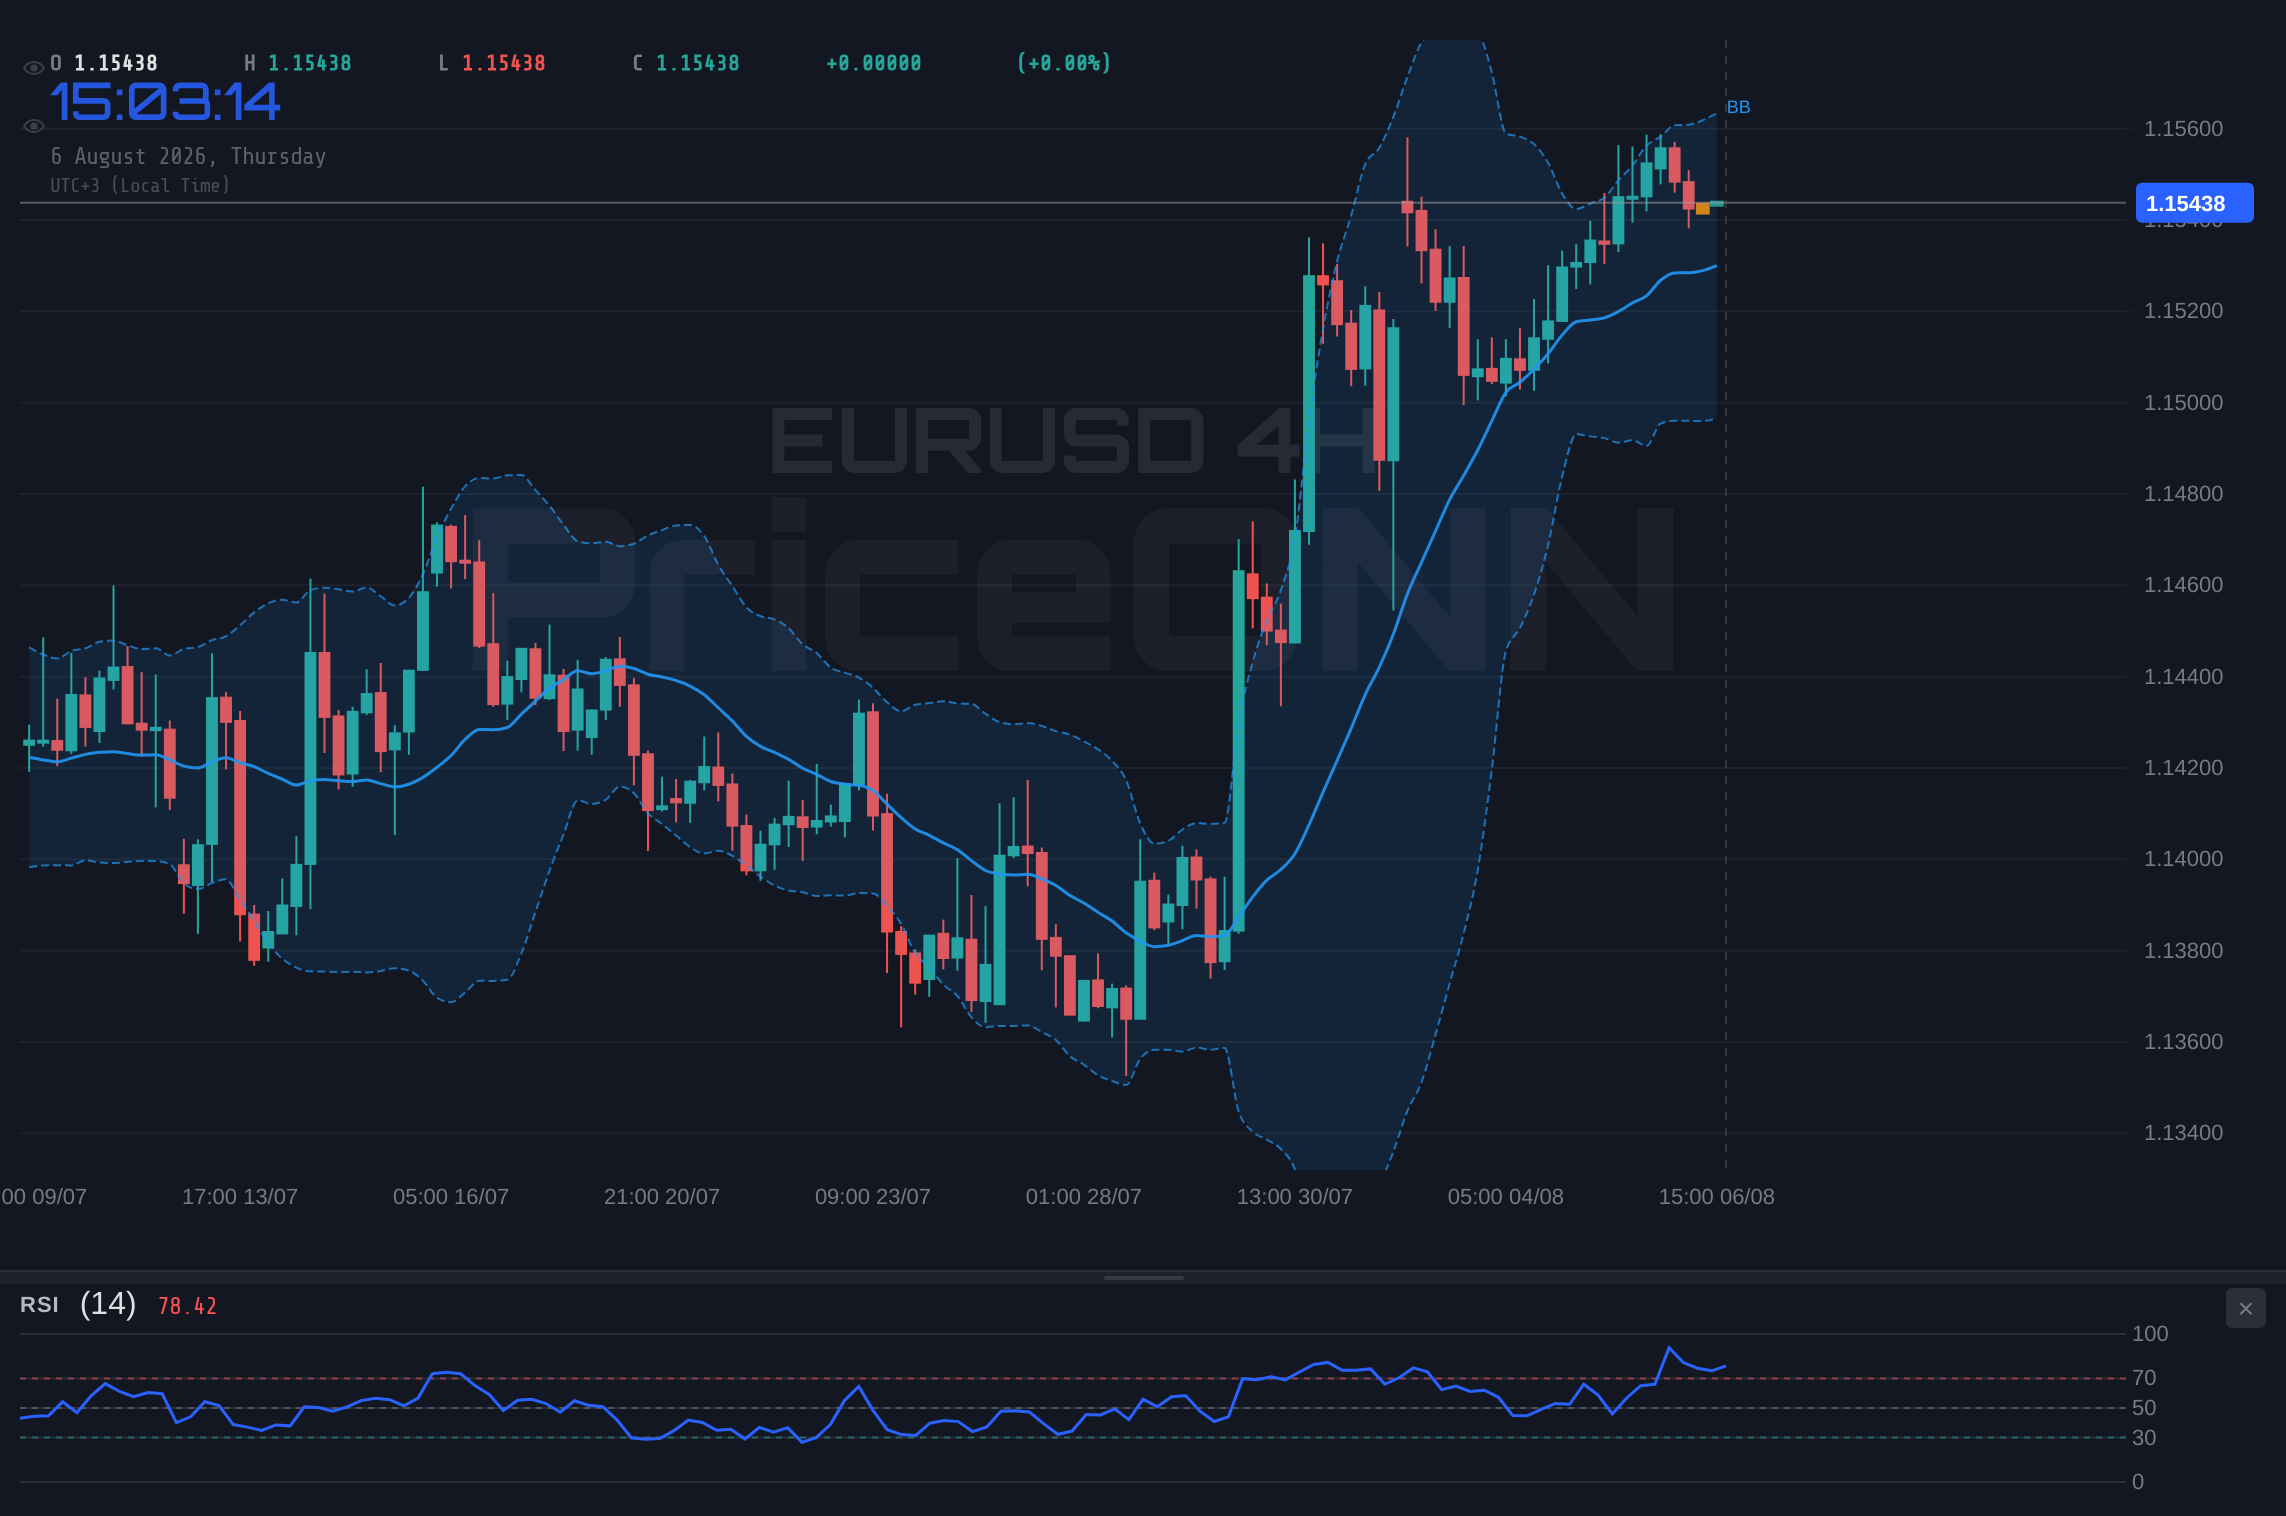
Navigating the 4-Hour Technical Landscape
Shifting our focus to the 4-hour timeframe, the technical picture for EURUSD becomes slightly more constructive, albeit with its own set of cautionary notes. The trend is predominantly identified as 'Up' with a power rating of 91%, signaling a stronger bullish sentiment over this intermediate period. Key support levels are identified at 1.15439, 1.15394, and 1.15328, providing a buffer against any immediate downturns. Resistance is firmly set at 1.1555, 1.15616, and 1.15661, levels that the bulls must conquer to sustain their advance.
The RSI(14) on the 4-hour chart stands at 61.96, comfortably within the neutral zone but leaning towards bullish territory, suggesting room for further upside before becoming overbought. However, the Stochastic Oscillator presents a divergence: %K at 73.44 and %D at 81.27 indicate an overbought condition, with %K below %D signaling a potential bearish cross. This is a classic case of conflicting signals, where the RSI suggests further gains are possible, but the Stochastic warns of an imminent pullback. The ADX at 22.85 reinforces the idea of a moderately strong uptrend, but not one that is excessively extended.
The MACD on this timeframe shows negative momentum, which is somewhat counterintuitive to the overall bullish trend identified by other indicators. This divergence between the trend and momentum indicators warrants close attention. Bollinger Bands are trading above the middle band, aligning with the bullish trend, but the overall signal summary for the 4-hour chart is 'BUY' (6 Buy, 2 Sell, 0 Neutral), indicating that the majority of indicators lean towards a positive outlook for EURUSD at this intermediate level.
The Daily Chart: A Stronger Bullish Undercurrent
Examining the daily chart for EURUSD reveals a more compelling bullish narrative, even as the price hovers near resistance. The trend is classified as 'Neutral' with a 50% power rating, which might seem contradictory to the 'BUY' signal generated by a majority of indicators (6 Buy, 2 Sell, 0 Neutral). This suggests that while the longer-term trend is not definitively established, the immediate sentiment and shorter-term signals are leaning towards upside potential. The support levels on the daily chart are significantly lower, at 1.1532, 1.15115, and 1.14982, indicating substantial downside risk if the current bullish sentiment falters.
Resistance on the daily chart is marked at 1.15658, 1.15791, and 1.15996. Breaking through these levels would signal a more robust continuation of the upward move. The RSI(14) at 61.06 remains in neutral territory, showing a slight upward inclination, which is generally favorable for continued price appreciation. The MACD is also displaying positive momentum, with the MACD line above its signal line, reinforcing the bullish bias. The Bollinger Bands are trading above the middle band, indicating an upward tendency, and potentially signaling an overbought condition or a breakout if the upper band is breached decisively.
However, the Stochastic Oscillator on the daily chart is flashing a strong warning sign. With %K at 91.38 and %D at 86.41, it is deeply entrenched in overbought territory. This suggests that the pair may be due for a correction or consolidation period. The ADX at 26.09 indicates a strong uptrend, which is consistent with the MACD and Bollinger Band signals. The overall 'BUY' signal from the daily indicators suggests that, despite the overbought Stochastic, the path of least resistance may still be upwards in the short to medium term, provided key resistance levels are overcome.
The Dollar's Influence: DXY and Correlation Analysis
No analysis of EURUSD would be complete without considering the pivotal role of the US Dollar Index (DXY). Currently trading at 99.76, the DXY is showing a slight upward trend on the 1-hour chart, with a neutral strength of 50% and a general signal leaning towards 'BUY' (5 Buy, 3 Sell, 0 Neutral). This upward pressure from the dollar index is a significant headwind for EURUSD. Historically, a strengthening dollar tends to weigh on the euro, pushing EURUSD lower. The DXY's current position, just below the 100 mark, is a psychological level that, if breached decisively, could trigger further dollar strength and put renewed pressure on the euro.
On the 4-hour chart, the DXY trend is identified as 'Down' with high power (94%), suggesting that the dollar's broader trend might be weakening, which would theoretically be supportive of EURUSD. However, the daily chart shows the DXY trend as 'Neutral' (50% power), with indicators suggesting a potential bottoming out and a possible reversal. The RSI at 35.6 is in oversold territory, and the Stochastic at 15.21 is also deeply oversold. This presents a complex correlation picture: while short-term dollar weakness might offer some respite to EURUSD, the longer-term outlook for the dollar, if it finds support around these levels, could cap further gains for the euro.
The interplay between EURUSD and DXY is crucial. If the DXY manages to break above its immediate resistance at 99.80 and climb towards 100, it would likely coincide with a pullback in EURUSD from its current resistance levels. Conversely, a failure of the DXY to hold its ground and a subsequent move lower could provide the necessary fuel for EURUSD to break through its own resistance barriers. This dynamic underscores the importance of monitoring the dollar's trajectory as a primary driver for the pair.
Economic Calendar: Upcoming Catalysts and Their Potential Impact
The economic calendar is populated with several key events that could significantly influence the EURUSD's trajectory in the coming days. On the Eurozone side, upcoming Purchasing Managers' Index (PMI) data for manufacturing and services will offer crucial insights into the economic health of the bloc. Stronger-than-expected figures could bolster the euro, while weaker data might reignite recession fears and weigh on the currency.
For the US dollar, the focus will be on employment data, including the ADP Non-Farm Employment Change report and, more importantly, the Non-Farm Payrolls (NFP) figures. Last week's Federal Reserve meeting provided some clarity on monetary policy, but these upcoming labor market reports will be critical in shaping future interest rate expectations. If the US labor market continues to show resilience, it could support a stronger dollar, potentially capping EURUSD's upside. Conversely, any signs of weakness in the employment data might lead markets to price in earlier or more aggressive interest rate cuts by the Fed, which would likely weaken the dollar and support EURUSD.
Furthermore, inflation data, such as the Consumer Price Index (CPI), will remain a key focus. Persistently high inflation could force central banks to maintain a hawkish stance, while a significant cooling could pave the way for looser monetary policy. The market's reaction to these data points will depend heavily on whether they align with, exceed, or fall short of expectations, and how they are interpreted in the context of ongoing inflation battles and growth concerns.
Key Levels and Price Action Insights
The EURUSD pair is currently testing a critical resistance zone around the $1.1544 mark. On the 1-hour chart, immediate resistance is seen at 1.15429, followed by 1.15456 and 1.15492. A decisive break above these levels, particularly a close above 1.1550, would be a significant bullish signal, potentially opening the door for a move towards the 4-hour resistance levels at 1.1555, 1.15616, and ultimately 1.15661. The daily resistance levels at 1.15658, 1.15791, and 1.15996 represent the next major hurdles for the bulls.
On the downside, immediate support on the 1-hour chart is located at 1.15366, 1.1533, and 1.15303. A break below these levels would indicate a shift in short-term sentiment and could lead to a test of the 4-hour support levels at 1.15439, 1.15394, and 1.15328. Further down, the daily support at 1.1532 becomes a crucial line in the sand; a failure to hold this level could trigger a more significant sell-off towards 1.15115 and 1.14982.
The current price action near $1.1544 is pivotal. The pair is caught between the short-term bullish signals and the longer-term resistance, with the DXY's movements adding another layer of complexity. A sustained move above $1.1550, confirmed by increasing volume and positive follow-through on higher timeframes, would suggest a bullish continuation. However, any signs of rejection from the current levels, especially if accompanied by dollar strength and negative economic surprises, could lead to a sharp reversal.
Bearish Scenario: Euro Retreats from Resistance
60% ProbabilityBullish Scenario: Euro Pushes Through Resistance
30% ProbabilityNeutral Scenario: Consolidation Near Resistance
10% ProbabilityFrequently Asked Questions: EURUSD Analysis
What happens if EURUSD breaks above the $1.1566 resistance level?
A decisive break above $1.1566 on the 4-hour chart would invalidate the bearish scenario and open the door for further upside. This could target the daily resistance at $1.1580, provided the US Dollar Index (DXY) does not show renewed strength.
Should I consider buying EURUSD at current levels near $1.1544 given the mixed signals?
Buying at current levels carries risk due to the proximity to resistance and conflicting indicators like the overbought Stochastic on the daily chart. A more prudent approach might be to wait for a clear breakout above $1.1555 or a pullback to support levels around $1.1533, with confirmation from the DXY's direction.
Is the RSI at 61.06 on the daily chart a bullish signal for EURUSD?
An RSI of 61.06 on the daily chart indicates a bullish inclination but is still within the neutral zone, suggesting room for upward movement. It aligns with other bullish signals like MACD momentum but should be considered alongside the overbought Stochastic, which warrants caution.
How will upcoming US employment data affect EURUSD this week?
Stronger-than-expected US employment figures could boost the dollar, pressuring EURUSD lower towards support levels like $1.1533. Conversely, weaker data might lead to dollar depreciation, potentially allowing EURUSD to challenge resistance around $1.1566.
The EURUSD pair is currently at a crossroads, poised between the potential for further gains and the risk of a pullback from key resistance. While shorter-term technicals present a mixed picture, the daily chart offers a slightly more bullish lean, albeit tempered by overbought conditions on the Stochastic Oscillator. The direction of the US Dollar Index (DXY) and upcoming economic data releases, particularly US employment figures, will be crucial in determining whether the euro can sustain its advance or if it succumbs to selling pressure near the $1.1544 level. Traders should exercise caution and look for clear confirmation signals before committing to positions, managing risk diligently as the market navigates these conflicting forces.
📊 Indicator Dashboard
| Indicator | Value | Signal | Interpretation |
|---|---|---|---|
| RSI (14) | 61.06 | Neutral | Bullish leaning, but watch for overbought conditions. |
| MACD | +0.0008 | Bullish | Positive momentum developing. |
| Stochastic | 91.38 / 86.41 | Bearish | Deeply overbought, signaling potential pullback. |
| ADX | 26.09 | Bullish | Strong uptrend confirmed. |
| Bollinger | Middle Band | Bullish | Price above middle band. |
Key Levels
Track markets in real-time
AI-powered analysis, technical indicators and real-time price data.
Join Our Telegram Channel
Breaking market news, AI analysis and trading signals instantly.
Join Channel