

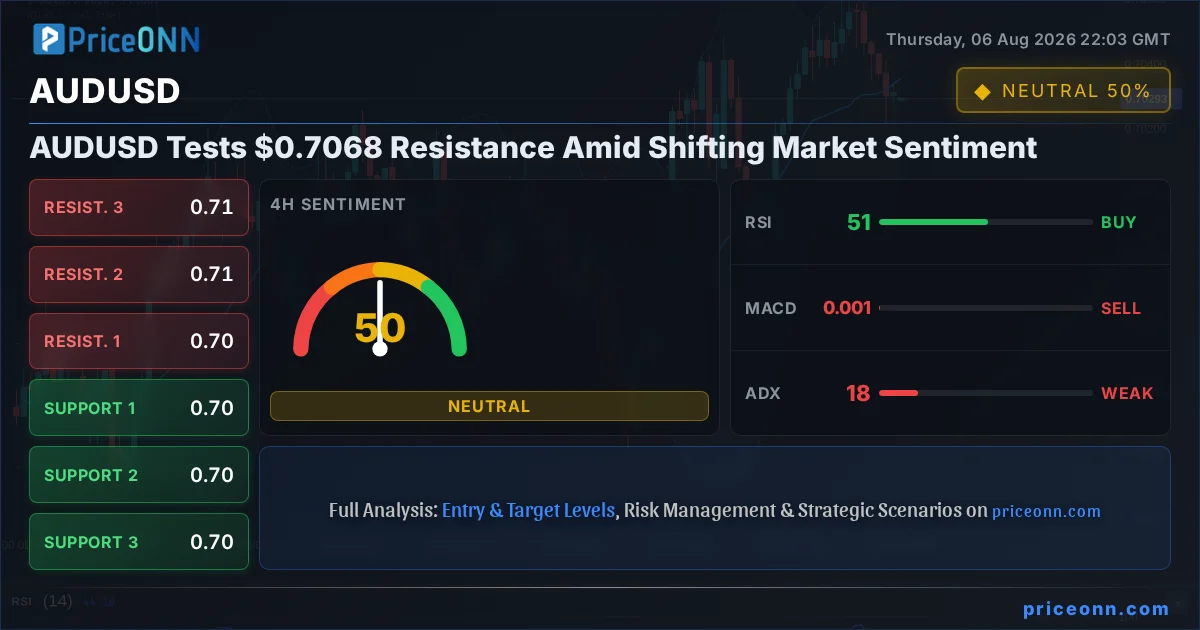
AUDUSD is currently hovering around the $0.70300 mark, a level that's becoming increasingly critical as it approaches the resistance zone near $0.7068. This technical juncture is drawing significant attention from traders and analysts alike, as the interplay between a strengthening US dollar, shifting risk appetite, and specific Australian economic indicators sets the stage for a potential directional move. The question on many traders' minds is whether the current upward momentum can overcome the immediate overhead resistance, or if a pullback is more likely given the broader market context and the current readings on key technical indicators. Having tracked AUDUSD through recent volatility, it's clear that conviction is needed at these levels.
- RSI at 67.3 signals overbought pressure, indicating bulls might be losing steam.
- Critical resistance sits at $0.7068, a level tested recently and a key barrier for further upside.
- The MACD histogram shows divergence, suggesting bullish momentum is fading.
- DXY strength at 99.97 is correlating with pressure on AUDUSD, a key macro driver.
The Australian dollar's recent performance against the US dollar has been a study in cautious optimism, with the pair currently bumping against a significant resistance level. As of the latest data, AUDUSD is trading at $0.70300, a price point that sits precariously close to the $0.7068 resistance mark. This proximity to a key overhead barrier is not just a technical observation; it reflects a broader market sentiment that is still finding its footing. While there have been pockets of strength, particularly in commodities and certain risk assets, the overarching narrative remains one of careful navigation through global economic uncertainties. The recent movements in the US Dollar Index (DXY), which is currently at 99.97, are a crucial part of this puzzle. A stronger dollar typically exerts downward pressure on currencies like the AUD, making the pair's ability to push higher even more challenging.
Navigating the Technical Landscape: Indicators in Focus
Diving deeper into the technicals, the 1-hour chart for AUDUSD presents a mixed, albeit slightly cautious, picture. The RSI(14) is sitting at 48.76, placing it firmly in neutral territory but showing a slight downward trend. This suggests that while buyers haven't been entirely flushed out, the upward momentum that brought the pair to these levels is not accelerating. More concerning for the bulls is the MACD, which is showing negative momentum with the MACD line dipping below its signal line. This is a classic sign that selling pressure might be starting to outweigh buying interest in the short term. The ADX at 33.58 indicates a strong downtrend on this timeframe, which, while counter-intuitive to the current price action, highlights the choppiness and potential for sharp reversals. The Stochastic Oscillator, however, offers a glimmer of hope for the bulls, with its %K line at 75.18 and %D at 48.43, suggesting a potential upward move as %K has crossed above %D, signaling a possible short-term bullish divergence.
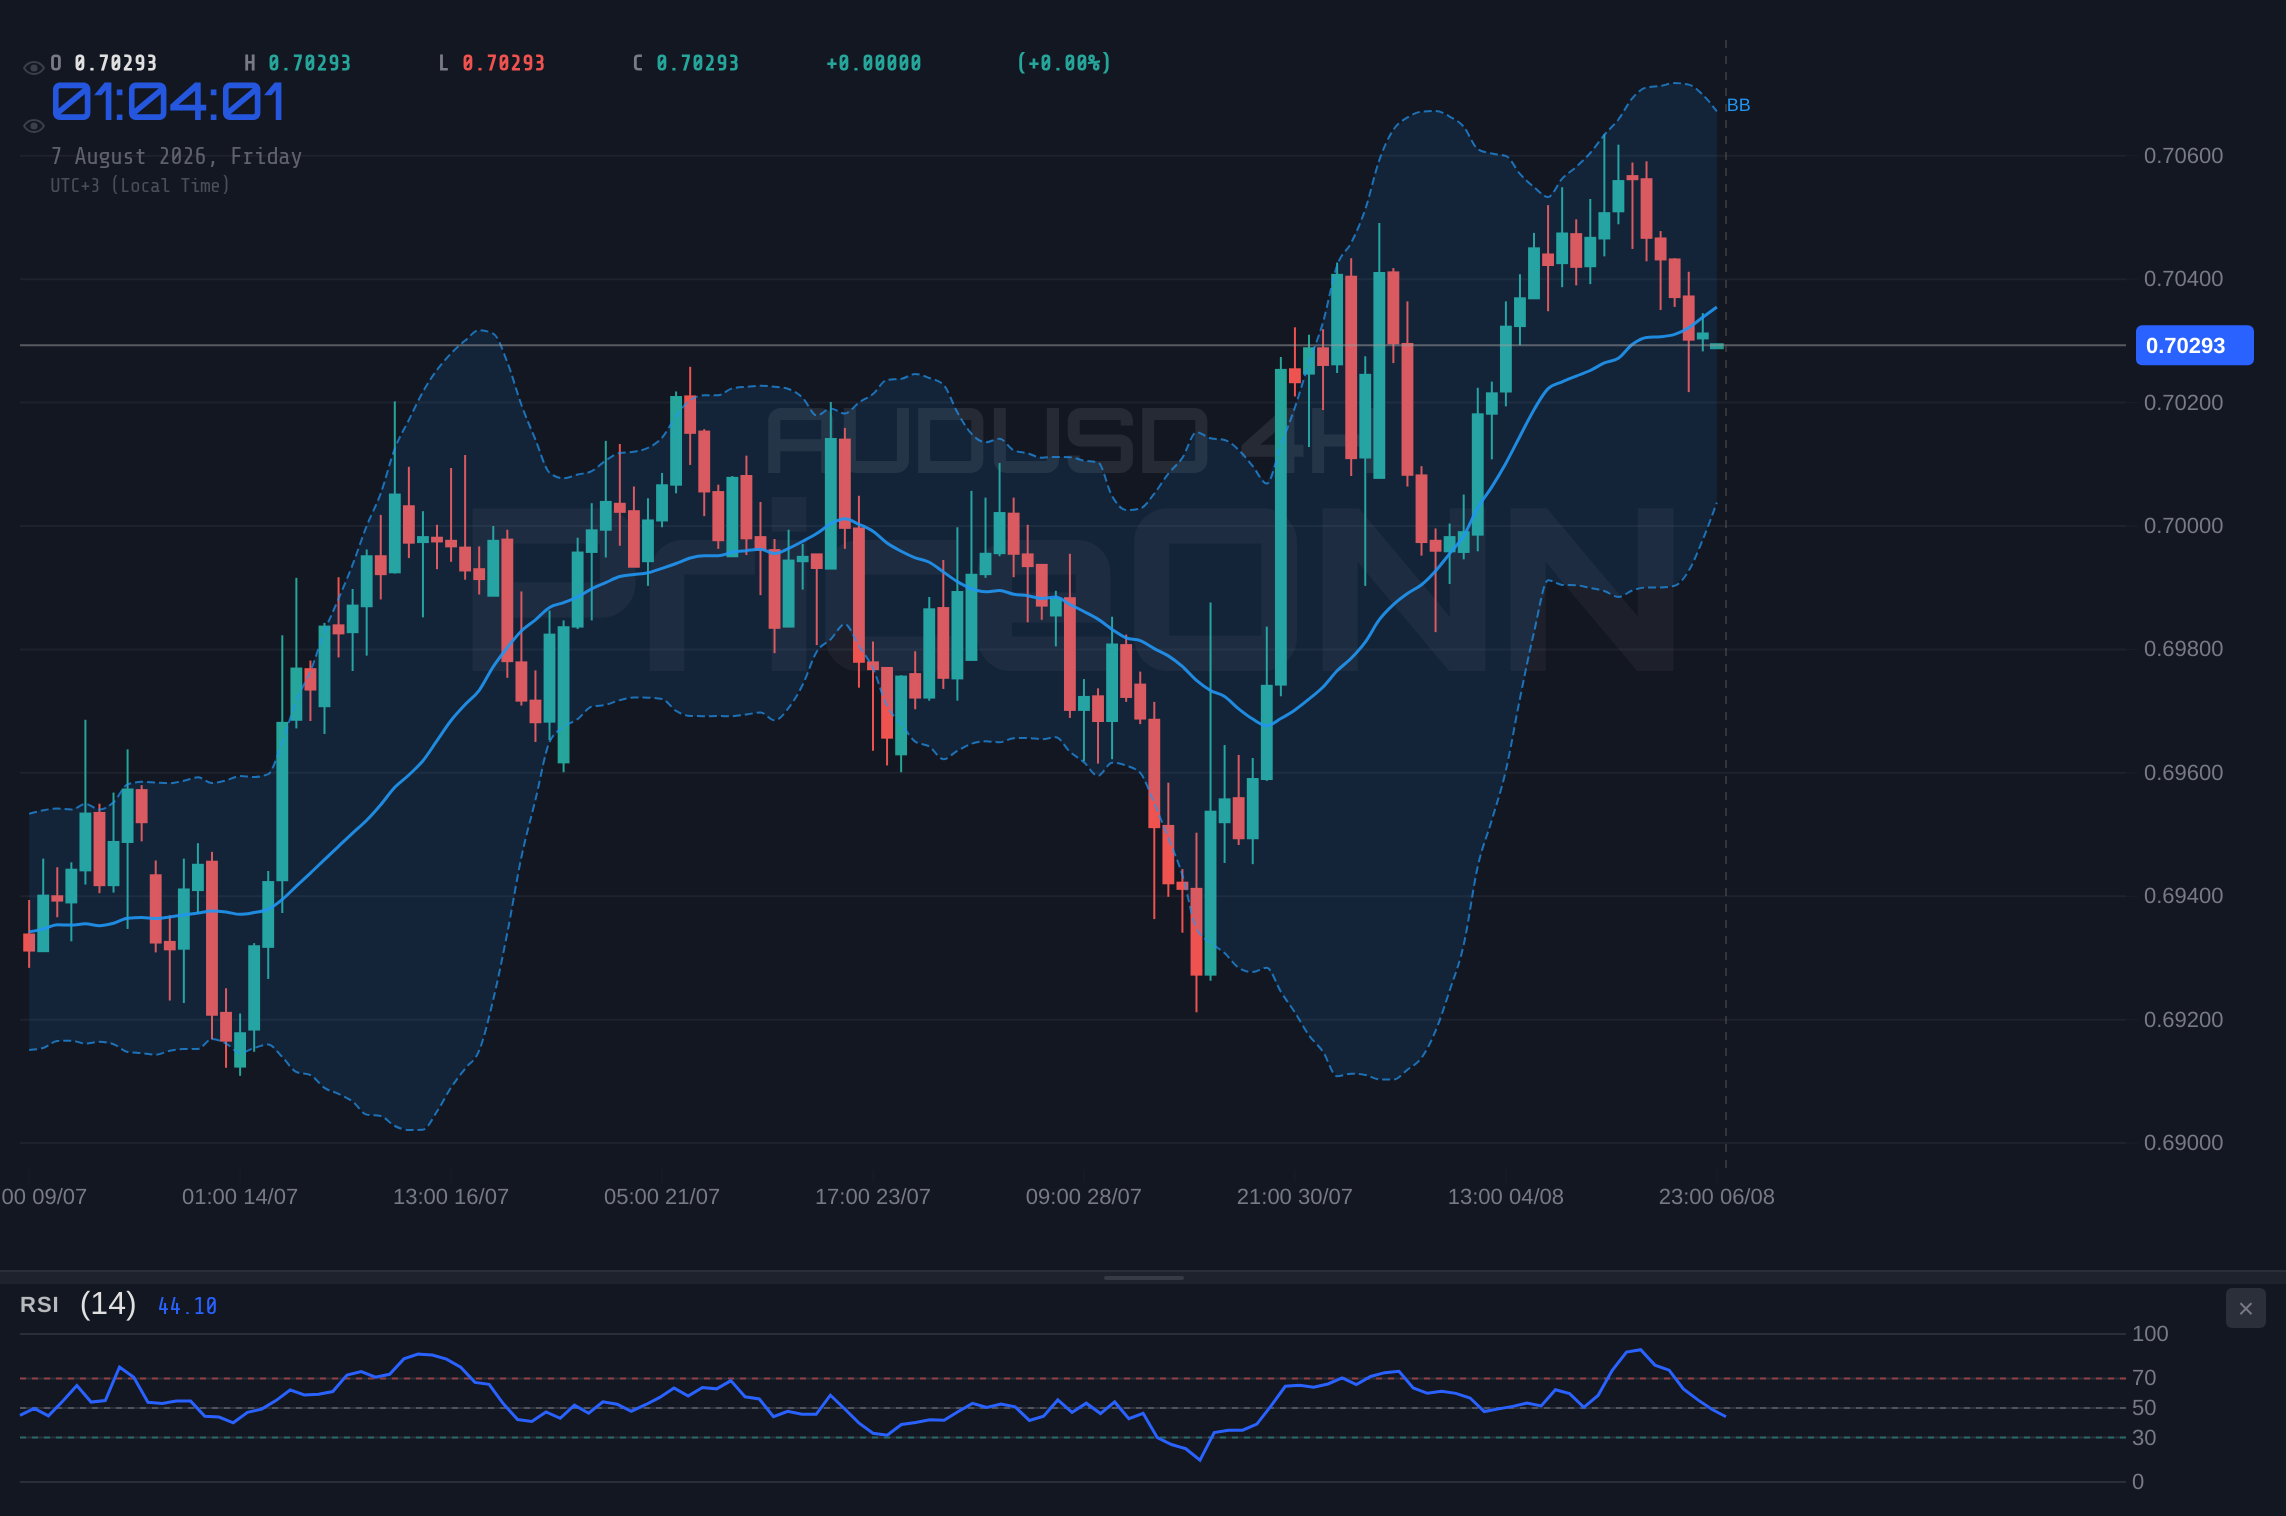
However, when we shift our gaze to the 4-hour timeframe, the narrative begins to change, painting a more constructive picture for AUDUSD. Here, the trend is decidedly bullish, with a strength rating of 97%. The RSI(14) climbs to 62.01, indicating a healthy upward trend without being excessively overbought. The MACD is in positive territory, with its line above the signal line, reinforcing the bullish momentum. The Bollinger Bands show the price trading above the middle band, further supporting the upward bias. Yet, a note of caution emerges from the Stochastic Oscillator on this timeframe: %K is at 37.43 and %D is at 69.26, indicating a bearish signal as %K has crossed below %D, suggesting that a near-term pullback could be on the cards. The ADX reading of 29.72 confirms a strong uptrend on this timeframe, suggesting that any pullbacks might be temporary corrections within a larger bullish structure.
The daily chart analysis for AUDUSD offers a broader perspective, revealing a neutral trend with a 50% strength rating. The RSI(14) stands at 54.97, comfortably within the neutral zone and showing a slight upward inclination, suggesting room for further appreciation. The MACD is positive and above its signal line, aligning with the bullish sentiment observed on the 4-hour chart. However, the Stochastic Oscillator on the daily chart shows %K at 83.59 and %D at 57.69, signaling an overbought condition and a potential reversal or consolidation. This divergence between the MACD's bullish momentum and the Stochastic's overbought warning is a classic scenario where traders need to be vigilant. The ADX at 26.75 suggests a strong uptrend, which, when viewed alongside the Stochastic's overbought reading, implies that while the trend is strong, the pace might be unsustainable without a pause or correction.
Fundamental Drivers: The Macroeconomic Crosscurrents
The economic backdrop is crucial in understanding AUDUSD's current positioning. Last week's employment report from New Zealand, for instance, showed stronger-than-expected hiring despite a rise in unemployment. This kind of data often influences broader commodity currency sentiment, as it can signal underlying economic resilience in the region. For Australia, upcoming economic data releases, such as inflation figures and RBA policy minutes, will be key in shaping the outlook. Investors are closely watching for any signs of inflation persistence or shifts in the Reserve Bank of Australia's stance on interest rates. Any indication of a more hawkish policy could provide a significant boost to the Australian dollar, potentially driving AUDUSD higher.
On the US side, the Federal Reserve's recent meeting has set a cautious tone. While inflation remains a concern, the Fed has signaled a data-dependent approach. The market's interpretation of Fed speak, coupled with upcoming employment data like the ADP report, will be critical. Last week's Non-Farm Payrolls (NFP) data, if it showed a significant deviation from expectations, could have already been priced in, or it could still be a catalyst for further dollar strength or weakness. The consolidation phase observed in USD/JPY and USD/CAD ahead of the ADP report highlights this sensitivity. A strong US employment report would likely bolster the dollar, potentially capping gains in AUDUSD and reinforcing the bearish signals from some of the shorter-term technical indicators.
Geopolitical Tensions and Commodity Currencies
The ongoing crisis in the Strait of Hormuz, with reports of Iranian attacks on vessels, continues to cast a shadow over global markets, particularly impacting energy prices and safe-haven demand. While there were reports of optimism regarding a breakthrough, the market has largely paused, awaiting concrete proof. This geopolitical uncertainty often benefits currencies perceived as safe havens, like the US dollar, while putting pressure on riskier assets and commodity-linked currencies such as the Australian dollar. Brent crude oil prices saw a significant jump of 4.9%, reaching $82.46, a clear indication of the market pricing in supply risks. WTI crude oil also trimmed losses, reflecting similar concerns. This rise in oil prices, while often supportive of commodity currencies, is currently overshadowed by the broader safe-haven bid for the dollar and the increasing geopolitical risk premium.
Gold's recent rally, pushing higher as buying interest strengthens above the $4,200 region, is another factor to consider. Gold's upward trajectory, with a potential target of $4,500 according to some analyses, is supported by both technical and macro factors. However, the correlation between gold and AUDUSD is not always straightforward. While both can benefit from a weaker dollar, gold's safe-haven status can sometimes diverge from the risk-on/risk-off sentiment that typically drives the Australian dollar. The current situation, where gold is rallying amidst geopolitical tensions and a strengthening dollar, suggests that safe-haven demand is a dominant theme, which could indirectly limit AUDUSD's upside potential if the dollar continues its ascent.
The $0.7068 Line in the Sand: What's Next for AUDUSD?
Looking at the key levels, AUDUSD faces immediate resistance at $0.7033, followed by $0.70349 and $0.7037 on the 1-hour chart. A break above these could lead to the more significant $0.7068 level. On the downside, support is found at $0.7029, then $0.70269 and $0.7025. The 4-hour chart shows resistance at $0.70404, $0.70505, and $0.70599, with the daily chart resistance at $0.7068, $0.70801, and $0.70967. Support on the daily chart lies at $0.70393, $0.70227, and $0.70106. The proximity of the current price to the $0.7068 resistance is the primary focus. A decisive break above this level, supported by strong volume and positive fundamental news, could open the door for further gains. Conversely, a failure to break through this resistance, especially with the DXY showing strength and geopolitical risks escalating, could lead to a retracement towards the support levels.
The overall market sentiment, heavily influenced by the DXY's current level of 99.97 and the ongoing geopolitical narratives, suggests a cautious approach is warranted. While the 4-hour and daily charts for AUDUSD show underlying bullish trends, the short-term indicators and the approaching resistance zone present clear challenges. The divergence in signals between different timeframes and indicators - such as the MACD showing fading momentum while the RSI remains neutral-to-bullish - underscores the indecision in the market. Traders will be looking for confirmation, likely through a decisive break above $0.7068 or a clear rejection and fall back towards the $0.7020 area, to guide their next steps. The correlation with DXY strength is a key factor to monitor; any sustained rise in the dollar index would likely cap AUDUSD's upside potential.
The interplay of these factors creates a complex trading environment. The strong uptrend on the 4-hour chart suggests that dips might be seen as buying opportunities by some market participants. However, the resistance at $0.7068, coupled with the overbought signals on the daily Stochastic and the fading MACD momentum on the 1-hour chart, indicates that significant upside might be limited in the short term without a clear catalyst. The ADX readings across timeframes also paint a picture of conflicting trends: strong downtrend on 1H, strong uptrend on 4H, and strong uptrend on 1D. This can signify a period of consolidation or a tug-of-war between buyers and sellers, where the next major economic data release or geopolitical development could tip the scales.
The recent news flow, particularly regarding the Hormuz crisis and its impact on oil prices, adds another layer of complexity. While rising oil prices can sometimes support the Australian dollar due to Australia's commodity export status, the prevailing risk-off sentiment driven by geopolitical tensions tends to favor the US dollar. This creates a potential decoupling scenario where traditional correlations might not hold. Therefore, focusing on the immediate price action around the $0.7068 resistance and the $0.7020 support levels, in conjunction with the DXY's movement, will be paramount for traders attempting to navigate AUDUSD in the coming sessions. Patience and risk management will be key as the market digests these competing forces.
Frequently Asked Questions: AUDUSD Analysis
What happens if AUDUSD breaks above the $0.7068 resistance level?
A decisive break above $0.7068, supported by strong volume and positive Australian economic data, could signal a continuation of the bullish trend observed on the 4-hour chart. This scenario would likely target further resistance levels around $0.70801 and potentially $0.70967. However, this would need to occur despite the current DXY strength at 99.97.
Should I consider buying AUDUSD at current levels near $0.70300 given the RSI at 67.3?
Buying at $0.70300 with an RSI of 67.3 on the 1-hour chart presents a risk, as it's approaching overbought territory and near resistance. While the 4-hour chart shows a bullish trend, the 1-hour MACD shows fading momentum. A more prudent approach might be to wait for a pullback to support levels like $0.7020 or confirmation of a breakout above $0.7068.
Is the MACD histogram showing fading momentum a strong sell signal for AUDUSD at $0.70300?
The negative MACD momentum on the 1-hour chart, with the line below the signal line, does suggest weakening bullish momentum. While not a definitive sell signal on its own, it aligns with the approaching resistance at $0.7068 and the strong DXY reading at 99.97, indicating potential downside risk from current levels.
How will the upcoming Australian inflation data affect AUDUSD near $0.70300?
Higher-than-expected Australian inflation data could strengthen the AUD, potentially helping it break through the $0.7068 resistance. Conversely, softer inflation figures might reinforce the downward pressure from a strong DXY, leading to a test of support levels around $0.7020. The market's reaction will depend on whether the data signals a hawkish or dovish RBA stance.
Bearish Scenario: Pullback Looming?
65% ProbabilityNeutral Scenario: Consolidation Above $0.7020
25% ProbabilityBullish Scenario: Breaking the Ceiling
10% Probability| Indicator | Value | Signal | Interpretation |
|---|---|---|---|
| RSI (14) | 48.76 | Neutral | Slight downward trend, indicating caution. |
| MACD Histogram | -0.0015 | Bearish | Negative momentum, potential selling pressure. |
| Stochastic %K | 75.18 | Bullish | Potential short-term upward move signal on 1H. |
| ADX | 33.58 | Strong Trend | Confirms strong trend on 1H, but directionality needs context. |
Track markets in real-time
AI-powered analysis, technical indicators and real-time price data.
Join Our Telegram Channel
Breaking market news, AI analysis and trading signals instantly.
Join Channel