

The currency markets are holding their breath as August begins, with the USDJPY pair currently hovering around the critical $157.80 level. Last week was characterized by consolidation, a pause in the relentless yen weakness that has dominated headlines for months. This relative calm, however, is a fragile one, built on the anticipation of significant upcoming economic data and the lingering specter of currency intervention. As traders digest the Federal Reserve's latest policy signals and brace for the Non-Farm Payrolls (NFP) report, the question isn't just where USDJPY will go next, but which fundamental and technical drivers will ultimately dictate its path.
- The USDJPY pair is consolidating around $157.80, reflecting market indecision ahead of key US economic data.
- Critical support for USDJPY sits at $157.754, tested multiple times this week, while resistance is eyed at $158.754.
- The recent US jobs data showed an unexpected loss of 23,000 jobs, potentially altering Fed rate hike expectations and impacting the dollar's strength.
- The DXY (Dollar Index) is showing signs of weakness, currently trading at 99.58, which typically puts pressure on USD pairs and gold.
Last week presented a fascinating tableau for currency traders. The US Dollar Index (DXY) continued its consolidation phase, hovering around 99.58, signaling a temporary pause in its upward momentum. This indecision in the dollar index often translates into choppy price action across major currency pairs, and USDJPY was no exception. While the pair managed to hold above key support levels during the week, it struggled to make significant headway above resistance, painting a picture of a market awaiting a catalyst.
The backdrop to this consolidation has been the ongoing narrative surrounding central bank policies. The Federal Reserve, having signaled a pause in its aggressive rate-hiking cycle, is now in a data-dependent mode. Market participants are meticulously dissecting every piece of economic data for clues about the future path of interest rates. Higher interest rates in the US typically support the dollar, and the USDJPY pair, which often exhibits an inverse correlation with the DXY, has been particularly sensitive to these shifts. However, the prospect of intervention by Japanese authorities to curb yen weakness has added another layer of complexity, creating an asymmetric trade environment.
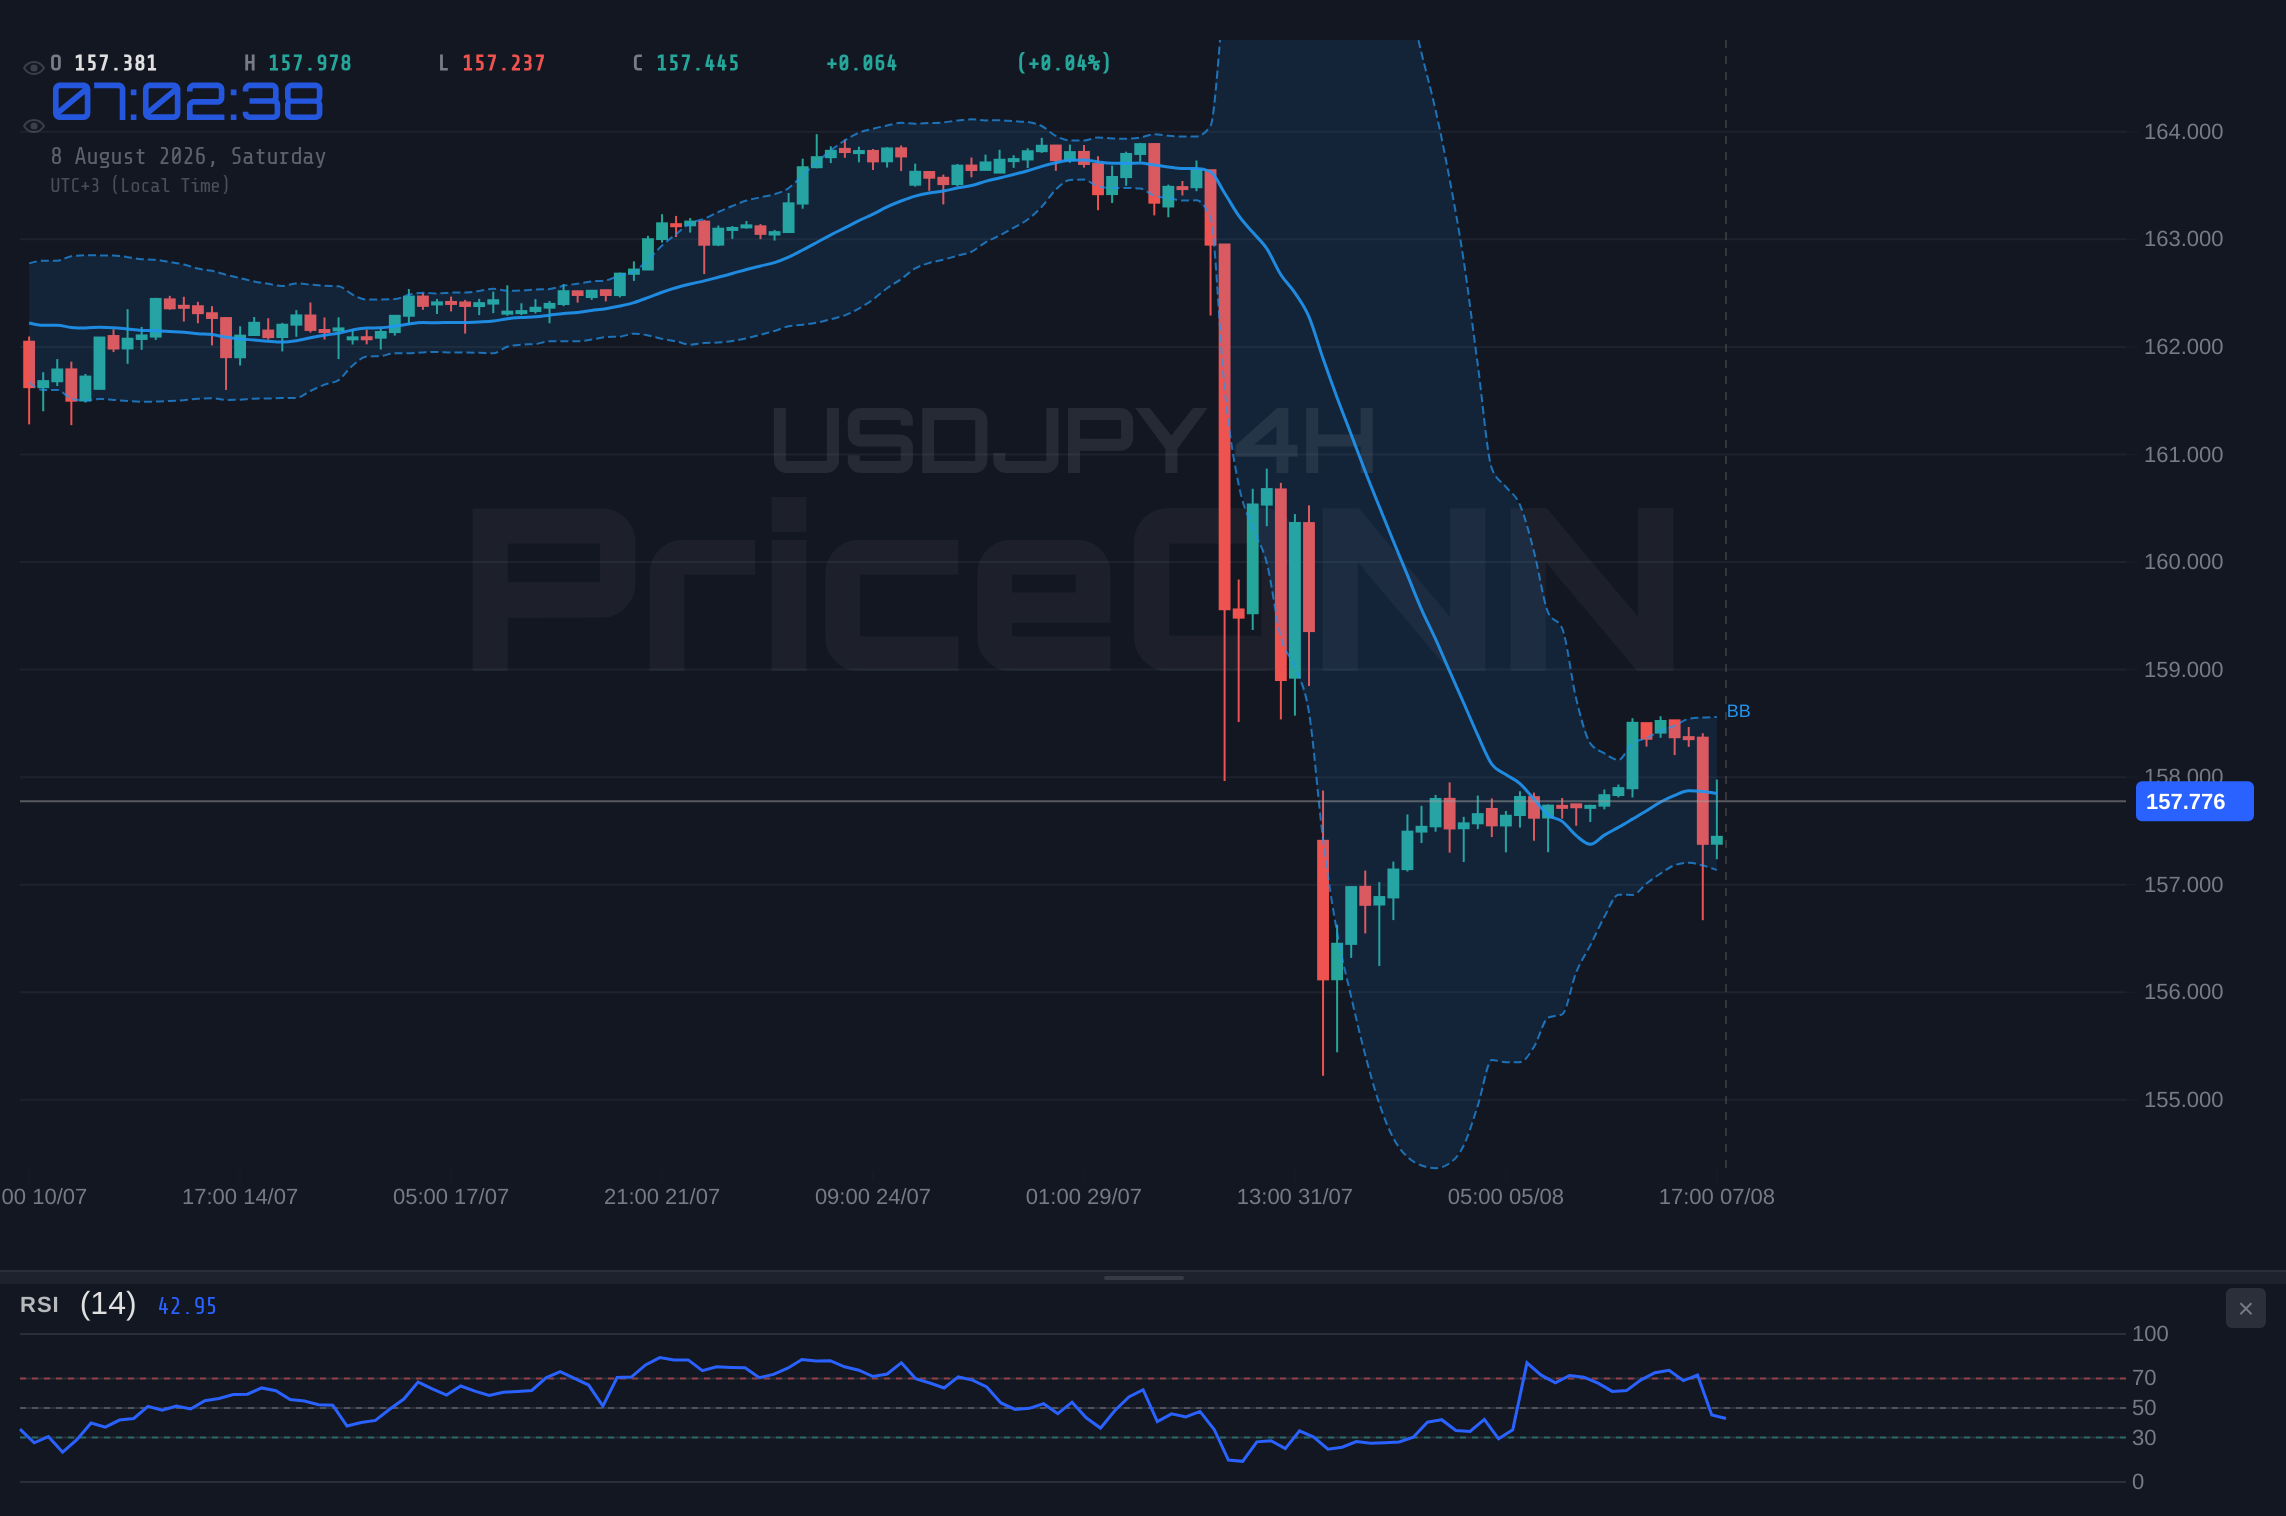
The recent PriceONN market news highlighted this delicate balance. Reports indicated that USD/JPY was holding firm, with the yen losing some support, yet facing intervention risks. This suggests a tug-of-war between the fundamental strength of the US dollar, driven by interest rate differentials and economic outlook, and the potential for direct market intervention by Japanese policymakers. The mention of intervention rumors causing USD/JPY to fall on August 3rd underscores the sensitivity of this pair to any perceived official action from Tokyo. This intervention risk is a significant factor that can override purely technical considerations, forcing traders to remain cautious.
Navigating the Yen's Tightrope Walk
The Japanese Yen's performance has been a major theme in global forex markets. For much of the year, it has been under significant pressure, depreciating against a basket of major currencies. This weakness has been attributed to the Bank of Japan's (BoJ) continued accommodative monetary policy, which stands in stark contrast to the tightening cycles seen in other major economies. While the BoJ has made subtle shifts in its yield curve control policy, it has largely refrained from aggressive tightening, allowing interest rate differentials to widen and put downward pressure on the yen.
The PriceONN market news from August 3rd, particularly 'Why Japan and US Confirm Intervention So Fast? Can USD/JPY Hold 155?', points to the authorities’ heightened concern. The fact that intervention was confirmed so rapidly suggests a low tolerance for further yen depreciation. This can create a 'risk-off' sentiment for yen shorts, as any sustained move higher in USDJPY could be met with official selling of dollars and buying of yen. The support level at 155.00, which was a major psychological barrier, has been tested and, at times, breached, but the swift confirmation of intervention suggests that policymakers are determined to prevent a disorderly depreciation.
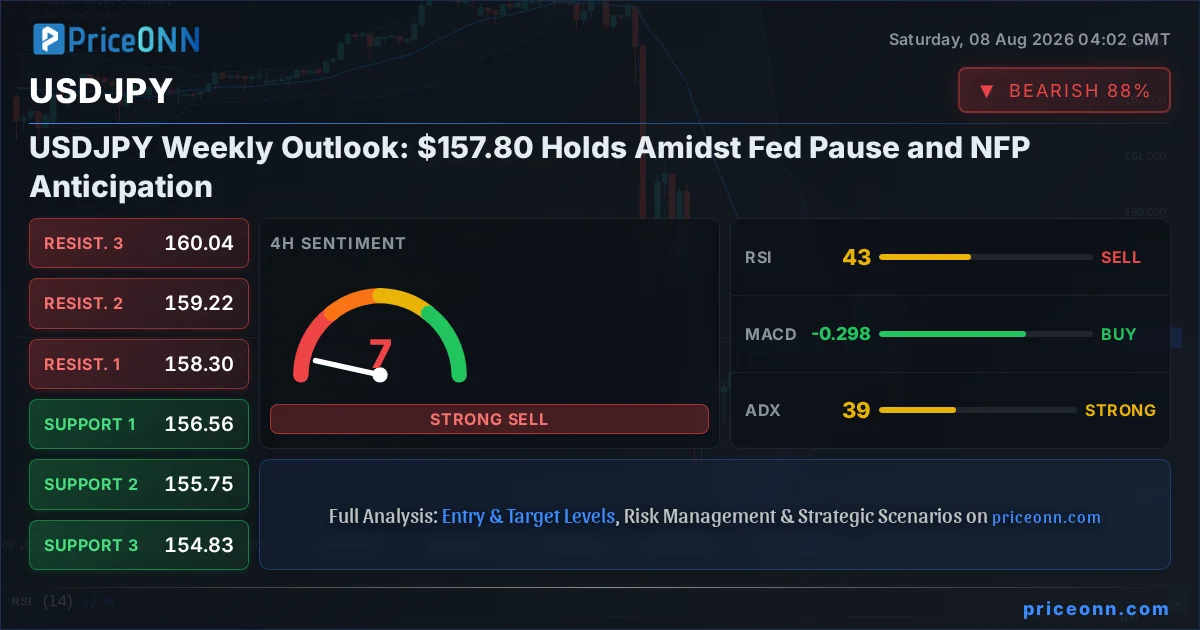
Technically, the 1-hour chart for USDJPY shows a neutral trend with a power of 50%, suggesting indecision. Support is identified at 157.471, 157.399, and 157.325, while resistance hovers around 157.617, 157.691, and 157.763. The RSI(14) at 45.72 indicates a neutral zone with a slight downward bias, and the MACD shows negative momentum. However, the ADX at 40.01 suggests a strong trend is in play, albeit with mixed signals from other indicators. This technical picture reflects the current market state: a battleground where short-term fluctuations are occurring within a larger, uncertain trend.
The 4-hour timeframe offers a slightly different perspective. The trend remains neutral with 50% power. Key support levels are seen at 156.564, 155.748, and 154.826, with resistance at 158.302, 159.224, and 160.04. The RSI(14) at 43.35 still points to a neutral zone with a downward lean, but the MACD shows positive momentum, and Stochastic has turned upwards, albeit from oversold levels. The ADX at 39.15 still indicates a strong trend. This divergence across timeframes and indicators highlights the difficulty in establishing a clear direction without a significant market-moving event.
The Dollar's Balancing Act: DXY and Macro Drivers
The US Dollar Index (DXY), a benchmark for the dollar's strength against a basket of major currencies, has been a crucial barometer for USDJPY's movements. Currently trading around 99.58, the DXY has experienced a period of consolidation. This pause suggests that the market is reassessing the trajectory of US monetary policy and the overall health of the US economy. The recent news that the US economy unexpectedly lost 23,000 jobs in July, contrary to projections of an increase, has undoubtedly cast a shadow over the dollar's outlook.
This negative jobs report is a significant development. Historically, strong NFP numbers bolster the dollar by increasing the likelihood of further Federal Reserve rate hikes or a prolonged period of higher rates. Conversely, a weak report, especially one showing job losses, dampens these expectations. The market's reaction, with gold prices surging above $4,300 and a potential reduction in September rate-hike odds, underscores the sensitivity of financial markets to employment data. For USDJPY, this could mean a weakening of the dollar's support, potentially leading to further downside pressure if the trend holds.
On the 1-hour chart for DXY, the trend is neutral with 50% power. Support is found at 99.53, 99.50, and 99.48, with resistance at 99.57, 99.59, and 99.62. The RSI(14) at 36.17 is in neutral territory but trending down, while the MACD shows negative momentum. The ADX at 37.69 still points to a strong trend, but the confluence of weak jobs data and mixed signals suggests caution. The 4-hour chart mirrors this indecision, with support at 99.26, 99.05, and 98.71 and resistance at 99.82, 100.16, and 100.37. The Stochastic's move to oversold territory, coupled with a downward-trending RSI, suggests potential for a dollar rebound, but the underlying macro trend is under scrutiny.
The implications for USDJPY are clear: any sustained weakness in the DXY, driven by a less hawkish Fed outlook or economic concerns, could lead to a depreciation of the dollar against the yen. This is a crucial dynamic to watch. While the interest rate differential has been a primary driver of USDJPY's ascent, a shift in Fed policy expectations could quickly alter the landscape. The fact that the DXY is consolidating, and the recent jobs report has introduced uncertainty, means that the dollar's recent strength might be tested.
Cross-Market Correlations: Gold, Oil, and Risk Sentiment
Beyond the direct interplay between the dollar and the yen, a broader market analysis reveals how other asset classes are reacting, providing context for USDJPY's potential moves. Gold, often seen as a safe-haven asset and an inflation hedge, has seen a significant surge, breaking above $4,300 following the weak US jobs report. This move suggests that investors are seeking refuge and anticipating a less hawkish stance from the Fed, which could reduce inflation pressures or at least lower the odds of further rate hikes. The correlation between gold and USDJPY is often inverse; as gold rises on dollar weakness or risk-off sentiment, USDJPY might face headwinds.
Oil prices (Brent at $81.31 and WTI at $78.29) have shown a different story, experiencing declines. This could be attributed to a variety of factors, including softening global demand expectations (potentially linked to economic slowdown fears) or easing geopolitical tensions, although the latter is always subject to rapid change. The recent news mentioning Hormuz, Saudi warnings, and US-China tensions suggests that geopolitical risks remain elevated, even if oil prices are currently retreating. These geopolitical undercurrents can quickly shift market sentiment, impacting risk appetite and, by extension, currency pairs like USDJPY.
The broader equity markets, represented by the SP500 at 6572.87 and Nasdaq 100 at 29706.54, have shown resilience with recent gains, despite the negative jobs data. This might indicate a market that is pricing in a 'Fed pivot' scenario – that is, the central bank will ease policy to support growth. However, the SP500's 1-day trend is technically showing a strong downtrend (ADX 47.51), which contradicts the intraday gains. This divergence is a key point of tension. If risk appetite were to truly sour, leading to a sell-off in equities, we would typically expect a flight to safety, potentially benefiting the yen, even amidst intervention concerns. The current scenario sees a mix of risk-on in equities and risk-off in commodities like gold, creating a complex environment for USDJPY.
The interplay between these markets is crucial. A sustained rise in gold, coupled with a weakening DXY and a potential decline in risk assets like the SP500, would build a strong bearish case for USDJPY, despite the intervention overhang. Conversely, if the Fed signals a continued commitment to fighting inflation, or if geopolitical risks escalate significantly, the dollar could find renewed strength, potentially pushing USDJPY higher, even if the jobs report was weak. The current technical picture is mixed, with some indicators suggesting a strong trend while others show divergence or consolidation, making fundamental drivers even more critical.
The Technical Battleground: Levels and Indicators
On the daily timeframe, USDJPY presents a picture of cautious neutrality, with trend strength at 50%. Support levels are identified at 4207.78, 4175.16, and 4127.03 for XAUUSD, and for USDJPY, they are at 157.754, 157.151, and 156.754. Resistance is seen at 4288.53, 4336.66, and 4369.28 for XAUUSD, and for USDJPY, at 158.754, 159.151, and 159.754. The RSI(14) is at 31.42, indicating oversold conditions, but with a downward trend. The MACD shows negative momentum, and Bollinger Bands are below the middle band, suggesting a bearish bias. However, the ADX at 36.24 still signals a strong downtrend. This daily view paints a picture of potential downside, but the strength of the trend suggested by ADX needs to be considered alongside the mixed signals from other indicators.
The Stochastic indicator on the daily chart shows K=31.38 and D=25.45, which is a bullish signal (%K > %D) and suggests a potential upward correction from oversold levels. This is in direct conflict with the RSI and MACD readings. Such divergences are common in consolidating markets or at potential turning points. The key here is confirmation. A sustained move above the middle Bollinger Band, coupled with a positive MACD crossover and a rising RSI, would be needed to validate a bullish reversal. Until then, the downtrend suggested by the ADX and the bearish bias from RSI/MACD on shorter timeframes remain significant.
The overall signal for USDJPY on the daily chart is SELL (1 Sell, 7 Neutral, 0 Buy). This is a strong indication of downward pressure from a longer-term perspective. However, the conflicting signals from shorter timeframes (1H and 4H showing more Buy signals) and the Stochastic on the daily chart suggest that immediate downside might be limited, or at least face significant headwinds from potential short-covering rallies or intervention.
The ADX value of 39.15 on the 4-hour chart and 40.01 on the 1-hour chart is particularly noteworthy. These readings indicate a strong trend is present on shorter timeframes. When the ADX is this high, it suggests that price movements are not random but are part of a directional move. The question is, which direction? The daily chart's bearish bias, contrasted with the shorter-term bullish signals and the Stochastic's potential reversal, creates a complex trading environment. Traders must be acutely aware of the potential for sharp reversals or consolidations as these conflicting signals play out.
Trade Scenarios: Bulls vs. Bears at $157.80
Bearish Scenario: Yen Strength Prevails
65% ProbabilityNeutral Scenario: Consolidation Continues
25% ProbabilityBullish Scenario: Dollar Reasserts Dominance
10% ProbabilityThe current technical setup, particularly the strong ADX readings on shorter timeframes suggesting a trend is in place, leans towards the bearish scenario as the most probable outcome. However, the conflicting daily indicators and the specter of intervention mean that a neutral consolidation scenario cannot be entirely dismissed. The bullish scenario remains the least likely unless there is a significant shift in the macro-economic narrative or a clear failure of intervention efforts.
The recent jobs report, showing an unexpected loss of jobs, significantly impacts the probability of a Fed rate hike. If the Fed signals a dovish turn or a prolonged pause, the dollar could weaken broadly, supporting the bearish case for USDJPY. Conversely, if geopolitical risks escalate, the dollar might find safe-haven demand, complicating the outlook. The key will be how these fundamental factors interact with the technical levels, particularly the support at 157.754 and resistance at 158.754.
Looking Ahead: What's Next for USDJPY?
As we move into the coming week, the focus remains squarely on economic data and central bank commentary. The fallout from the recent US jobs report will continue to be digested, and any further signals from the Federal Reserve regarding their policy path will be crucial. For USDJPY, the $157.80 level represents a battleground. A break below the support at 157.754 could open the door for a move towards 157.151 and potentially 156.754, especially if the dollar continues to weaken on the back of dovish Fed expectations. The strong ADX readings on shorter timeframes suggest that if a breakdown occurs, it could be swift.
However, the threat of Japanese intervention cannot be ignored. Any hint of official action could lead to sharp, albeit potentially temporary, reversals. This adds a significant risk premium to trading USDJPY. Traders should remain vigilant for any news from Japanese authorities or any unusual price action that might signal intervention. The market sentiment, currently mixed with risk-on in equities but risk-off in commodities like gold, will also play a role. A significant shift towards risk aversion could see a flight to perceived safe havens, including the yen, putting further pressure on USDJPY.
The technical picture, while showing some conflicting signals, leans towards caution. The daily chart suggests potential downside, but the strength of the trend indicated by ADX on shorter timeframes needs careful monitoring. The current price of $157.80 is a pivotal point. A clear break and sustained hold above resistance at 158.754 would be needed to invalidate the bearish bias, while a decisive break below support at 157.754 would likely accelerate the downward move. Patience and risk management will be paramount as traders navigate this complex and data-driven landscape.
Frequently Asked Questions: USDJPY Analysis
What happens if USDJPY breaks decisively below the $157.754 support level?
A break below $157.754, especially with confirmation from a weakening DXY and dovish Fed signals, could trigger a move towards the next support levels at $157.151 and potentially $156.754. The strong ADX on shorter timeframes suggests this move could be rapid.
Should I consider buying USDJPY at current levels around $157.80 given the mixed signals?
Buying at current levels carries significant risk due to conflicting indicators and the potential for intervention. A more prudent approach might be to wait for a clear breakout above resistance at $158.754 or a confirmed move lower towards support zones, coupled with a clearer macro picture.
Is the RSI at 31.42 on the daily chart a buy signal for USDJPY?
While an RSI of 31.42 suggests oversold conditions on the daily chart, it is not a standalone buy signal. It conflicts with bearish MACD momentum and strong ADX trend readings. Confirmation from other indicators and price action above key resistance levels is crucial before considering a bullish reversal.
How will the recent US jobs report impact USDJPY this week?
The unexpected loss of jobs in the US could lead to a weaker dollar if it signals a more dovish stance from the Federal Reserve. This would likely put downward pressure on USDJPY, especially if the DXY continues to decline. However, intervention risks from Japan remain a wildcard.
Track markets in real-time
AI-powered analysis, technical indicators and real-time price data.
Join Our Telegram Channel
Breaking market news, AI analysis and trading signals instantly.
Join Channel